18 W Washington Ave #24 · Yakima, WA
Flood risk 1/10 · Minimal
- FEMA flood zone
- X (unshaded)
- Chance of flooding over 30 yrs
- 0.0%
- Est. flood insurance / yr
- $507 – $1,088
Fire risk 7/10 · Major
- Est. fire insurance / yr
- $604 – $1,122
Heat risk 5/10 · Moderate
- Hot days now (above 98°F)
- 7 days/yr
- Hot days in 30 yrs
- 14 days/yr
Wind risk 1/10 · Minimal
- Chance of severe wind over 30 yrs
- —
Air-quality risk 9/10 · Severe
- Unhealthy air days now
- 16 days/yr
- Unhealthy air days in 30 yrs
- 19 days/yr
Risk factors via First Street. Map © Google.
Why this score? — see what drove the C+ grade
The composite is a weighted blend of 9 inputs, each scored 0–100. Each bar is that input's sub-score; the figure is the points it added to the 100-point composite (weight × sub-score).
- Cash flow +30.0/30.0
- 1% rule +10.0/10.0
- DSCR +10.0/10.0
- Livability +4.0/5.0
- Schools +3.4/10.0
- Rent growth +2.5/5.0
- Condition / age +2.5/5.0
- ARV discount +0.0/15.0
- Appreciation +0.0/10.0
$79,950
🖨 Deal sheet 📄 Offer letter ✓ Due diligence
Listing remarks MLS
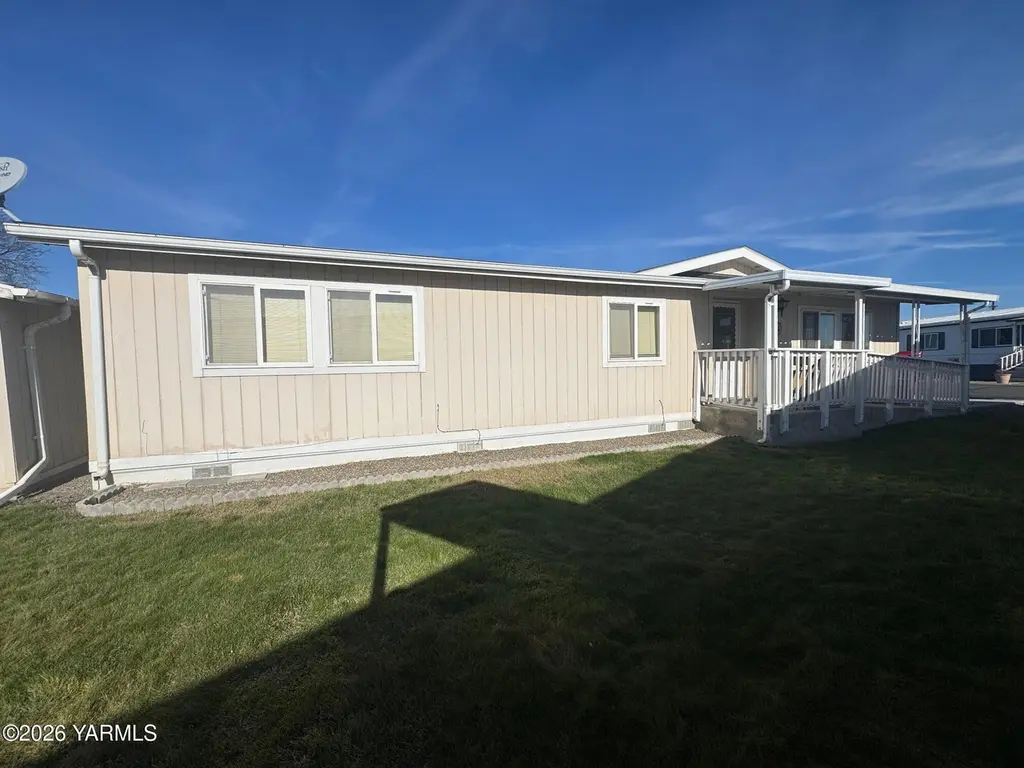
Space-24 Golden Villa a 55+ community has this 1991 3bed/2bath in excellent condition with ramp and newer roof ready with all kitchen appliances plus the wash/dryer. This move-in ready Double wide MH has s spacious primary bedroom with full bath, large living room with beautiful large windows to enjoy the morning sunlight. This is a really nice well kept home with interior high ceiling. There are 2 storage units that will stay with home. call a Realtor for a private showing. Financing available for MH with NEXA Lending. ask agent for details.
Key facts
- Built 1991
- Listed 115 days
Neighborhood map
What this means for you Summary
Snapshot
- This is a 3-bed/2.0-bath single-family listed at $80k.
Deal economics
- At list price, monthly cash flow is $862 ($10k/yr) — positive.
- The deal already cash-flows at list — no discount required.
- Meets the 1% rule at list price ($2k rent vs $80k).
- Recommended offer: $73k (9.0% below list) — sets the bar for market timing.
- Cap rate 19.2% vs local median 3.4% in Yakima — top-decile yield for the area; either an underpriced asset or a hidden risk that comps aren't pricing in. Stress-test before assuming the spread holds.
Location & tenants
- Location reads 80/100 on livability (#98 in WA, #1,912 nationally) — a professional / high-income tenant draw. Strengths: amenities A+, commute A+, housing A+; Watch: employment D, crime F.
- Yakima School District (urban): math 34% / reading 42% proficiency, ranked #238 of 291 in WA (top 82%) — families likely to look elsewhere, expect single-tenant / working-renter base with shorter leases; 76% free/reduced lunch — lower-income household profile, screen leases tightly.
- Market conditions: 172 active listings in the ZIP; 11 comparable units currently listed for rent nearby; rentals at typical pace (median 21d on market — plan ~3-4 weeks tenant-placement turnaround); 468 units permitted in Yakima County in 2024 (23 in 5+ unit buildings).
Forward outlook
- Local home prices are declining (-3.0%/yr); year-one equity from $552 of loan paydown is wiped out by about $2k of value loss. Plan a longer hold.
- Yakima County population projected at +6% by 2050 — modest demand growth; plan on rents tracking national, not racing it.
- At projected returns (-3.0% appreciation + 3.0% rent growth), your $22k cash investment doubles in ~3 years — after that, you're playing with house money.
Negotiation context
- It's been on market 115 days — a 9% lower offer ($73k) is reasonable based on typical stale-listing flexibility.
- 3 sale attempts since 10y ago with the ask held roughly flat each time — persistent listings suggest the price (not the market) is what's stuck; bring a comps-based counter.
- Current owner paid $54k; 49% above their basis — modest negotiation headroom, anchor on the comps not their cost.
Risks & watch-outs
- Climate carrying-cost: major wildfire risk; extreme-heat days projected 7→14/yr by 2055 (HVAC capex compounding) — expect insurance premiums to compound above CPI over the hold.
Questions for the listing agent
- It's been on market 115 days. Have you received any prior offers? Is the seller open to a 9% concession, seller financing, or rate buy-down credit?
- Why hasn't it sold? Are there any deal-killer items the seller is aware of (foundation, flood, title, zoning, code violations)?
- Is there a deadline driving the sale (1031 exchange, divorce, estate, relocation)? That informs how much negotiation room exists.
- Crime grade is F in this area — have there been break-ins, vandalism, or insurance claims at this property in the last 3 years? What carrier currently insures it and at what premium?
- What's the average days-on-market for RENTAL listings here right now (not sales)? A rising rental-DOM trend means longer vacancies and softer asking-rent achievability than the comps imply.
- What's the recent tenant-quality profile in this submarket — average credit score on applications, eviction rate, late-payment / NSF rate, and stable-employment percentage? A property-management company in the area should have these aggregated.
- How much new for-sale + rental construction is in the pipeline within 1–3 miles? Heavy new supply typically softens prices + rents 12–24 months out; constrained supply supports both.
Investment metrics
- 1% rule
- 2.17% ✓
- Cap rate
- 19.22%
- Cash-on-cash
- 46.18%
- DSCR
- 3.05
- GRM
- 3.8
CMA / ARV
- ARV (median comp)
- $57,615
- List price
- $79,950
- Delta
- 38.77%
- Verdict
- OVERPRICED
- Comps
- 20 within 1.0 mi
Show comp detail 9 sales within ~0.75 mi
| Address | Dist | Beds/Ba | Sqft | Sold | Price | $/sf | Match |
|---|---|---|---|---|---|---|---|
| 104 Whitman St | 0.45mi | 3/1.0 | 1,395 (-1%) | 12mo | $325,000 | $233 | 64 |
| 2020 S 1st Ave | 0.43mi | 3/2.0 | 1,456 (+4%) | 19mo | $285,000 | $196 | 58 |
| 2203 S 5th Ave | 0.70mi | 3/1.0 | 1,424 (+1%) | 8mo | $250,000 | $176 | 54 |
| 28 W Logan Ave | 0.70mi | 3/2.0 | 1,383 (-2%) | 21mo | $305,000 | $221 | 47 |
| 63 W Whatcom St | 0.37mi | 3/2.0 | 1,240 (-12%) | 21mo | $345,000 | $278 | 46 |
| 2002 Landon Ave | 0.34mi | 2/1.0 (-1) | 1,574 (+12%) | 12mo | $260,000 | $165 | 45 |
| 2208 S 3rd Ave | 0.62mi | 3/2.0 | 1,196 (-15%) | 2mo | $332,400 | $278 | 45 |
| 2106 S 5th Ave | 0.68mi | 3/1.0 | 1,334 (-5%) | 21mo | $256,000 | $192 | 38 |
| 501 Whatcom St | 0.65mi | 3/1.0 | 1,216 (-13%) | 8mo | $275,000 | $226 | 37 |
Match score weights: distance 35% · size 25% · config 20% · recency 20%. Top-matched comps best support the ARV.
Projected returns pro-forma
-3.0% appreciation · 3.0% rent growth · sell at horizon
- IRR
- 43.4%
- Equity multiple
- 2.87×
- Total profit
- $41,916
- Equity at exit
- $11,921
- IRR
- 49.4%
- Equity multiple
- 5.79×
- Total profit
- $107,152
- Equity at exit
- $6,913
Cash invested: $22,386 (down + closing). Projections, not guarantees.
Landlord ↔ Tenant lean methodology
- Overall (STATE)
- 28 Tenant-Leaning
- State Washington
- 28 Tenant-Leaning · D+8
- County
- — inherits STATE
- City
- — inherits STATE
ZIP-level market 98903
- Home prices YoY
- -21.8%
- Active inventory
- 172
- Price-to-rent
- 3.8×
Monthly cashflow live
- Estimated rent
- $1,734 high interval (Pro) →
- Mortgage (P&I)
- −$419
- Tax from tax record
- −$56 /mo · $671/yr
- Insurance
- −$33
- HOA
- −$0
- Vacancy / Maint / Mgmt
- −$364
- Net cashflow
- $862
Break-even live
UW: 25.0% down · 7.5% · 30yr · 1.5% tax · 5.0% vac · 8.0% maint · 8.0% mgmt
Financing live
Cash to close
- Down payment
- $19,988
- Closing costs
- $2,398
- Reserves months
- —
- Total cash needed
- —
Loan-product check · same deal, 3 products live
Conventional
25% down · 7.5% · 30yr
- Down + closing
- —
- Monthly P&I
- —
- Monthly cashflow
- —
- DSCR
- —
- Eligible?
- —
Personal DTI + credit; lowest rate.
DSCR
20% down · 8.5% · 30yr
- Down + closing
- —
- Monthly P&I
- —
- Monthly cashflow
- —
- DSCR
- —
- Eligible?
- —
No personal income docs; deal must DSCR.
Hard money
10% down · 12.0% · 12mo
- Down + closing
- —
- Monthly P&I
- —
- Monthly cashflow
- —
- DSCR
- —
- Eligible?
- —
Short-term bridge; refi at stabilization.
Rent comps 11 comps
| Address | Beds | Baths | Sqft | Rent | $/sqft | DOM | Units | Dist |
|---|---|---|---|---|---|---|---|---|
| 1917 Landon Ave Union Gap, WA | 3.0 | 2.0 | 1400 | $2,100 | $1.50 | 43d | 1 | 0.30mi |
| Samantha Ct Union Gap, WA | 3.0 | 2.5 | 1437 | $1,900 | $1.32 | 21d | 1 | 0.53mi |
| 2212 S 1st Ave Unit 1-3 Union Gap, WA | 3.0 | 2.0 | 1200 | $1,900 | $1.58 | 13d | 1 | 0.55mi |
| 1606 S 1st Ave Unit 1 Yakima, WA | 2.0 | 1.0 | 911 | $1,250 | $1.37 | 13d | 1 | 0.55mi |
| 1512 Landon Ave Unit 1 Yakima, WA | 3.0 | 1.0 | 1200 | $1,500 | $1.25 | 21d | 1 | 0.59mi |
| 1401 S 4th Ave Unit 1 Yakima, WA | 3.0 | 2.0 | 1320 | $1,495 | $1.13 | 21d | 1 | 0.86mi |
| 809 W Washington Ave Yakima, WA | 2.0 | 2.0 | 1264 | $1,595 | $1.26 | 13d | 1 | 0.92mi |
| 1418 Cornell Ave Yakima, WA | 3.0 | 1.0 | 1000 | $1,800 | $1.80 | 43d | 1 | 0.96mi |
| 1121 E Viola Ave Yakima, WA | 3.0–4.0 | 2.0 | 1168 | $1,200 | $1.03 | 13d | 1 | 1.01mi |
| 1106 Spokane St Yakima, WA | 3.0 | 1.0 | 1400 | $1,795 | $1.28 | 21d | 1 | 1.12mi |
| 808 S 2nd Ave Unit A Yakima, WA | 3.0 | 2.0 | 1133 | $1,495 | $1.32 | 43d | 1 | 1.41mi |
Listing history 12 events
-
2026-06-07statusdays on market $79,950 Pending 115 DOM
-
2026-06-05days on market $79,950 Active 113 DOM
-
2026-06-03days on market $79,950 Active 112 DOM
-
2026-06-02days on market $79,950 Active 111 DOM
-
2026-06-01days on market $79,950 Active 110 DOM
-
2026-05-31days on market $79,950 Active 109 DOM
-
2026-05-30days on market $79,950 Active 108 DOM
-
2026-02-11$79,950 Active 548-char remark
Show marketing remark (548 chars)
Space-24 Golden Villa a 55+ community has this 1991 3bed/2bath in excellent condition with ramp and newer roof ready with all kitchen appliances plus the wash/dryer. This move-in ready Double wide MH has s spacious primary bedroom with full bath, large living room with beautiful large windows to enjoy the morning sunlight. This is a really nice well kept home with interior high ceiling. There are 2 storage units that will stay with home. call a Realtor for a private showing. Financing available for MH with NEXA Lending. ask agent for details.
-
2020-03-13soldstatus $53,500 470-char remark
Show marketing remark (470 chars)
55+ Manufactured home park, 1,512 sq. ft. of living space with 3 bedrooms, 2 full baths, covered car port, vaulted ceilings w/ ceiling fans & skylights. This 1991 MFG home has newer carpeting, huge master bath with roll in access to shower & grab bars, front entrance ramp, sprinkler system, but not operational, storage sheds & patio area. Central air, property is clean & move-in ready. MFG mortgages on leased land may be available. Contact LA
-
2020-02-03$58,500 470-char remark
Show marketing remark (470 chars)
55+ Manufactured home park, 1,512 sq. ft. of living space with 3 bedrooms, 2 full baths, covered car port, vaulted ceilings w/ ceiling fans & skylights. This 1991 MFG home has newer carpeting, huge master bath with roll in access to shower & grab bars, front entrance ramp, sprinkler system, but not operational, storage sheds & patio area. Central air, property is clean & move-in ready. MFG mortgages on leased land may be available. Contact LA
-
2016-05-04soldstatus $55,000
-
2016-03-04$59,999
ⓘ Source: listings_history table (triggers on properties + properties_extension) + one-shot
backfill from property_details.listing_events for pre-trigger history.
Tax reassessment forecast WA · Resets to sale price
- Current annual tax
- $671 · $56/mo
- Projected year-2 tax
- $784 · $65/mo
- Expected delta
- +$113/yr (+$9/mo · 16.8%)
ⓘ Screening estimate from a state-policy table — verify with the county assessor before closing.
Climate risk First Street
- Flood 1/10 Low FEMA zone X (unshaded) · 0% chance over 30 yrs
- Wildfire 7/10 Severe
- Heat 5/10 Major 7 d/yr ≥98°F today · 14 d/yr by 30 yrs out
- Wind 1/10 Low
- Air quality 9/10 Extreme 16 unhealthy d/yr today · 19 by 30 yrs out
Nearby sold comps map
Loading sold comps map…
Walkable amenities ~0.75 mi
Loading nearby amenities…
Taxation est. · year 1
- Rental income
- $20,810
- − Mortgage interest
- −$4,478
- − Property taxes
- −$671
- − Insurance
- −$400
- − Repairs & maintenance
- −$1,665
- − Management
- −$1,665
- − Depreciation
- −$2,326
- Taxable income
- $9,606
- Est. tax owed @ 24.0%
- −$2,305
- After-tax cash flow
- $8,033/yr
For passive investors: Depreciation is non-cash, so a rental often shows a tax loss while cash-flowing — sheltering income. Rental losses are passive: they offset passive income freely, and up to $25,000/yr can offset ordinary (W-2) income if you actively participate and your MAGI is under $100k (phasing out to $0 by $150k); unused losses carry forward. On sale, claimed depreciation is recaptured at up to 25%, and gains may owe capital-gains tax (a 1031 exchange can defer both). Figures are a year-1 estimate at your 24.0% rate — not tax advice; consult a CPA.
Schools (NCES district)
- District
- Yakima School District
- NCES district ID
- 5310110
- Math proficiency
- 34% ▼ -1.00%
- Reading proficiency
- 42% ▬ 0.00%
- Median HH income
- $36,538
- Composite
- 34.04/100
- National rank
- #10305
- State rank
- #238 of 291 in WA
Livability — Yakima
- Score
- 80/100
- State rank
- #98
- US rank
- #1912
Category grades
Schools grade is shown separately in the Schools card above.
Census & demographics
- Census place
- Yakima, WA
- City population
- 115,918
- Population (ZIP)
- 19,010
Population outlook (Yakima County) Hauer SSP2
- Today (2025)
- 256,514 people
- By 2030
- 259,403 · +1.1%
- By 2040
- 265,677 · +3.6%
- By 2050
- 273,061 · +6.5%
- By 2075
- 296,991 · +15.8%
- By 2100
- 315,291 · +22.9%
Race, ethnicity, and origin ACS 2023
- Neighborhood character
- Diverse neighborhood (Simpson 0.58)
- Race & ethnicity
- White 49% Hispanic / Latino 42% Two or more races 19% Asian 3% Native American 3%
- Hispanic origin (detail)
- Mexican 38%
- Common ancestry
- Italian 3% Portuguese 2% Lithuanian 1%
- Foreign-born
- 15% · Canada, Vietnam
- Languages at home
- 63% English-only · Spanish 33% Other Asian/Pacific 1% Other Indo-European 1%
Political lean MEDSL · Yakima
- 2024 margin
- R (+14.3) · D 41.6% · R 55.9% · Other 2.5%
- 2008→2024 swing
- -3.8pp toward R · 2008: -10.6pp · 2024: -14.3pp
- All cycles
- 2024: R+14.3 2020: R+7.7 2016: R+15.4 2012: R+15.1 2008: R+10.6
Not yet ingested
- Civics
- —
Market trends
- HPI YoY
- ▼ -83.90%
- Current HPI
- 300.5753
- Rent YoY
- —
- Metro
- —
- State GDP YoY
- ▲ 4.65%
- F500 in state
- 22
Industry mix (Fortune 500 HQ in WA)
| Industry | F500 HQs | Revenue |
|---|---|---|
| Retail | 2 | $269B |
|
||
| Technology / Retail | 1 | $638B |
|
||
| Technology | 1 | $245B |
|
||
| Telecommunications | 1 | $38B |
|
||
| Food / Beverage | 1 | $36B |
|
||
| Automotive / Trucks | 1 | $34B |
|
||
Price history
+33.3% since first listed5 events — show timeline
- 2026-02-11 Listed $79,950 YAMLS
- 2020-03-13 Sold (MLS) $53,500 YAMLS
- 2020-02-03 Listed $58,500 YAMLS
- 2016-05-04 Sold (MLS) $55,000 YAMLS
- 2016-03-04 Listed $59,999 YAMLS
Property tax history
+5.5%/yrLatest (2026): $671 · +24.0% YoY. Source: county tax records.
Cash-flow waterfall
monthlySold comps — $/sqft
last 12 mo · ≤1 miLoading sold comps…