701 N Shelton St · Breckenridge, TX
Flood risk 1/10 · Minimal
- FEMA flood zone
- X
- Chance of flooding over 30 yrs
- 0.0%
- Est. flood insurance / yr
- $507 – $1,088
Fire risk 7/10 · Major
- Est. fire insurance / yr
- $1,222 – $2,270
Heat risk 7/10 · Major
- Hot days now (above 107°F)
- 7 days/yr
- Hot days in 30 yrs
- 22 days/yr
Wind risk 4/10 · Minor
- Chance of severe wind over 30 yrs
- 14.0%
Air-quality risk 1/10 · Minimal
- Unhealthy air days now
- 0 days/yr
- Unhealthy air days in 30 yrs
- 0 days/yr
Risk factors via First Street. Map © Google.
Why this score? — see what drove the B- grade
The composite is a weighted blend of 9 inputs, each scored 0–100. Each bar is that input's sub-score; the figure is the points it added to the 100-point composite (weight × sub-score).
- Cash flow +30.0/30.0
- 1% rule +10.0/10.0
- DSCR +10.0/10.0
- Appreciation +5.9/10.0
- Livability +3.2/5.0
- Schools +2.9/10.0
- Rent growth +2.5/5.0
- Condition / age +2.5/5.0
- ARV discount +1.3/15.0
$92,500
🖨 Deal sheet 📄 Offer letter ✓ Due diligence
Listing remarks MLS
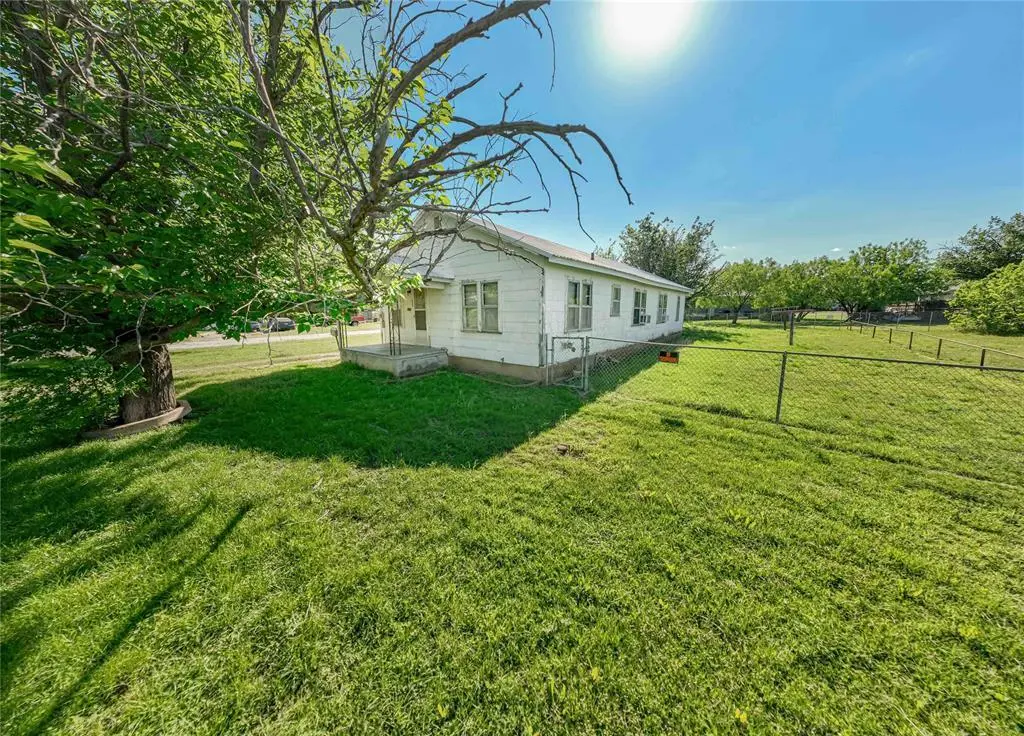
Situated on a spacious corner lot this cozy 3 bedroom, 1 bath property offers great potential for first-time home buyers or anyone looking to add their personal touch. A total of 1,352 sq ft of living space along with a spacious yard makes this property the perfect fit. Step onto the covered front porch, ideal for relaxing mornings or evening unwinding. Inside you will find a comfortable living area, three bedrooms with plenty of natural light and a full bath. The kitchen offers ample space and opportunity for updates to match your style. Outside, the large fenced in yard provides sufficient room for outdoor activities, gardening or future improvements. A chain link fence adds convenience for pets or added security. Whether you are looking for an affordable starter home or your next investment project, this property is full of possibilities. Schedule your showing today!
Key facts
- Covered front porch
- Corner lot
- Large fenced in yard
Tags
Neighborhood map
What this means for you Summary
Snapshot
- This is a 3-bed/1.0-bath single-family listed at $92k.
Deal economics
- At list price, monthly cash flow is $541 ($6k/yr) — positive.
- The deal already cash-flows at list — no discount required.
- Meets the 1% rule at list price ($1k rent vs $92k).
- Recommended offer: $87k (6.0% below list) — sets the bar for market timing.
- Cap rate 13.3% vs local median 3.6% in Breckenridge — top-decile yield for the area; either an underpriced asset or a hidden risk that comps aren't pricing in. Stress-test before assuming the spread holds.
Location & tenants
- Location reads 65/100 on livability (#695 in TX) — a middle-class / working-renter tenant base. Strengths: cost of living A+, housing A+, health & safety A+; Watch: crime D, schools D-, amenities F.
- Breckenridge ISD (town): math 36% / reading 32% proficiency, ranked #551 of 826 in TX (top 67%) — families likely to look elsewhere, expect single-tenant / working-renter base with shorter leases.
- Market conditions: 118 active listings in the ZIP; 3 comparable units currently listed for rent nearby; rentals leasing fast (median 13d on market — plan ~1-2 weeks tenant-placement turnaround); 2 units permitted in Stephens County in 2024 (0 in 5+ unit buildings).
Forward outlook
- In year one you build about $2k of equity ($640 loan paydown + $2k appreciation (1.8% local appreciation)).
- Stephens County population projected at +19% by 2050 — long-run rental-demand tailwind backs the buy-and-hold thesis.
- At projected returns (1.8% appreciation + 3.0% rent growth), your $26k cash investment doubles in ~3 years — after that, you're playing with house money.
Negotiation context
- It's been on market 66 days — a 6% lower offer ($87k) is reasonable based on typical stale-listing flexibility.
Risks & watch-outs
- Climate carrying-cost: major wildfire risk; extreme-heat days projected 7→22/yr by 2055 (HVAC capex compounding) — expect insurance premiums to compound above CPI over the hold.
Questions for the listing agent
- It's been on market 66 days. Have you received any prior offers? Is the seller open to a 6% concession, seller financing, or rate buy-down credit?
- Why hasn't it sold? Are there any deal-killer items the seller is aware of (foundation, flood, title, zoning, code violations)?
- Is there a deadline driving the sale (1031 exchange, divorce, estate, relocation)? That informs how much negotiation room exists.
- Schools are D-rated, which usually means shorter tenancies and higher turnover. Who's the typical renter profile here, and what's been the actual vacancy rate?
- Crime grade is D in this area — have there been break-ins, vandalism, or insurance claims at this property in the last 3 years? What carrier currently insures it and at what premium?
- What's the average days-on-market for RENTAL listings here right now (not sales)? A rising rental-DOM trend means longer vacancies and softer asking-rent achievability than the comps imply.
- What's the recent tenant-quality profile in this submarket — average credit score on applications, eviction rate, late-payment / NSF rate, and stable-employment percentage? A property-management company in the area should have these aggregated.
- How much new for-sale + rental construction is in the pipeline within 1–3 miles? Heavy new supply typically softens prices + rents 12–24 months out; constrained supply supports both.
Investment metrics
- 1% rule
- 1.59% ✓
- Cap rate
- 13.31%
- Cash-on-cash
- 25.05%
- DSCR
- 2.11
- GRM
- 5.2
CMA / ARV
- ARV (median comp)
- $81,299
- List price
- $92,500
- Delta
- 13.78%
- Verdict
- OVERPRICED
- Comps
- 20 within 1.0 mi
Show comp detail 3 sales within ~0.75 mi
| Address | Dist | Beds/Ba | Sqft | Sold | Price | $/sf | Match |
|---|---|---|---|---|---|---|---|
| 1308 W Dyer St | 0.46mi | 3/2.0 | 1,226 (-9%) | 2mo | $169,000 | $138 | 58 |
| 505 N Baylor Ave | 0.70mi | 3/2.0 | 1,200 (-11%) | 4mo | $54,945 | $46 | 41 |
| 1201 W Dyer St | 0.38mi | 3/2.0 | 1,550 (+15%) | 23mo | $179,000 | $115 | 34 |
Match score weights: distance 35% · size 25% · config 20% · recency 20%. Top-matched comps best support the ARV.
Projected returns pro-forma
1.8% appreciation · 3.0% rent growth · sell at horizon
- IRR
- 28.8%
- Equity multiple
- 2.54×
- Total profit
- $39,861
- Equity at exit
- $35,497
- IRR
- 30.5%
- Equity multiple
- 4.91×
- Total profit
- $101,162
- Equity at exit
- $50,368
Cash invested: $25,900 (down + closing). Projections, not guarantees.
Landlord ↔ Tenant lean methodology
- Overall (STATE)
- 87 Strongly Landlord-Friendly
- State Texas
- 87 Strongly Landlord-Friendly · R+5
- County
- — inherits STATE
- City
- — inherits STATE
ZIP-level market 76424
- Home prices YoY
- 1.6%
- Active inventory
- 118
- Price-to-rent
- 5.2×
Monthly cashflow live
- Estimated rent
- $1,472 medium interval (Pro) →
- Mortgage (P&I)
- −$485
- Tax from tax record
- −$99 /mo · $1,183/yr
- Insurance
- −$39
- HOA
- −$0
- Vacancy / Maint / Mgmt
- −$309
- Net cashflow
- $541
Break-even live
UW: 25.0% down · 7.5% · 30yr · 1.5% tax · 5.0% vac · 8.0% maint · 8.0% mgmt
Financing live
Cash to close
- Down payment
- $23,125
- Closing costs
- $2,775
- Reserves months
- —
- Total cash needed
- —
Loan-product check · same deal, 3 products live
Conventional
25% down · 7.5% · 30yr
- Down + closing
- —
- Monthly P&I
- —
- Monthly cashflow
- —
- DSCR
- —
- Eligible?
- —
Personal DTI + credit; lowest rate.
DSCR
20% down · 8.5% · 30yr
- Down + closing
- —
- Monthly P&I
- —
- Monthly cashflow
- —
- DSCR
- —
- Eligible?
- —
No personal income docs; deal must DSCR.
Hard money
10% down · 12.0% · 12mo
- Down + closing
- —
- Monthly P&I
- —
- Monthly cashflow
- —
- DSCR
- —
- Eligible?
- —
Short-term bridge; refi at stabilization.
Rent comps 3 comps
| Address | Beds | Baths | Sqft | Rent | $/sqft | DOM | Units | Dist |
|---|---|---|---|---|---|---|---|---|
| 901 N Parks St Breckenridge, TX | 4.0 | 1.5 | 1810 | $1,500 | $0.83 | 21d | 1 | 0.16mi |
| 901 N Parks St Breckenridge, TX | 4.0 | 1.5 | 1810 | $1,500 | $0.83 | 13d | 1 | 0.16mi |
| 1800 W Elliott St Breckenridge, TX | 2.0 | 1.0–2.0 | 806 | $988 | $1.22 | 13d | 1 | 1.08mi |
Listing history 15 events
-
2026-06-18days on market $92,500 Active 66 DOM
-
2026-06-17days on market $92,500 Active 65 DOM
-
2026-06-16days on market $92,500 Active 64 DOM
-
2026-06-15days on market $92,500 Active 63 DOM
-
2026-06-13days on market $92,500 Active 61 DOM
-
2026-06-12days on market $92,500 Active 60 DOM
-
2026-06-09days on market $92,500 Active 57 DOM
-
2026-06-08days on market $92,500 Active 56 DOM
-
2026-06-08days on market $92,500 Active 55 DOM
-
2026-06-05days on market $92,500 Active 53 DOM
-
2026-06-03days on market $92,500 Active 51 DOM
-
2026-06-02days on market $92,500 Active 50 DOM
-
2026-06-01days on market $92,500 Active 49 DOM
-
2026-05-31days on market $92,500 Active 48 DOM
-
2026-04-13$99,500 Active 883-char remark
Show marketing remark (883 chars)
Situated on a spacious corner lot this cozy 3 bedroom, 1 bath property offers great potential for first-time home buyers or anyone looking to add their personal touch. A total of 1,352 sq ft of living space along with a spacious yard makes this property the perfect fit. Step onto the covered front porch, ideal for relaxing mornings or evening unwinding. Inside you will find a comfortable living area, three bedrooms with plenty of natural light and a full bath. The kitchen offers ample space and opportunity for updates to match your style. Outside, the large fenced in yard provides sufficient room for outdoor activities, gardening or future improvements. A chain link fence adds convenience for pets or added security. Whether you are looking for an affordable starter home or your next investment project, this property is full of possibilities. Schedule your showing today!
ⓘ Source: listings_history table (triggers on properties + properties_extension) + one-shot
backfill from property_details.listing_events for pre-trigger history.
Tax reassessment forecast TX · Resets to sale price
- Current annual tax
- $1,183 · $99/mo
- Projected year-2 tax
- $1,693 · $141/mo
- Expected delta
- +$510/yr (+$42/mo · 43.1%)
ⓘ Screening estimate from a state-policy table — verify with the county assessor before closing.
Climate risk First Street
- Flood 1/10 Low FEMA zone X · 0% chance over 30 yrs
- Wildfire 7/10 Severe
- Heat 7/10 Severe 7 d/yr ≥107°F today · 22 d/yr by 30 yrs out
- Wind 4/10 Moderate 14% chance of damaging wind over 30 yrs
- Air quality 1/10 Low 0 unhealthy d/yr today · 0 by 30 yrs out
Nearby sold comps map
Loading sold comps map…
Walkable amenities ~0.75 mi
Loading nearby amenities…
Taxation est. · year 1
- Rental income
- $17,664
- − Mortgage interest
- −$5,181
- − Property taxes
- −$1,183
- − Insurance
- −$462
- − Repairs & maintenance
- −$1,413
- − Management
- −$1,413
- − Depreciation
- −$2,691
- Taxable income
- $5,320
- Est. tax owed @ 24.0%
- −$1,277
- After-tax cash flow
- $5,211/yr
For passive investors: Depreciation is non-cash, so a rental often shows a tax loss while cash-flowing — sheltering income. Rental losses are passive: they offset passive income freely, and up to $25,000/yr can offset ordinary (W-2) income if you actively participate and your MAGI is under $100k (phasing out to $0 by $150k); unused losses carry forward. On sale, claimed depreciation is recaptured at up to 25%, and gains may owe capital-gains tax (a 1031 exchange can defer both). Figures are a year-1 estimate at your 24.0% rate — not tax advice; consult a CPA.
Schools (NCES district)
- District
- Breckenridge ISD
- NCES district ID
- 4811220
- Math proficiency
- 36% ▬ 0.00%
- Reading proficiency
- 32% ▼ -4.00%
- Median HH income
- $40,744
- Composite
- 28.66/100
- National rank
- #6700
- State rank
- #551 of 826 in TX
Livability — Breckenridge
- Score
- 65/100
- State rank
- #695
- US rank
- #12987
Category grades
Schools grade is shown separately in the Schools card above.
Census & demographics
- Census place
- Breckenridge, TX
- Population (ZIP)
- 8,626
Population outlook (Stephens County) Hauer SSP2
- Today (2025)
- 10,625 people
- By 2030
- 11,029 · +3.8%
- By 2040
- 11,827 · +11.3%
- By 2050
- 12,609 · +18.7%
- By 2075
- 13,855 · +30.4%
- By 2100
- 13,067 · +23.0%
Race, ethnicity, and origin ACS 2023
- Neighborhood character
- Predominantly White (67%)
- Race & ethnicity
- White 67% Hispanic / Latino 27% Two or more races 12% Black 3% Asian 1%
- Hispanic origin (detail)
- Mexican 25%
- Common ancestry
- Lithuanian 2% Slovak 2% Italian 1%
- Foreign-born
- 8% · Canada
- Languages at home
- 82% English-only · Spanish 17%
Political lean MEDSL · Stephens
- 2024 margin
- Solid R (+79.3) · D 10.2% · R 89.5%
- 2008→2024 swing
- -15.7pp toward R · 2008: -63.6pp · 2024: -79.3pp
- All cycles
- 2024: R+79.3 2020: R+78.6 2016: R+77.8 2012: R+70.9 2008: R+63.6
Not yet ingested
- Civics
- —
Market trends
- HPI YoY
- ▲ 1.80%
- Current HPI
- 110.8496
- Rent YoY
- —
- Metro
- —
- State GDP YoY
- ▲ 3.95%
- F500 in state
- 110
Industry mix (Fortune 500 HQ in TX)
| Industry | F500 HQs | Revenue |
|---|---|---|
| Energy | 16 | $1,198B |
|
||
| Technology | 5 | $198B |
|
||
| Engineering / Construction | 4 | $72B |
|
||
| Energy Services | 3 | $60B |
|
||
| Utilities | 3 | $41B |
|
||
| Healthcare | 2 | $330B |
|
||
Price history
1 event — show timeline
- 2026-04-13 Listed $99,500 NTREIS
Property tax history
+1.3%/yrLatest (2025): $1,183 · +9.0% YoY. Source: county tax records.
Cash-flow waterfall
monthlySold comps — $/sqft
last 12 mo · ≤1 miLoading sold comps…