309 N South Carolina Ave · Atlantic City, NJ
Flood risk No data
- FEMA flood zone
- —
- Chance of flooding over 30 yrs
- —
- Est. flood insurance / yr
- —
Fire risk No data
- Est. fire insurance / yr
- —
Heat risk No data
- Hot days now (above threshold)
- —
- Hot days in 30 yrs
- —
Wind risk No data
- Chance of severe wind over 30 yrs
- —
Air-quality risk No data
- Unhealthy air days now
- —
- Unhealthy air days in 30 yrs
- —
Risk factors via First Street. Map © Google.
Why this score? — see what drove the B grade
The composite is a weighted blend of 9 inputs, each scored 0–100. Each bar is that input's sub-score; the figure is the points it added to the 100-point composite (weight × sub-score).
- Cash flow +30.0/30.0
- 1% rule +10.0/10.0
- DSCR +10.0/10.0
- ARV discount +7.5/15.0
- Condition / age +5.0/5.0
- Rent growth +3.9/5.0
- Livability +2.8/5.0
- Schools +1.4/10.0
- Appreciation +0.0/10.0
$83,000
🖨 Deal sheet 📄 Offer letter ✓ Due diligence
Listing remarks
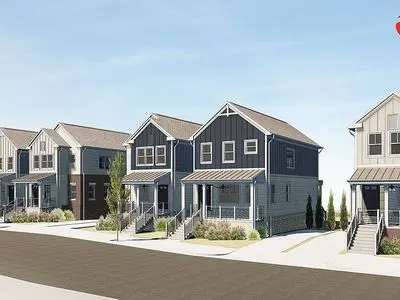
Single Family 2-story new construction home in Atlantic City. Two off-street parking spaces provided. For more information reach out to sales@foyagroup. us or check out our website at foyadevelopment. us for an application. Lottery to take place on July 13,2026.
Key facts
- Built 2026
- Listed 29 days
Tags
Neighborhood map
What this means for you Summary
Snapshot
- This is a 3-bed/3.0-bath other listed at $83k. Condition is rated excellent.
Deal economics
- At list price, monthly cash flow is $1k ($15k/yr) — positive.
- The deal already cash-flows at list — no discount required.
- Meets the 1% rule at list price ($2k rent vs $83k).
- Recommended offer: $82k (1.5% below list) — sets the bar for market timing.
- Cap rate 24.2% vs local median 3.7% in Atlantic City — top-decile yield for the area; either an underpriced asset or a hidden risk that comps aren't pricing in. Stress-test before assuming the spread holds.
Location & tenants
- Location reads 55/100 on livability (#525 in NJ) — a working-class tenant base; expect higher turnover. Strengths: health & safety A; Watch: commute D, schools F, crime F.
- Atlantic City School District (urban): math 9% / reading 26% proficiency, ranked #454 of 472 in NJ (top 96%) — low school quality limits family demand, transient renter base, plan for 1-2y turnover; 85% free/reduced lunch — lower-income household profile, screen leases tightly.
- Market conditions: Rents rising fast (+5.5%/yr); 482 active listings in the ZIP; 17 comparable units currently listed for rent nearby; rentals at typical pace (median 21d on market — plan ~3-4 weeks tenant-placement turnaround); lower-income renter base — watch delinquency; 672 units permitted in Atlantic County in 2024 (258 in 5+ unit buildings).
- At $2,295/mo this rent would consume 67% of the median local household income ($41k/yr) (locally 3414% of renters already pay >50% of income on rent) — very limited rent-growth headroom before tenants either downsize or default.
Forward outlook
- Local home prices are declining (-3.0%/yr); year-one equity from $574 of loan paydown is wiped out by about $2k of value loss. Plan a longer hold.
- Atlantic County population projected at -12% by 2050 — secular population decline; favor cash flow + early exit over multi-decade hold.
- At projected returns (-3.0% appreciation + 5.5% rent growth), your $23k cash investment doubles in ~2 years — after that, you're playing with house money.
Negotiation context
- It's been on market 30 days — a 2% lower offer ($82k) is reasonable based on typical stale-listing flexibility.
Questions for the listing agent
- Is there a deadline driving the sale (1031 exchange, divorce, estate, relocation)? That informs how much negotiation room exists.
- Schools are F-rated, which usually means shorter tenancies and higher turnover. Who's the typical renter profile here, and what's been the actual vacancy rate?
- Crime grade is F in this area — have there been break-ins, vandalism, or insurance claims at this property in the last 3 years? What carrier currently insures it and at what premium?
- What's the average days-on-market for RENTAL listings here right now (not sales)? A rising rental-DOM trend means longer vacancies and softer asking-rent achievability than the comps imply.
- What's the recent tenant-quality profile in this submarket — average credit score on applications, eviction rate, late-payment / NSF rate, and stable-employment percentage? A property-management company in the area should have these aggregated.
- How much new for-sale + rental construction is in the pipeline within 1–3 miles? Heavy new supply typically softens prices + rents 12–24 months out; constrained supply supports both.
Investment metrics
- 1% rule
- 2.77% ✓
- Cap rate
- 24.22%
- Cash-on-cash
- 64.01%
- DSCR
- 3.85
- GRM
- 3.0
CMA / ARV
No comps found within radius.
Projected returns pro-forma
-3.0% appreciation · 5.52% rent growth · sell at horizon
- IRR
- 65.9%
- Equity multiple
- 4.08×
- Total profit
- $71,503
- Equity at exit
- $12,376
- IRR
- 71.0%
- Equity multiple
- 9.17×
- Total profit
- $189,847
- Equity at exit
- $7,176
Cash invested: $23,240 (down + closing). Projections, not guarantees.
Landlord ↔ Tenant lean methodology
- Overall (STATE)
- 21 Tenant-Leaning
- State New Jersey
- 21 Tenant-Leaning · D+6
- County
- — inherits STATE
- City
- — inherits STATE
ZIP-level market 08401
- Home prices YoY
- -7.0%
- Rents YoY
- 5.5%
- Active inventory
- 482
- Price-to-rent
- 3.0×
Monthly cashflow live
- Estimated rent
- $2,295 high interval (Pro) →
- Mortgage (P&I)
- −$435
- Tax est. 1.5%
- −$104 /mo · $1,245/yr
- Insurance
- −$35
- HOA
- −$0
- Vacancy / Maint / Mgmt
- −$482
- Net cashflow
- $1,240
Break-even live
UW: 25.0% down · 7.5% · 30yr · 1.5% tax · 5.0% vac · 8.0% maint · 8.0% mgmt
Financing live
Cash to close
- Down payment
- $20,750
- Closing costs
- $2,490
- Reserves months
- —
- Total cash needed
- —
Loan-product check · same deal, 3 products live
Conventional
25% down · 7.5% · 30yr
- Down + closing
- —
- Monthly P&I
- —
- Monthly cashflow
- —
- DSCR
- —
- Eligible?
- —
Personal DTI + credit; lowest rate.
DSCR
20% down · 8.5% · 30yr
- Down + closing
- —
- Monthly P&I
- —
- Monthly cashflow
- —
- DSCR
- —
- Eligible?
- —
No personal income docs; deal must DSCR.
Hard money
10% down · 12.0% · 12mo
- Down + closing
- —
- Monthly P&I
- —
- Monthly cashflow
- —
- DSCR
- —
- Eligible?
- —
Short-term bridge; refi at stabilization.
Rent comps 17 comps
| Address | Beds | Baths | Sqft | Rent | $/sqft | DOM | Units | Dist |
|---|---|---|---|---|---|---|---|---|
| 326 N Tennessee Ave Unit 2 Atlantic City, NJ | 3.0 | 1.0 | 1815 | $2,200 | $1.21 | 13d | 1 | 0.09mi |
| 31 N Virginia Ave Atlantic City, NJ | 3.0 | 1.0 | 725 | $2,230 | $3.08 | 13d | 1 | 0.37mi |
| 1724 Atlantic Ave Unit A1 Atlantic City, NJ | 3.0 | 1.0 | 950 | $2,300 | $2.42 | 21d | 1 | 0.50mi |
| 1916 Magellan Ave Atlantic City, NJ | 2.0 | 1.0 | 1478 | $1,850 | $1.25 | 21d | 1 | 0.54mi |
| 848 Pacific Ave Unit 1014254P Atlantic City, NJ | 1.0–2.0 | 2.0–3.0 | 1243 | $2,413 | $1.94 | 13d | 2 | 0.61mi |
| 905 Keener Ave Atlantic City, NJ | 3.0 | 1.0 | 1059 | $1,900 | $1.79 | 21d | 1 | 0.64mi |
| 2015 Grant Ave Atlantic City, NJ | 3.0 | 1.0 | 1056 | $2,325 | $2.20 | 21d | 1 | 0.64mi |
| 2021 Grant Ave Atlantic City, NJ | 3.0 | 1.0 | 1011 | $2,350 | $2.32 | 21d | 1 | 0.65mi |
| 526 Pacific Ave Atlantic City, NJ | 2.0 | 2.0 | 1170 | $2,400 | $2.05 | 21d | 4 | 0.74mi |
| 4 Italy Ter Atlantic City, NJ | 3.0 | 1.0 | 1000 | $2,300 | $2.30 | 21d | 1 | 0.79mi |
| 10 Starboard Ct #10 Atlantic City, NJ | 3.0 | 2.5 | 1680 | $2,400 | $1.43 | 13d | 1 | 0.82mi |
| 351 N New Hampshire Ave Atlantic City, NJ | 2.0 | 2.0 | 972 | $1,948 | $2.00 | 13d | 3 | 0.90mi |
| 122 Dewey Pl Atlantic City, NJ | 3.0 | 1.0 | 1250 | $2,700 | $2.16 | 21d | 1 | 1.02mi |
| 1510 N Arkansas Ave Atlantic City, NJ | 3.0 | 2.0 | 1008 | $2,750 | $2.73 | 13d | 1 | 1.05mi |
| 1523 N Arkansas Ave Atlantic City, NJ | 3.0 | 2.0 | 984 | $2,500 | $2.54 | 21d | 1 | 1.09mi |
| 1532 Emerson Pl Fl Front Atlantic City, NJ | 3.0 | 2.0 | 1200 | $2,400 | $2.00 | 13d | 1 | 1.11mi |
| 100 N Chelsea Ave Unit 1 Atlantic City, NJ | 3.0 | 1.0 | 1200 | $15,000 | $12.50 | 21d | 1 | 1.35mi |
Listing history 16 events
-
2026-06-19days on market $83,000 Active 30 DOM
-
2026-06-18days on market $83,000 Active 29 DOM
-
2026-06-17days on market $83,000 Active 28 DOM
-
2026-06-16days on market $83,000 Active 27 DOM
-
2026-06-15days on market $83,000 Active 26 DOM
-
2026-06-14days on market $83,000 Active 24 DOM
-
2026-06-13days on market $83,000 Active 23 DOM
-
2026-06-10days on market $83,000 Active 21 DOM
-
2026-06-09days on market $83,000 Active 20 DOM
-
2026-06-08days on market $83,000 Active 19 DOM
-
2026-06-07days on market $83,000 Active 18 DOM
-
2026-06-02days on market $83,000 Active 13 DOM
-
2026-06-01days on market $83,000 Active 12 DOM
-
2026-05-31days on market $83,000 Active 11 DOM
-
2026-05-30days on market $83,000 Active 10 DOM
-
2026-05-21$83,000 Active
ⓘ Source: listings_history table (triggers on properties + properties_extension) + one-shot
backfill from property_details.listing_events for pre-trigger history.
Nearby sold comps map
Loading sold comps map…
Walkable amenities ~0.75 mi
Loading nearby amenities…
Taxation est. · year 1
- Rental income
- $27,543
- − Mortgage interest
- −$4,649
- − Property taxes
- −$1,245
- − Insurance
- −$415
- − Repairs & maintenance
- −$2,203
- − Management
- −$2,203
- − Depreciation
- −$2,415
- Taxable income
- $14,412
- Est. tax owed @ 24.0%
- −$3,459
- After-tax cash flow
- $11,417/yr
For passive investors: Depreciation is non-cash, so a rental often shows a tax loss while cash-flowing — sheltering income. Rental losses are passive: they offset passive income freely, and up to $25,000/yr can offset ordinary (W-2) income if you actively participate and your MAGI is under $100k (phasing out to $0 by $150k); unused losses carry forward. On sale, claimed depreciation is recaptured at up to 25%, and gains may owe capital-gains tax (a 1031 exchange can defer both). Figures are a year-1 estimate at your 24.0% rate — not tax advice; consult a CPA.
Condition & rehab AI · 1 photo
This single-family, 2-story new construction home in Atlantic City is move-in ready with no visible signs of wear or damage. It offers a pristine condition and is ideal for both resale and rental markets.
Schools (NCES district)
- District
- Atlantic City School District
- NCES district ID
- 3400960
- Math proficiency
- 9% ▼ -12.00%
- Reading proficiency
- 26% ▼ -6.00%
- Median HH income
- $27,842
- Composite
- 13.66/100
- National rank
- #9504
- State rank
- #454 of 472 in NJ
Livability — Atlantic City
- Score
- 55/100
- State rank
- #525
- US rank
- #23095
Category grades
Schools grade is shown separately in the Schools card above.
Census & demographics
- Census place
- Atlantic City, NJ
- County
- Atlantic County · 143,611 people
- City population
- 38,925
- Metro
- Atlantic City-Hammonton, NJ
- Population (ZIP)
- 38,925
- Household income
- $41,126
- Rent vs Own
- Severe rent burden
- 3414.0
Population outlook (Atlantic County) Hauer SSP2
- Today (2025)
- 268,948 people
- By 2030
- 264,497 · -1.7%
- By 2040
- 252,261 · -6.2%
- By 2050
- 237,846 · -11.6%
- By 2075
- 210,650 · -21.7%
- By 2100
- 180,234 · -33.0%
Race, ethnicity, and origin ACS 2023
- Neighborhood character
- Highly diverse neighborhood (Simpson 0.75)
- Race & ethnicity
- Hispanic / Latino 32% Black 32% Asian 16% White 16% Two or more races 11% Native American 2%
- Hispanic origin (detail)
- Mexican 10% Puerto Rican 8% Dominican 8%
- Common ancestry
- Romanian 1% Scotch-Irish 1%
- Foreign-born
- 29% · Canada, Vietnam, Jamaica
- Languages at home
- 52% English-only · Spanish 30% Other Indo-European 8% Vietnamese 3%
Political lean MEDSL · Atlantic
- 2024 margin
- Toss-up / Even · D 47.7% · R 50.7% · Other 1.6%
- 2008→2024 swing
- -18.1pp toward R · 2008: 15.1pp · 2024: -3.0pp
- All cycles
- 2024: R+3.0 2020: D+6.7 2016: D+6.2 2012: D+17.2 2008: D+15.1
Not yet ingested
- Civics
- —
Market trends
- HPI YoY
- ▼ -26.82%
- Current HPI
- 353.7827
- Rent YoY
- ▲ 5.52%
- Metro
- Atlantic City-Hammonton, NJ
- State GDP YoY
- ▲ 2.05%
- F500 in state
- 34
Industry mix (Fortune 500 HQ in NJ)
| Industry | F500 HQs | Revenue |
|---|---|---|
| Consumer Goods | 3 | $31B |
|
||
| Pharmaceuticals | 2 | $153B |
|
||
| Technology | 2 | $21B |
|
||
| Insurance | 2 | $20B |
|
||
| Healthcare | 2 | $19B |
|
||
| Financial Services | 1 | $70B |
|
||
Price history
1 event — show timeline
- 2026-05-21 Listed $83,000 FSBO.com
Cash-flow waterfall
monthlySold comps — $/sqft
last 12 mo · ≤1 miLoading sold comps…