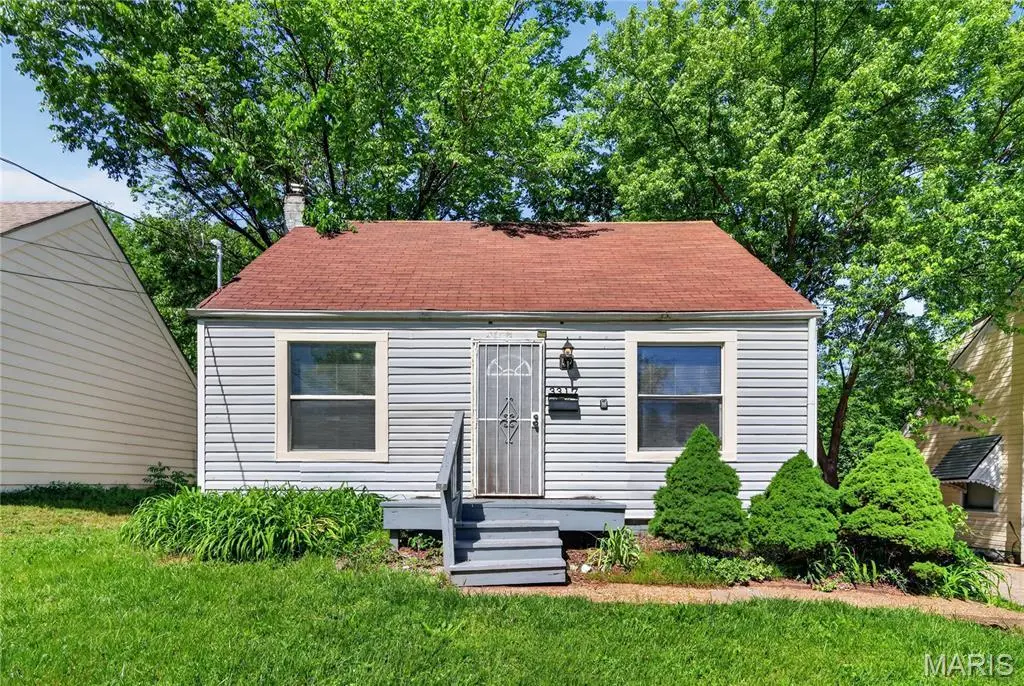
3317 Rex Ave · Breckenridge Hills, MO
Flood risk 1/10 · Minimal
- FEMA flood zone
- X (unshaded)
- Chance of flooding over 30 yrs
- 0.0%
- Est. flood insurance / yr
- $473 – $860
Fire risk 1/10 · Minimal
- Est. fire insurance / yr
- $1,054 – $1,958
Heat risk 4/10 · Minor
- Hot days now (above 106°F)
- 7 days/yr
- Hot days in 30 yrs
- 21 days/yr
Wind risk 2/10 · Minimal
- Chance of severe wind over 30 yrs
- 1.0%
Air-quality risk 2/10 · Minimal
- Unhealthy air days now
- 1 days/yr
- Unhealthy air days in 30 yrs
- 3 days/yr
Risk factors via First Street. Map © Google.
Why this score? — see what drove the B grade
The composite is a weighted blend of 9 inputs, each scored 0–100. Each bar is that input's sub-score; the figure is the points it added to the 100-point composite (weight × sub-score).
- Cash flow +30.0/30.0
- ARV discount +11.9/15.0
- DSCR +10.0/10.0
- 1% rule +9.2/10.0
- Livability +3.4/5.0
- Rent growth +3.0/5.0
- Condition / age +2.5/5.0
- Schools +1.7/10.0
- Appreciation +0.0/10.0
$94,900
🖨 Deal sheet (PDF) 📄 Offer letter ✓ Due diligence
Listing remarks
Charming single-story ranch located in a quiet residential pocket of St. Louis County. This well-maintained home offers comfortable one-level living with a practical layout and timeless appeal. Inside, you’ll find a functional floor plan featuring hardwood flooring and a bright living area that flows into the kitchen, which comes equipped with essential appliances. The home includes a full basement, providing excellent storage space or potential for future finishing. Constructed with a combination of brick and frame, the exterior offers durability and low maintenance. The property sits on a level lot with a spacious yard, ideal for outdoor enjoyment or future improvements. Convenientl
Key facts
- Hardwood flooring
- Bright living area
- Single-story ranch
Tags
Property features AI
Finance
- Other: Lot approximately 0.15 acres; Above-grade finished area recorded as 874 (source: public records)
- Financial info: Lease not considered; No second mortgage reported
- HOA & community: No HOA details provided
Exterior
- Parking: Off-street parking
- Security: No security details provided
- Utilities: Public water; Public sewer; Electric service: Other
- Home design: Single-family residence; House with one level; Residential property
- Construction: Brick and frame construction
- Exterior features: Gentle sloping to level lot; Paved road access
Interior
- Kitchen: No kitchen appliance details provided
- Bedrooms: 2 bedrooms (both on the main level)
- Flooring: No flooring details provided
- Bathrooms: 1 full bathroom (main level)
- Heating & cooling: Other heating; Central air conditioning
- Interior features: Gas water heater; Full basement
- Laundry & utility: No laundry or utility appliance details provided
Neighborhood map
What this means for you Summary
Snapshot
- This is a 3-bed/1.0-bath single-family listed at $95k.
Deal economics
- At list price, monthly cash flow is $444 ($5k/yr) — positive.
- The deal already cash-flows at list — no discount required.
- Meets the 1% rule at list price ($1k rent vs $95k).
- Recommended offer: $92k (3.0% below list) — sets the bar for market timing.
Location & tenants
- Location reads 68/100 on livability (#193 in MO) — a middle-class / working-renter tenant base. Strengths: cost of living A+, housing A+; Watch: crime C-, employment D+, amenities F.
- Ritenour (suburban): math 13% / reading 27% proficiency, ranked #304 of 324 in MO (top 94%) — low school quality limits family demand, transient renter base, plan for 1-2y turnover; 66% free/reduced lunch — lower-income household profile, screen leases tightly.
- Zoned schools: Marion Elem. (math 18% / reading 30%, grade F, #907 of 1,115 statewide, top 81%, 475 students, 99% FRL); Ritenour Middle (math 15% / reading 28%, grade F, #339 of 391 statewide, top 87%, 467 students, 99% FRL); Ritenour Sr. High (math 9% / reading 36%, grade F, #455 of 521 statewide, top 88%, 1,873 students, 100% FRL) — zoned schools average 100% FRL vs 66% district-wide (34 pts higher); higher-poverty schools than district average — tighter screening recommended.
- Market conditions: Rents rising (+2.0%/yr); 120 active listings in the ZIP; 33 comparable units currently listed for rent nearby; rentals at typical pace (median 26d on market — plan ~3-4 weeks tenant-placement turnaround); 45% of comp listings sitting > 30 days — soft ceiling on asking rent; 920 units permitted in St. Louis County in 2024 (250 in 5+ unit buildings).
Forward outlook
- Local home prices are declining (-3.0%/yr); year-one equity from $656 of loan paydown is wiped out by about $3k of value loss. Plan a longer hold.
- At projected returns (-3.0% appreciation + 2.0% rent growth), your $27k cash investment doubles in ~7 years — after that, you're playing with house money.
Negotiation context
- It's been on market 52 days — a 3% lower offer ($92k) is reasonable based on typical stale-listing flexibility.
- Current owner paid $24k; list at $95k implies a 303% gain — meaningful room to come down on a strong offer.
Risks & watch-outs
- Watch-outs: built in 1942 — expect roof / HVAC / electrical / plumbing capex.
Questions for the listing agent
- It's been on market 52 days. Have you received any prior offers? Is the seller open to a 3% concession, seller financing, or rate buy-down credit?
- Built in 1942 — when were the roof, HVAC, electrical panel, plumbing, and water heater last replaced?
- Is there a deadline driving the sale (1031 exchange, divorce, estate, relocation)? That informs how much negotiation room exists.
- Schools are F-rated, which usually means shorter tenancies and higher turnover. Who's the typical renter profile here, and what's been the actual vacancy rate?
- What's the average days-on-market for RENTAL listings here right now (not sales)? A rising rental-DOM trend means longer vacancies and softer asking-rent achievability than the comps imply.
- What's the recent tenant-quality profile in this submarket — average credit score on applications, eviction rate, late-payment / NSF rate, and stable-employment percentage? A property-management company in the area should have these aggregated.
- How much new for-sale + rental construction is in the pipeline within 1–3 miles? Heavy new supply typically softens prices + rents 12–24 months out; constrained supply supports both.
Investment metrics
- 1% rule
- 1.42% ✓
- Cap rate
- 11.91%
- Cash-on-cash
- 20.07%
- DSCR
- 1.89
- GRM
- 5.9
CMA / ARV
- ARV (median comp)
- $105,118
- List price
- $94,900
- Delta
- -9.72%
- Verdict
- FAIR
- Comps
- 20 within 1.0 mi
Show comp detail 12 sales within ~0.75 mi
| Address | Dist | Beds/Ba | Sqft | Sold | Price | $/sf | Match |
|---|---|---|---|---|---|---|---|
| 3368 Suncrest Ave | 0.31mi | 4/2.0 (+1) | 864 (-1%) | 3mo | $164,900 | $191 | 72 |
| 25 Jonell Ct | 0.50mi | 2/1.0 (-1) | 864 (-1%) | 2mo | $155,000 | $179 | 68 |
| 3219 Royalton Ave | 0.26mi | 2/1.0 (-1) | 792 (-9%) | 3mo | $102,500 | $129 | 65 |
| 3507 Westridge Ln | 0.72mi | 3/1.0 | 864 (-1%) | 1mo | $165,000 | $191 | 64 |
| 9429 Burdella Ave | 0.37mi | 2/1.0 (-1) | 939 (+7%) | 4mo | $125,000 | $133 | 62 |
| 9448 Harold Dr | 0.65mi | 2/1.0 (-1) | 864 (-1%) | 2mo | $120,000 | $139 | 61 |
| 9844 Mecca Ln | 0.42mi | 2/1.0 (-1) | 936 (+7%) | 5mo | $100,000 | $107 | 60 |
| 3525 Wismer Rd | 0.51mi | 2/1.0 (-1) | 816 (-7%) | 5mo | $148,500 | $182 | 56 |
| 3304 S Gordon Ct | 0.50mi | 2/1.0 (-1) | 980 (+12%) | 2mo | $125,000 | $128 | 50 |
| 3654 Boswell Ave | 0.69mi | 2/1.0 (-1) | 825 (-6%) | 5mo | $95,000 | $115 | 49 |
| 3203 Chaucer Ave | 0.64mi | 2/1.5 (-1) | 986 (+13%) | 0mo | $144,900 | $147 | 41 |
| 3926 Edmundson Rd | 0.73mi | 2/1.0 (-1) | 768 (-12%) | 4mo | $59,900 | $78 | 38 |
Match score weights: distance 35% · size 25% · config 20% · recency 20%. Top-matched comps best support the ARV.
Projected returns pro-forma
-3.0% appreciation · 2.04% rent growth · sell at horizon
- IRR
- 11.2%
- Equity multiple
- 1.44×
- Total profit
- $11,631
- Equity at exit
- $14,150
- IRR
- 19.4%
- Equity multiple
- 2.56×
- Total profit
- $41,370
- Equity at exit
- $8,205
Cash invested: $26,572 (down + closing). Projections, not guarantees.
Landlord ↔ Tenant lean methodology
- Overall (STATE)
- 81 Strongly Landlord-Friendly
- State Missouri
- 81 Strongly Landlord-Friendly · R+10
- County
- — inherits STATE
- City
- — inherits STATE
ZIP-level market 63114
- Rents YoY
- 2.0%
- Active inventory
- 120
- Price-to-rent
- 5.9×
Monthly cashflow live
- Estimated rent
- $1,351 high interval (Pro) →
- Mortgage (P&I)
- −$498
- Tax from tax record
- −$85 /mo · $1,026/yr
- Insurance
- −$40
- HOA
- −$0
- Vacancy / Maint / Mgmt
- −$284
- Net cashflow
- $444
Break-even live
Sensitivity live
| Price | -10% $498 | -5% $471 | +0% $444 | +5% $417 | +10% $391 |
|---|---|---|---|---|---|
| Rent | -10% $338 | -5% $391 | +0% $444 | +5% $498 | +10% $551 |
| Rate | -1.0pp $492 | -0.5pp $468 | base $444 | +0.5pp $420 | +1.0pp $395 |
UW: 25.0% down · 7.5% · 30yr · 1.5% tax · 5.0% vac · 8.0% maint · 8.0% mgmt
Financing live
Cash to close
- Down payment
- $23,725
- Closing costs
- $2,847
- Reserves months
- —
- Total cash needed
- —
Loan-product check · same deal, 3 products live
Conventional
25% down · 7.5% · 30yr
- Down + closing
- —
- Monthly P&I
- —
- Monthly cashflow
- —
- DSCR
- —
- Eligible?
- —
Personal DTI + credit; lowest rate.
DSCR
20% down · 8.5% · 30yr
- Down + closing
- —
- Monthly P&I
- —
- Monthly cashflow
- —
- DSCR
- —
- Eligible?
- —
No personal income docs; deal must DSCR.
Hard money
10% down · 12.0% · 12mo
- Down + closing
- —
- Monthly P&I
- —
- Monthly cashflow
- —
- DSCR
- —
- Eligible?
- —
Short-term bridge; refi at stabilization.
Rent comps 33 comps
| Address | Beds | Baths | Sqft | Rent | $/sqft | DOM | Units | Dist |
|---|---|---|---|---|---|---|---|---|
| 3209 Dix Ave Saint Louis, MO | 3.0 | 1.0 | 1122 | $1,550 | $1.38 | 25d | 1 | 0.20mi |
| 3208 Dix Ave Saint Louis, MO | 2.0 | 1.0 | 656 | $1,215 | $1.85 | 0d | 1 | 0.21mi |
| 3219 Royalton Ave Saint Louis, MO | 2.0 | 1.0 | 792 | $1,095 | $1.38 | 23d | 1 | 0.25mi |
| 3209 Royalton Ave Saint Louis, MO | 2.0 | 1.0 | 805 | $1,150 | $1.43 | 45d | 1 | 0.26mi |
| 9310 Shirley Gardens Dr Apt C St. Louis, MO | 2.0 | 1.0 | 800 | $1,200 | $1.50 | 45d | 1 | 0.34mi |
| 9310 Shirley Gardens Dr Apt B St. Louis, MO | 2.0 | 1.0 | 800 | $1,100 | $1.38 | 45d | 1 | 0.34mi |
| 9535 Baltimore Ave Saint Louis, MO | 2.0 | 1.0 | 800 | $1,145 | $1.43 | 25d | 1 | 0.38mi |
| 9618 De Porres Ln Saint Louis, MO | 2.0 | 1.0 | 875 | $1,200 | $1.37 | 45d | 1 | 0.42mi |
| 3648 Edmundson Rd Unit 1 St. Louis, MO | 2.0 | 1.0 | 900 | $995 | $1.11 | 45d | 1 | 0.44mi |
| 9429 Baltimore Ave Saint Louis, MO | 2.0 | 1.0 | 900 | $1,200 | $1.33 | 0d | 1 | 0.45mi |
| 9429 Baltimore Ave Saint Louis, MO | 2.0 | 1.0 | 900 | $1,200 | $1.33 | 25d | 1 | 0.45mi |
| 2732 Annapolis Ave Saint Louis, MO | 2.0 | 1.0 | 768 | $1,250 | $1.63 | 45d | 1 | 0.48mi |
| 3434 Sims Ave Saint Ann, MO | 3.0 | 1.5 | 988 | $1,545 | $1.56 | 45d | 1 | 0.50mi |
| 9675 Muriel Ave Unit 9709 Overland, MO | 2.0 | 1.5 | 830 | $1,200 | $1.45 | 0d | 1 | 0.57mi |
| 9675 Muriel Ave Unit 9627 Overland, MO | 2.0 | 1.5 | 830 | $1,200 | $1.45 | 45d | 1 | 0.57mi |
| 9675 Muriel Ave Unit 9733 Overland, MO | 2.0 | 1.5 | 830 | $1,200 | $1.45 | 4d | 1 | 0.57mi |
| 9448 Harold Dr Saint Louis, MO | 2.0 | 1.0 | 864 | $1,495 | $1.73 | 45d | 1 | 0.66mi |
| 10116 Saint Katherine Ln Saint Ann, MO | 3.0 | 1.0 | 984 | $1,865 | $1.90 | 19d | 1 | 0.74mi |
| 10214 Saint Anthony Ln Saint Ann, MO | 2.0 | 1.0 | 734 | $1,200 | $1.63 | 45d | 1 | 0.85mi |
| 9183 Harold Dr Saint Louis, MO | 3.0 | 1.0 | 912 | $1,200 | $1.32 | 45d | 1 | 0.85mi |
| 9807 Guthrie Ave Saint Louis, MO | 3.0 | 2.0 | 1068 | $1,685 | $1.58 | 0d | 1 | 0.86mi |
| 10205 Saint Daniel Ln Saint Ann, MO | 2.0 | 1.0 | 792 | $1,450 | $1.83 | 45d | 1 | 0.86mi |
| 3529 Saint Joachim Ln Saint Ann, MO | 2.0 | 1.0 | 900 | $1,450 | $1.61 | 25d | 1 | 0.95mi |
| 3529 Saint Joachim Ln Unit NA St Ann, MO | 2.0 | 1.0 | 900 | $1,450 | $1.61 | 22d | 1 | 0.96mi |
| 10069 Livingston Ave St Ann, MO | 2.0 | 1.0 | 875 | $1,100 | $1.26 | 25d | 1 | 1.08mi |
| 8819 McNulty Dr Saint Louis, MO | 2.0 | 1.0 | 752 | $1,225 | $1.63 | 45d | 1 | 1.11mi |
| 3961 Jane Ave Unit 3963 St Ann, MO | 2.0 | 1.0 | 750 | $1,195 | $1.59 | 16d | 1 | 1.12mi |
| 4120 Geraldine Ave St Ann, MO | 2.0 | 1.5 | 922 | $1,200 | $1.30 | 19d | 1 | 1.35mi |
| 9969 Sloane Sq Unit 9969C St. Louis, MO | 2.0 | 1.0 | 761 | $895 | $1.18 | 6d | 1 | 1.37mi |
| 2452 Ashland Ave Saint Louis, MO | 2.0 | 1.0 | 1028 | $1,350 | $1.31 | 45d | 1 | 1.42mi |
| 2201 Gaebler Ave Unit 1 Overland, MO | 2.0 | 1.0 | 750 | $1,300 | $1.73 | 0d | 1 | 1.49mi |
| 2201 Gaebler Ave Unit A Overland, MO | 2.0 | 1.0 | 710 | $1,250 | $1.76 | 25d | 1 | 1.49mi |
| 10145 Cabana Club Dr St Ann, MO | 1.0–2.0 | 1.0–2.0 | 776 | $1,060 | $1.37 | 45d | 8 | 1.50mi |
Listing history 20 events
-
2026-06-21days on market $94,900 Active 52 DOM
-
2026-06-18days on market $94,900 Active 49 DOM
-
2026-06-17days on market $94,900 Active 48 DOM
-
2026-06-16days on market $94,900 Active 47 DOM
-
2026-06-15days on market $94,900 Active 46 DOM
-
2026-06-13pricedays on market $94,900 Active 44 DOM
-
2026-06-09days on market $99,900 Active 40 DOM
-
2026-06-08days on market $99,900 Active 39 DOM
-
2026-06-07days on market $99,900 Active 38 DOM
-
2026-06-03days on market $99,900 Active 34 DOM
-
2026-06-02days on market $99,900 Active 33 DOM
-
2026-06-01days on market $99,900 Active 32 DOM
-
2026-05-31days on market $99,900 Active 31 DOM
-
2026-04-30$99,900 Active 1126-char remark
-
2019-12-05soldstatus $23,573
-
2014-05-28soldstatus $25,000
-
2009-04-24soldstatus $10,300
-
2007-10-31soldstatus
-
1988-10-01soldstatus
-
1979-05-01soldstatus
ⓘ Source: listings_history table (triggers on properties + properties_extension) + one-shot
backfill from property_details.listing_events for pre-trigger history.
Tax reassessment forecast MO · Resets to sale price
- Current annual tax
- $1,026 · $85/mo
- Projected year-2 tax
- $1,026 · $85/mo
- Expected delta
- $0/yr ($0/mo · 0.0%)
ⓘ Screening estimate from a state-policy table — verify with the county assessor before closing.
Climate risk First Street
- Flood 1/10 Low FEMA zone X (unshaded) · 0% chance over 30 yrs
- Wildfire 1/10 Low
- Heat 4/10 Moderate 7 d/yr ≥106°F today · 21 d/yr by 30 yrs out
- Wind 2/10 Low 100% chance of damaging wind over 30 yrs
- Air quality 2/10 Low 1 unhealthy d/yr today · 3 by 30 yrs out
Nearby sold comps map
Loading sold comps map…
Walkable amenities ~0.75 mi
Loading nearby amenities…
Taxation est. · year 1
- Rental income
- $16,208
- − Mortgage interest
- −$5,316
- − Property taxes
- −$1,026
- − Insurance
- −$474
- − Repairs & maintenance
- −$1,297
- − Management
- −$1,297
- − Depreciation
- −$2,761
- Taxable income
- $4,038
- Est. tax owed @ 24.0%
- −$969
- After-tax cash flow
- $4,363/yr
For passive investors: Depreciation is non-cash, so a rental often shows a tax loss while cash-flowing — sheltering income. Rental losses are passive: they offset passive income freely, and up to $25,000/yr can offset ordinary (W-2) income if you actively participate and your MAGI is under $100k (phasing out to $0 by $150k); unused losses carry forward. On sale, claimed depreciation is recaptured at up to 25%, and gains may owe capital-gains tax (a 1031 exchange can defer both). Figures are a year-1 estimate at your 24.0% rate — not tax advice; consult a CPA.
Schools (NCES district)
- District
- Ritenour
- NCES district ID
- 2926640
- Math proficiency
- 13% ▼ -14.00%
- Reading proficiency
- 27% ▼ -7.00%
- Median HH income
- $41,410
- Composite
- 17.04/100
- National rank
- #9125
- State rank
- #304 of 324 in MO
Livability — Breckenridge Hills
- Score
- 68/100
- State rank
- #193
- US rank
- #10013
Category grades
Schools grade is shown separately in the Schools card above.
Census & demographics
- Census place
- Breckenridge Hills, MO
- County
- Saint Louis County · 888,823 people
- Metro
- St. Louis, MO-IL
- Population (ZIP)
- 33,969
- Household income
- $55,870
- Rent vs Own
- Severe rent burden
- 1595.0
Population outlook (St. Louis County) Hauer SSP2
- Today (2025)
- 1,025,227 people
- By 2030
- 1,028,023 · +0.3%
- By 2040
- 1,020,940 · -0.4%
- By 2050
- 1,007,280 · -1.8%
- By 2075
- 987,277 · -3.7%
- By 2100
- 921,984 · -10.1%
Race, ethnicity, and origin ACS 2023
- Neighborhood character
- Diverse neighborhood (Simpson 0.64)
- Race & ethnicity
- White 50% Black 30% Hispanic / Latino 11% Two or more races 6% Asian 2%
- Hispanic origin (detail)
- Mexican 7%
- Common ancestry
- Lithuanian 3% Italian 2% Romanian 1%
- Foreign-born
- 9% · Canada, Vietnam
- Languages at home
- 84% English-only · Spanish 10% French/Haitian/Cajun 2% Tagalog/Filipino 1%
Political lean MEDSL · St. Louis
- 2024 margin
- Strong D (+23.4) · D 60.8% · R 37.4% · Other 1.7%
- 2008→2024 swing
- +3.5pp toward D · 2008: 19.9pp · 2024: 23.4pp
- All cycles
- 2024: D+23.4 2020: D+24.0 2016: D+16.2 2012: D+13.7 2008: D+19.9
Not yet ingested
- Civics
- —
Market trends
- HPI YoY
- ▼ -276.62%
- Current HPI
- 223.9305
- Rent YoY
- ▲ 2.04%
- Metro
- St. Louis, MO-IL
- State GDP YoY
- ▲ 1.84%
- F500 in state
- 20
Industry mix (Fortune 500 HQ in MO)
| Industry | F500 HQs | Revenue |
|---|---|---|
| Healthcare | 1 | $163B |
|
||
| Insurance | 1 | $21B |
|
||
| Industrial Technology | 1 | $17B |
|
||
| Retail | 1 | $16B |
|
||
| Industrial Distribution | 1 | $10B |
|
||
| Utilities | 1 | $9B |
|
||
Price history
+821.4% since first listed8 events — show timeline
- 2026-06-11 Price Changed $94,900 MARIS as Distributed by MLS Grid
- 2026-04-30 Listed $99,900 MARIS as Distributed by MLS Grid
- 2019-12-05 Sold (Public Records) $23,573 Public Records
- 2014-05-28 Sold (Public Records) $25,000 Public Records
- 2009-04-24 Sold (Public Records) $10,300 Public Records
- 2007-10-31 Sold (Public Records) — Public Records
- 1988-10-01 Sold (Public Records) — Public Records
- 1979-05-01 Sold (Public Records) — Public Records
Property tax history
+2.2%/yrLatest (2022): $1,026 · +0.2% YoY. Source: county tax records.
Cash-flow waterfall
monthlySold comps — $/sqft
last 12 mo · ≤1 miLoading sold comps…