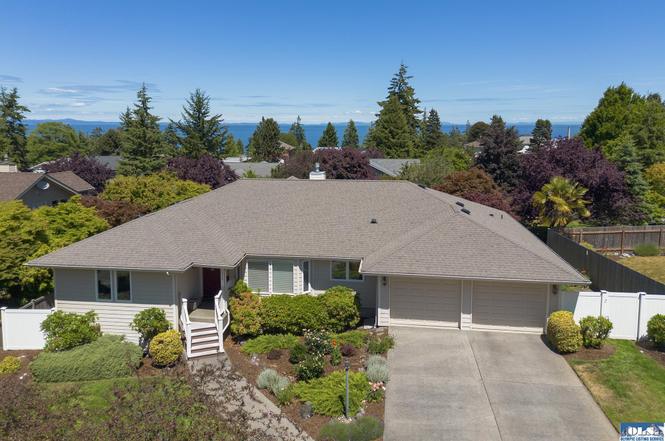
2015 W 7th St · Port Angeles, WA
Flood risk 1/10 · Minimal
- FEMA flood zone
- X
- Chance of flooding over 30 yrs
- 0.0%
- Est. flood insurance / yr
- $507 – $1,088
Fire risk 1/10 · Minimal
- Est. fire insurance / yr
- $604 – $1,122
Heat risk 2/10 · Minimal
- Hot days now (above 82°F)
- 9 days/yr
- Hot days in 30 yrs
- 18 days/yr
Wind risk 1/10 · Minimal
- Chance of severe wind over 30 yrs
- —
Air-quality risk 6/10 · Moderate
- Unhealthy air days now
- 7 days/yr
- Unhealthy air days in 30 yrs
- 7 days/yr
Risk factors via First Street. Map © Google.
Why this score? — see what drove the C+ grade
The composite is a weighted blend of 9 inputs, each scored 0–100. Each bar is that input's sub-score; the figure is the points it added to the 100-point composite (weight × sub-score).
- Cash flow +29.1/30.0
- DSCR +10.0/10.0
- 1% rule +7.5/10.0
- Schools +5.2/10.0
- Livability +3.9/5.0
- Rent growth +2.5/5.0
- Condition / age +2.5/5.0
- ARV discount +1.1/15.0
- Appreciation +0.0/10.0
$575,000
🖨 Deal sheet 📄 Offer letter ✓ Due diligence
Listing remarks MLS
Immaculate 1 level, 1-owner, turnkey home nestled on the west side of Port Angeles w/ peek a boo salt water views. Tall ceilings & large windows create a light and bright atmosphere throughout the home. Quality and well cared for home features hardwood floors, formal dining room, propane fireplace, & heat pump. Spacious primary suite boasts double sinks, soak tub, & large walk in closet. Clean 2 car attached garage w/ brand new garage door & utility sink. The real star of this show is the incredible yard! Lush grass, tasteful and beautiful landscaping, fenced backyard, concrete patio.
Key facts
- Double sinks
- Propane fireplace
- Formal dining room
Tags
Property features AI
Finance
- Financial info: Financing accepted: Cash, Conventional, FHA, USDA, VA
Exterior
- Parking: Attached garage; Covered parking for 2 vehicles
- Security: Fully fenced
- Utilities: Public water; Sewer connected; Electric and propane energy sources
- Home design: Single-family house; One level; Built in 1997; Very good condition; Built on lot
- Construction: Cement construction materials; Composition roof; Poured concrete foundation
- Exterior features: Fully fenced yard; Patio; Cement/concrete exterior
Interior
- Kitchen: Dishwasher; Refrigerator; Stove/Range
- Bedrooms: 3 bedrooms (all on main level)
- Flooring: Hardwood; Vinyl
- Bathrooms: 2 full bathrooms (main level)
- Heating & cooling: Heat pump for heating and cooling
- Interior features: Dining room; Fireplace (gas)
- Laundry & utility: Washer; Dryer
Neighborhood map
What this means for you Summary
Snapshot
- This is a 3-bed/2.0-bath single-family listed at $575k.
Deal economics
- At list price, monthly cash flow is $2k ($24k/yr) — positive.
- The deal already cash-flows at list — no discount required.
- Meets the 1% rule at list price ($7k rent vs $575k).
- Cap rate 10.5% vs local median 2.8% in Port Angeles — top-decile yield for the area; either an underpriced asset or a hidden risk that comps aren't pricing in. Stress-test before assuming the spread holds.
Location & tenants
- Location reads 78/100 on livability (#138 in WA, #2,729 nationally) — a middle-class / working-renter tenant base. Strengths: amenities A+, commute A+, health & safety A+; Watch: employment C-, crime F.
- Port Angeles School District (town): math 55% / reading 65% proficiency, ranked #70 of 291 in WA (top 24%) — acceptable for families but not a draw, mixed tenant base, ~2y average lease.
- Market conditions: 128 active listings in the ZIP; 2 comparable units currently listed for rent nearby; 166 units permitted in Clallam County in 2024 (0 in 5+ unit buildings).
Forward outlook
- Local home prices are declining (-3.0%/yr); year-one equity from $4k of loan paydown is wiped out by about $17k of value loss. Plan a longer hold.
- Clallam County population projected at +5% by 2050 — modest demand growth; plan on rents tracking national, not racing it.
- At projected returns (-3.0% appreciation + 3.0% rent growth), your $161k cash investment doubles in ~8 years — after that, you're playing with house money.
Negotiation context
- Only 3 days on market — expect competitive offers; lowballing is unlikely to land.
- 2 sale attempts with the ask held roughly flat each time — persistent listings suggest the price (not the market) is what's stuck; bring a comps-based counter.
Questions for the listing agent
- Is there a deadline driving the sale (1031 exchange, divorce, estate, relocation)? That informs how much negotiation room exists.
- Schools are B-rated — typically a magnet for longer-tenancy family renters. What's the average tenant stay here, and is there a school-zone premium baked into asking?
- Crime grade is F in this area — have there been break-ins, vandalism, or insurance claims at this property in the last 3 years? What carrier currently insures it and at what premium?
- What's the average days-on-market for RENTAL listings here right now (not sales)? A rising rental-DOM trend means longer vacancies and softer asking-rent achievability than the comps imply.
- What's the recent tenant-quality profile in this submarket — average credit score on applications, eviction rate, late-payment / NSF rate, and stable-employment percentage? A property-management company in the area should have these aggregated.
- How much new for-sale + rental construction is in the pipeline within 1–3 miles? Heavy new supply typically softens prices + rents 12–24 months out; constrained supply supports both.
Investment metrics
- 1% rule
- 1.25% ✓
- Cap rate
- 10.45%
- Cash-on-cash
- 14.85%
- DSCR
- 1.66
- GRM
- 6.7
CMA / ARV
- ARV (on-the-fly)
- $503,811
- Comps found
- 12
Show comp detail 12 sales within ~0.75 mi
| Address | Dist | Beds/Ba | Sqft | Sold | Price | $/sf | Match |
|---|---|---|---|---|---|---|---|
| 2131 W 7th St | 0.14mi | 3/2.0 | 2,040 (-6%) | 4mo | $430,000 | $211 | 80 |
| 1816 W 5th St | 0.24mi | 3/3.0 | 2,176 (-0%) | 7mo | $570,000 | $262 | 79 |
| 1812 W 12th St | 0.44mi | 3/2.0 | 2,148 (-2%) | 1mo | $456,000 | $212 | 76 |
| 2140 W 6th St | 0.17mi | 2/2.0 (-1) | 2,104 (-4%) | 7mo | $559,000 | $266 | 76 |
| 2016 W Fourth St | 0.18mi | 3/2.0 | 1,876 (-14%) | 5mo | $469,000 | $250 | 64 |
| 2105 Seabreeze Pl | 0.30mi | 4/2.0 (+1) | 1,898 (-13%) | 10mo | $424,950 | $224 | 51 |
| 1426 W 4th St | 0.64mi | 3/2.0 | 2,388 (+10%) | 8mo | $551,000 | $231 | 48 |
| 1429 W 12th St | 0.70mi | 3/2.5 | 2,329 (+7%) | 9mo | $595,000 | $255 | 46 |
| 607 S H St | 0.60mi | 3/3.0 | 1,920 (-12%) | 5mo | $205,000 | $107 | 44 |
| 1623 W 14th | 0.64mi | 3/3.0 | 2,458 (+13%) | 2mo | $567,000 | $231 | 43 |
| 1421 W 5th St | 0.64mi | 4/3.0 (+1) | 2,010 (-8%) | 9mo | $640,000 | $318 | 40 |
| 1937 W 18th St | 0.75mi | 4/3.0 (+1) | 2,388 (+10%) | 10mo | $480,000 | $201 | 32 |
Match score weights: distance 35% · size 25% · config 20% · recency 20%. Top-matched comps best support the ARV.
Projected returns pro-forma
-3.0% appreciation · 3.0% rent growth · sell at horizon
- IRR
- 5.4%
- Equity multiple
- 1.21×
- Total profit
- $33,646
- Equity at exit
- $85,734
- IRR
- 14.8%
- Equity multiple
- 2.20×
- Total profit
- $192,421
- Equity at exit
- $49,715
Cash invested: $161,000 (down + closing). Projections, not guarantees.
Landlord ↔ Tenant lean methodology
- Overall (STATE)
- 28 Tenant-Leaning
- State Washington
- 28 Tenant-Leaning · D+8
- County
- — inherits STATE
- City
- — inherits STATE
ZIP-level market 98363
- Active inventory
- 128
- Price-to-rent
- 6.7×
Monthly cashflow live
- Estimated rent
- $7,195 medium interval (Pro) →
- Mortgage (P&I)
- −$3,015
- Tax from tax record
- −$437 /mo · $5,242/yr
- Insurance
- −$240
- HOA
- −$0
- Vacancy / Maint / Mgmt
- −$1,511
- Net cashflow
- $1,992
Break-even live
UW: 25.0% down · 7.5% · 30yr · 1.5% tax · 5.0% vac · 8.0% maint · 8.0% mgmt
Financing live
Cash to close
- Down payment
- $143,750
- Closing costs
- $17,250
- Reserves months
- —
- Total cash needed
- —
Loan-product check · same deal, 3 products live
Conventional
25% down · 7.5% · 30yr
- Down + closing
- —
- Monthly P&I
- —
- Monthly cashflow
- —
- DSCR
- —
- Eligible?
- —
Personal DTI + credit; lowest rate.
DSCR
20% down · 8.5% · 30yr
- Down + closing
- —
- Monthly P&I
- —
- Monthly cashflow
- —
- DSCR
- —
- Eligible?
- —
No personal income docs; deal must DSCR.
Hard money
10% down · 12.0% · 12mo
- Down + closing
- —
- Monthly P&I
- —
- Monthly cashflow
- —
- DSCR
- —
- Eligible?
- —
Short-term bridge; refi at stabilization.
Rent comps 2 comps
| Address | Beds | Baths | Sqft | Rent | $/sqft | DOM | Units | Dist |
|---|---|---|---|---|---|---|---|---|
| 2114 W 6th St Unit 1336270P Port Angeles, WA | 3.0 | 2.5 | 2497 | $7,892 | $3.16 | 43d | 1 | 0.09mi |
| 1426 W 4th St Port Angeles, WA | 3.0 | 2.0 | 2388 | $2,800 | $1.17 | 43d | 1 | 0.66mi |
Listing history 4 events
-
2026-06-18days on market $575,000 Active 3 DOM
-
2026-06-17days on market $575,000 Active 2 DOM
-
2026-06-16remarks 592-char remark
-
2026-06-16$575,000 Active 1 DOM
ⓘ Source: listings_history table (triggers on properties + properties_extension) + one-shot
backfill from property_details.listing_events for pre-trigger history.
Tax reassessment forecast WA · Resets to sale price
- Current annual tax
- $5,242 · $437/mo
- Projected year-2 tax
- $5,635 · $470/mo
- Expected delta
- +$393/yr (+$33/mo · 7.5%)
ⓘ Screening estimate from a state-policy table — verify with the county assessor before closing.
Climate risk First Street
- Flood 1/10 Low FEMA zone X · 0% chance over 30 yrs
- Wildfire 1/10 Low
- Heat 2/10 Low 9 d/yr ≥82°F today · 18 d/yr by 30 yrs out
- Wind 1/10 Low
- Air quality 6/10 Major 7 unhealthy d/yr today · 7 by 30 yrs out
Nearby sold comps map
Loading sold comps map…
Walkable amenities ~0.75 mi
Loading nearby amenities…
Taxation est. · year 1
- Rental income
- $86,339
- − Mortgage interest
- −$32,209
- − Property taxes
- −$5,242
- − Insurance
- −$2,875
- − Repairs & maintenance
- −$6,907
- − Management
- −$6,907
- − Depreciation
- −$16,727
- Taxable income
- $15,472
- Est. tax owed @ 24.0%
- −$3,713
- After-tax cash flow
- $20,193/yr
For passive investors: Depreciation is non-cash, so a rental often shows a tax loss while cash-flowing — sheltering income. Rental losses are passive: they offset passive income freely, and up to $25,000/yr can offset ordinary (W-2) income if you actively participate and your MAGI is under $100k (phasing out to $0 by $150k); unused losses carry forward. On sale, claimed depreciation is recaptured at up to 25%, and gains may owe capital-gains tax (a 1031 exchange can defer both). Figures are a year-1 estimate at your 24.0% rate — not tax advice; consult a CPA.
Schools (NCES district)
- District
- Port Angeles School District
- NCES district ID
- 5306820
- Math proficiency
- 55% ▬ 0.00%
- Reading proficiency
- 65% ▲ 1.00%
- Median HH income
- $46,594
- Composite
- 52.34/100
- National rank
- #3432
- State rank
- #70 of 291 in WA
Livability — Port Angeles
- Score
- 78/100
- State rank
- #138
- US rank
- #2729
Category grades
Schools grade is shown separately in the Schools card above.
Census & demographics
- Census place
- Port Angeles, WA
- Population (ZIP)
- 14,644
Population outlook (Clallam County) Hauer SSP2
- Today (2025)
- 76,817 people
- By 2030
- 78,177 · +1.8%
- By 2040
- 79,795 · +3.9%
- By 2050
- 80,890 · +5.3%
- By 2075
- 83,933 · +9.3%
- By 2100
- 82,141 · +6.9%
Race, ethnicity, and origin ACS 2023
- Neighborhood character
- Predominantly White (80%)
- Race & ethnicity
- White 80% Two or more races 9% Hispanic / Latino 6% Native American 5%
- Hispanic origin (detail)
- Mexican 4%
- Common ancestry
- Italian 8% Portuguese 6% Slovak 4%
- Foreign-born
- 3% · Canada
- Languages at home
- 96% English-only · Spanish 2%
Political lean MEDSL · Clallam
- 2024 margin
- Lean D (+7.9) · D 52.6% · R 44.7% · Other 2.7%
- 2008→2024 swing
- +4.6pp toward D · 2008: 3.3pp · 2024: 7.9pp
- All cycles
- 2024: D+7.9 2020: D+3.4 2016: R+1.6 2012: D+0.4 2008: D+3.3
Not yet ingested
- Civics
- —
Market trends
- HPI YoY
- ▼ -269.47%
- Current HPI
- 198.0851
- Rent YoY
- —
- Metro
- —
- State GDP YoY
- ▲ 4.65%
- F500 in state
- 22
Industry mix (Fortune 500 HQ in WA)
| Industry | F500 HQs | Revenue |
|---|---|---|
| Retail | 2 | $269B |
|
||
| Technology / Retail | 1 | $638B |
|
||
| Technology | 1 | $245B |
|
||
| Telecommunications | 1 | $38B |
|
||
| Food / Beverage | 1 | $36B |
|
||
| Automotive / Trucks | 1 | $34B |
|
||
Price history
+0.0% since first listed2 events — show timeline
- 2026-06-15 Listed $575,000 OLS
- 2026-06-15 Listed $575,000 NWMLS as Distributed by MLS Grid
Property tax history
+3.9%/yrLatest (2026): $5,242 · +2.7% YoY. Source: county tax records.
Cash-flow waterfall
monthlySold comps — $/sqft
last 12 mo · ≤1 miLoading sold comps…