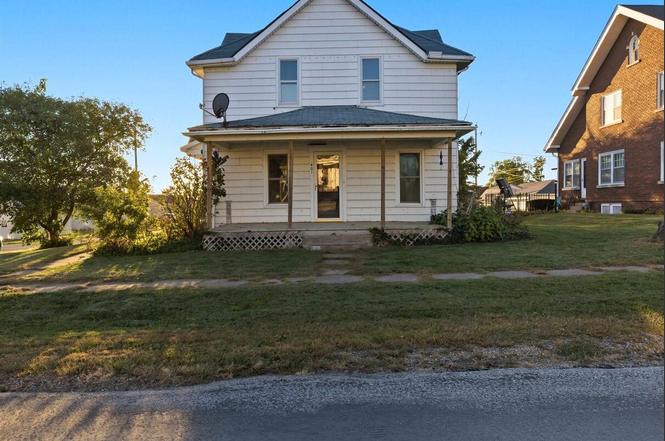
401 Jefferson Ave · Lowden, IA
Flood risk 1/10 · Minimal
- FEMA flood zone
- X (unshaded)
- Chance of flooding over 30 yrs
- 0.0%
- Est. flood insurance / yr
- $473 – $860
Fire risk 1/10 · Minimal
- Est. fire insurance / yr
- $902 – $1,676
Heat risk 3/10 · Minor
- Hot days now (above 104°F)
- 7 days/yr
- Hot days in 30 yrs
- 15 days/yr
Wind risk 2/10 · Minimal
- Chance of severe wind over 30 yrs
- —
Air-quality risk 2/10 · Minimal
- Unhealthy air days now
- 2 days/yr
- Unhealthy air days in 30 yrs
- 2 days/yr
Risk factors via First Street. Map © Google.
Why this score? — see what drove the A grade
The composite is a weighted blend of 9 inputs, each scored 0–100. Each bar is that input's sub-score; the figure is the points it added to the 100-point composite (weight × sub-score).
- Cash flow +30.0/30.0
- ARV discount +15.0/15.0
- DSCR +10.0/10.0
- 1% rule +9.5/10.0
- Appreciation +7.7/10.0
- Schools +5.3/10.0
- Livability +3.5/5.0
- Rent growth +2.5/5.0
- Condition / age +2.5/5.0
$84,999
🖨 Deal sheet 📄 Offer letter ✓ Due diligence
Listing remarks
Step into timeless charm with this beautiful 4-bedroom, 1-bath home built in 1903. Featuring stunning original woodwork throughout, this home blends historic character with modern living. The main level offers convenient living space, including a bedroom, spacious living and dining areas, main floor laundry and plenty of natural light. Upstairs, you'll find three generously sized bedrooms with great closet space. Enjoy the outdoors with a spacious backyard-perfect for entertaining, gardening, or play-and an oversized detached 2-car garage with finished Loft area that provides plenty of storage and workspace. Situated on a corner lot in a quiet neighborhood, this home offers small-town livin
Key facts
- Spacious backyard
- Main floor laundry
- Original woodwork
Tags
Neighborhood map
What this means for you Summary
Snapshot
- This is a 4-bed/1.0-bath single-family listed at $85k.
Deal economics
- At list price, monthly cash flow is $368 ($4k/yr) — positive.
- The deal already cash-flows at list — no discount required.
- Meets the 1% rule at list price ($1k rent vs $85k).
- Recommended offer: $84k (1.5% below list) — sets the bar for market timing.
Location & tenants
- Location reads 69/100 on livability (#384 in IA) — a middle-class / working-renter tenant base. Strengths: cost of living A+, housing A+, health & safety A-; Watch: amenities F, commute F.
- North Cedar Community School District (rural): math 61% / reading 63% proficiency, ranked #219 of 289 in IA (top 76%) — acceptable for families but not a draw, mixed tenant base, ~2y average lease.
- Market conditions: 12 active listings in the ZIP; 89 units permitted in Cedar County in 2024 (40 in 5+ unit buildings).
Forward outlook
- In year one you build about $5k of equity ($587 loan paydown + $5k appreciation (5.4% local appreciation)).
- Cedar County population projected to shrink 9% by 2050 — rents likely to lag national; underwrite the cash flow, not the appreciation.
- At projected returns (5.4% appreciation + 3.0% rent growth), your $24k cash investment doubles in ~3 years — after that, you're playing with house money.
- By year 7, paydown + projected appreciation supports a ~$34k cash-out refi (75% LTV) — recoverable capital for the next deal without selling this one.
Negotiation context
- It's been on market 26 days — a 2% lower offer ($84k) is reasonable based on typical stale-listing flexibility.
- 5 sale attempts since 22y ago; this cycle's ask is 9% above the opening price — seller raised mid-cycle; expect resistance to lowballs.
Risks & watch-outs
- Watch-outs: built in 1903 — expect roof / HVAC / electrical / plumbing capex.
Questions for the listing agent
- Built in 1903 — when were the roof, HVAC, electrical panel, plumbing, and water heater last replaced?
- Is there a deadline driving the sale (1031 exchange, divorce, estate, relocation)? That informs how much negotiation room exists.
- Schools are B-rated — typically a magnet for longer-tenancy family renters. What's the average tenant stay here, and is there a school-zone premium baked into asking?
- What's the average days-on-market for RENTAL listings here right now (not sales)? A rising rental-DOM trend means longer vacancies and softer asking-rent achievability than the comps imply.
- What's the recent tenant-quality profile in this submarket — average credit score on applications, eviction rate, late-payment / NSF rate, and stable-employment percentage? A property-management company in the area should have these aggregated.
- How much new for-sale + rental construction is in the pipeline within 1–3 miles? Heavy new supply typically softens prices + rents 12–24 months out; constrained supply supports both.
Investment metrics
- 1% rule
- 1.45% ✓
- Cap rate
- 11.49%
- Cash-on-cash
- 18.55%
- DSCR
- 1.83
- GRM
- 5.7
CMA / ARV
- ARV (on-the-fly)
- $138,288
- Comps found
- 9
Show comp detail 9 sales within ~0.75 mi
| Address | Dist | Beds/Ba | Sqft | Sold | Price | $/sf | Match |
|---|---|---|---|---|---|---|---|
| 401 Jefferson Ave | 0.00mi | 4/1.0 | 1,608 (0%) | 4mo | $80,000 | $50 | 97 |
| 701 Hall Ave | 0.15mi | 4/2.0 | 1,684 (+5%) | 9mo | $144,500 | $86 | 74 |
| 202 5th St | 0.14mi | 4/1.5 | 1,525 (-5%) | 12mo | $137,500 | $90 | 73 |
| 121 Grant Ave | 0.17mi | 4/1.5 | 1,680 (+4%) | 21mo | $175,000 | $104 | 66 |
| 404 10th St | 0.30mi | 4/3.0 | 1,662 (+3%) | 11mo | $267,000 | $161 | 63 |
| 805 Mckinley Ave | 0.24mi | 5/3.5 (+1) | 1,640 (+2%) | 10mo | $250,000 | $152 | 62 |
| 605 Jefferson Ave | 0.11mi | 4/1.5 | 1,793 (+12%) | 19mo | $43,200 | $24 | 58 |
| 402 Harding Ave | 0.24mi | 3/2.0 (-1) | 1,740 (+8%) | 12mo | $110,000 | $63 | 56 |
| 507 Hall Ave | 0.10mi | 3/2.0 (-1) | 1,821 (+13%) | 22mo | $143,000 | $79 | 46 |
Match score weights: distance 35% · size 25% · config 20% · recency 20%. Top-matched comps best support the ARV.
Projected returns pro-forma
5.43% appreciation · 3.0% rent growth · sell at horizon
- IRR
- 29.8%
- Equity multiple
- 2.90×
- Total profit
- $45,181
- Equity at exit
- $50,430
- IRR
- 28.2%
- Equity multiple
- 5.85×
- Total profit
- $115,456
- Equity at exit
- $88,965
Cash invested: $23,800 (down + closing). Projections, not guarantees.
Landlord ↔ Tenant lean methodology
- Overall (STATE)
- 83 Strongly Landlord-Friendly
- State Iowa
- 83 Strongly Landlord-Friendly · R+6
- County
- — inherits STATE
- City
- — inherits STATE
ZIP-level market 52255
- Home prices YoY
- 3.2%
- Active inventory
- 12
- Price-to-rent
- 5.7×
Monthly cashflow live
- Estimated rent
- $1,234 medium interval (Pro) →
- Mortgage (P&I)
- −$446
- Tax from tax record
- −$126 /mo · $1,510/yr
- Insurance
- −$35
- HOA
- −$0
- Vacancy / Maint / Mgmt
- −$259
- Net cashflow
- $368
Break-even live
UW: 25.0% down · 7.5% · 30yr · 1.5% tax · 5.0% vac · 8.0% maint · 8.0% mgmt
Financing live
Cash to close
- Down payment
- $21,250
- Closing costs
- $2,550
- Reserves months
- —
- Total cash needed
- —
Loan-product check · same deal, 3 products live
Conventional
25% down · 7.5% · 30yr
- Down + closing
- —
- Monthly P&I
- —
- Monthly cashflow
- —
- DSCR
- —
- Eligible?
- —
Personal DTI + credit; lowest rate.
DSCR
20% down · 8.5% · 30yr
- Down + closing
- —
- Monthly P&I
- —
- Monthly cashflow
- —
- DSCR
- —
- Eligible?
- —
No personal income docs; deal must DSCR.
Hard money
10% down · 12.0% · 12mo
- Down + closing
- —
- Monthly P&I
- —
- Monthly cashflow
- —
- DSCR
- —
- Eligible?
- —
Short-term bridge; refi at stabilization.
Listing history 26 events
-
2026-05-24status Pending
-
2026-05-24status Pending
-
2026-05-22status Pending
-
2026-02-20soldstatus $80,000 Closed
-
2026-02-20soldstatus $80,000 Closed
-
2026-02-20soldstatus $80,000 Closed
-
2026-02-20soldstatus $80,000 Closed
-
2026-02-20soldstatus $80,000
-
2026-01-15status Pending
-
2026-01-14historical
-
2026-01-08status Active
-
2026-01-06historical
-
2026-01-05historical
-
2025-11-15price
-
2025-10-09Active
-
2025-07-03price
-
2025-06-13status Active
-
2025-06-13historical
-
2025-06-13historical
-
2025-06-02status Pending
-
2025-04-14price
-
2025-01-17Active
-
2021-08-06historical
-
2021-08-06historical
-
2004-06-10soldstatus $72,000
-
2004-03-24$78,000
ⓘ Source: listings_history table (triggers on properties + properties_extension) + one-shot
backfill from property_details.listing_events for pre-trigger history.
Tax reassessment forecast IA · Partial reset (capped growth)
- Current annual tax
- $1,510 · $126/mo
- Projected year-2 tax
- $1,510 · $126/mo
- Expected delta
- $0/yr ($0/mo · 0.0%)
ⓘ Screening estimate from a state-policy table — verify with the county assessor before closing.
Climate risk First Street
- Flood 1/10 Low FEMA zone X (unshaded) · 0% chance over 30 yrs
- Wildfire 1/10 Low
- Heat 3/10 Moderate 7 d/yr ≥104°F today · 15 d/yr by 30 yrs out
- Wind 2/10 Low
- Air quality 2/10 Low 2 unhealthy d/yr today · 2 by 30 yrs out
Nearby sold comps map
Loading sold comps map…
Walkable amenities ~0.75 mi
Loading nearby amenities…
Taxation est. · year 1
- Rental income
- $14,809
- − Mortgage interest
- −$4,761
- − Property taxes
- −$1,510
- − Insurance
- −$425
- − Repairs & maintenance
- −$1,185
- − Management
- −$1,185
- − Depreciation
- −$2,473
- Taxable income
- $3,271
- Est. tax owed @ 24.0%
- −$785
- After-tax cash flow
- $3,630/yr
For passive investors: Depreciation is non-cash, so a rental often shows a tax loss while cash-flowing — sheltering income. Rental losses are passive: they offset passive income freely, and up to $25,000/yr can offset ordinary (W-2) income if you actively participate and your MAGI is under $100k (phasing out to $0 by $150k); unused losses carry forward. On sale, claimed depreciation is recaptured at up to 25%, and gains may owe capital-gains tax (a 1031 exchange can defer both). Figures are a year-1 estimate at your 24.0% rate — not tax advice; consult a CPA.
Schools (NCES district)
- District
- North Cedar Community School District
- NCES district ID
- 1917100
- Math proficiency
- 61% ▼ -5.00%
- Reading proficiency
- 63% ▼ -7.00%
- Median HH income
- $54,549
- Composite
- 53.17/100
- National rank
- #1507
- State rank
- #219 of 289 in IA
Livability — Lowden
- Score
- 69/100
- State rank
- #384
- US rank
- #8177
Category grades
Schools grade is shown separately in the Schools card above.
Census & demographics
- Census place
- Lowden, IA
- Population (ZIP)
- 1,100
Population outlook (Cedar County) Hauer SSP2
- Today (2025)
- 18,416 people
- By 2030
- 18,294 · -0.7%
- By 2040
- 17,771 · -3.5%
- By 2050
- 16,841 · -8.6%
- By 2075
- 14,503 · -21.2%
- By 2100
- 11,301 · -38.6%
Race, ethnicity, and origin ACS 2023
- Neighborhood character
- Predominantly White (94%)
- Race & ethnicity
- White 94% Hispanic / Latino 5% Two or more races 5%
- Hispanic origin (detail)
- Mexican 2%
- Common ancestry
- Romanian 6% Slovak 5% Portuguese 3%
- Languages at home
- 99% English-only · Spanish 1%
Political lean MEDSL · Cedar
- 2024 margin
- Strong R (+21.8) · D 38.4% · R 60.1% · Other 1.5%
- 2008→2024 swing
- -31.4pp toward R · 2008: 9.6pp · 2024: -21.8pp
- All cycles
- 2024: R+21.8 2020: R+17.0 2016: R+18.1 2012: D+4.4 2008: D+9.6
Not yet ingested
- Civics
- —
Market trends
- HPI YoY
- ▲ 5.43%
- Current HPI
- 175.6028
- Rent YoY
- —
- Metro
- —
- State GDP YoY
- ▲ 2.48%
- F500 in state
- 4
Industry mix (Fortune 500 HQ in IA)
| Industry | F500 HQs | Revenue |
|---|---|---|
| Financial Services | 1 | $16B |
|
||
| Retail / Convenience | 1 | $15B |
|
||
Price history
+2.6% since first listed26 events — show timeline
- 2026-05-24 Pending — MRED as Distributed by MLS Grid
- 2026-05-24 Pending — MRED as Distributed by MLS Grid
- 2026-05-22 Pending — MRED as Distributed by MLS Grid
- 2026-02-20 Sold (Public Records) $80,000 Public Records
- 2026-02-20 Sold (MLS) $80,000 MRED as Distributed by MLS Grid
- 2026-02-20 Sold (MLS) $80,000 MRED as Distributed by MLS Grid
- 2026-02-20 Sold (MLS) $80,000 MRED as Distributed by MLS Grid
- 2026-02-20 Sold (MLS) $80,000 MRED as Distributed by MLS Grid
- 2026-01-15 Pending — MRED as Distributed by MLS Grid
- 2026-01-14 Listing Removed — MRED as Distributed by MLS Grid
- 2026-01-08 Relisted — MRED as Distributed by MLS Grid
- 2026-01-06 Listing Removed — RMLSA as Distributed by MLS Grid
- 2026-01-05 Listing Removed — MRED as Distributed by MLS Grid
- 2025-11-15 Price Changed — RMLSA as Distributed by MLS Grid
- 2025-10-09 Listed — RMLSA as Distributed by MLS Grid
- 2025-07-03 Price Changed — RMLSA as Distributed by MLS Grid
- 2025-06-13 Relisted — RMLSA as Distributed by MLS Grid
- 2025-06-13 Listing Removed — MRED as Distributed by MLS Grid
- 2025-06-13 Listing Removed — RMLSA as Distributed by MLS Grid
- 2025-06-02 Pending — RMLSA as Distributed by MLS Grid
- 2025-04-14 Price Changed — RMLSA as Distributed by MLS Grid
- 2025-01-17 Listed — RMLSA as Distributed by MLS Grid
- 2021-08-06 Listing Removed — RMLSA as Distributed by MLS Grid
- 2021-08-06 Listing Removed — RMLSA as Distributed by MLS Grid
- 2004-06-10 Sold (MLS) $72,000 RMLSA as Distributed by MLS Grid
- 2004-03-24 Listed $78,000 RMLSA as Distributed by MLS Grid
Property tax history
+2.8%/yrLatest (2025): $1,510 · +15.6% YoY. Source: county tax records.
Cash-flow waterfall
monthlySold comps — $/sqft
last 12 mo · ≤1 miLoading sold comps…