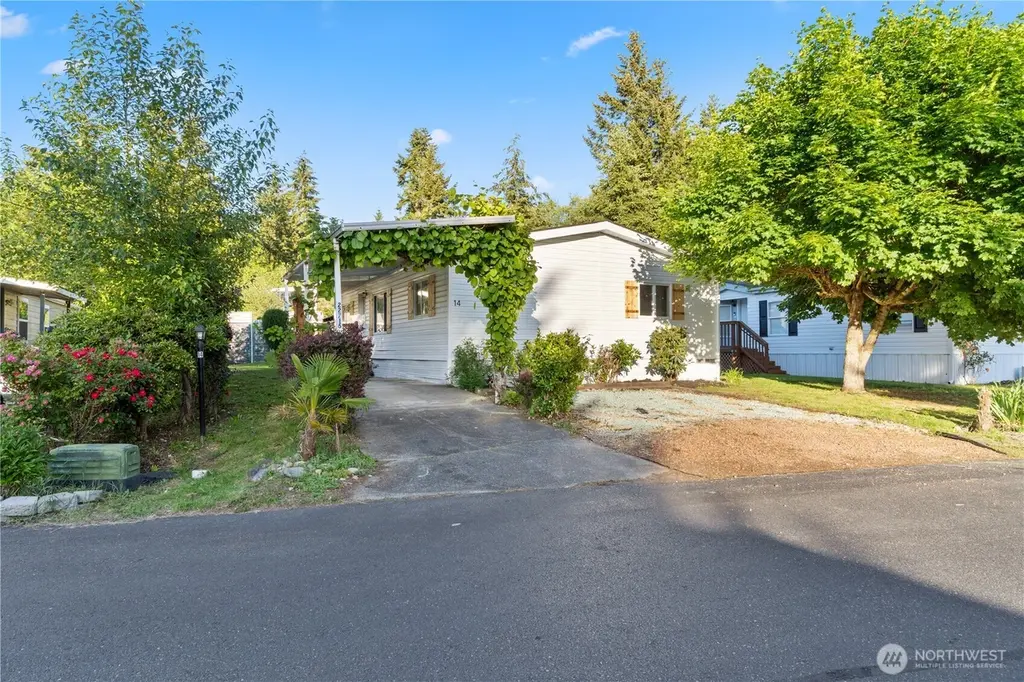
22715 91st Avenue Ct E #14 · Graham, WA
Flood risk 3/10 · Minor
- FEMA flood zone
- X (unshaded)
- Chance of flooding over 30 yrs
- 0.2%
- Est. flood insurance / yr
- $507 – $1,088
Fire risk 1/10 · Minimal
- Est. fire insurance / yr
- $604 – $1,122
Heat risk 3/10 · Minor
- Hot days now (above 87°F)
- 7 days/yr
- Hot days in 30 yrs
- 15 days/yr
Wind risk 1/10 · Minimal
- Chance of severe wind over 30 yrs
- —
Air-quality risk 7/10 · Major
- Unhealthy air days now
- 9 days/yr
- Unhealthy air days in 30 yrs
- 11 days/yr
Risk factors via First Street. Map © Google.
Why this score? — see what drove the C+ grade
The composite is a weighted blend of 9 inputs, each scored 0–100. Each bar is that input's sub-score; the figure is the points it added to the 100-point composite (weight × sub-score).
- Cash flow +30.0/30.0
- 1% rule +10.0/10.0
- DSCR +10.0/10.0
- Schools +4.9/10.0
- Rent growth +3.3/5.0
- Livability +3.2/5.0
- Condition / age +2.5/5.0
- ARV discount +0.0/15.0
- Appreciation +0.0/10.0
$135,000
🖨 Deal sheet (PDF) 📄 Offer letter ✓ Due diligence
Listing remarks
RECENTLY REMODELED MODERN STYLE! READY TO MOVE IN. This cozy 1985 property has 1,120sf, it counts with new luxury vinyl flooring, updated modern kitchen with new stove, dishwasher and range hood, quartz countertop, fixtures adjustable light. Plenty natural light. This property has three bedrooms, main bedroom has a shower and jacuzzi. Another full bathroom, new tile showers and vanities, fresh interior and exterior paint. Partially fenced with good size storage in the backyard with a pool table included, a nice covered carport in front of the main door with space for three cars plus a street space for two more cars. Relax on your covered porch in the backside perfect to gather with fri
Key facts
- Covered porch
- Quartz countertop
- Rv parking
Tags
Property features AI
Finance
- Other: Taxes and specific financial amounts excluded
- Financial info: Listing terms: Cash, Conventional
- HOA & community: Located in The Ridge park; Park has about 40 homes; Park amenities include common area and recreational area; Pets allowed — see remarks; Land lease: $975
Exterior
- Parking: Carport; RV parking available in the park
- Utilities: Public water (Washington Water); TPU power company; Electric water heater located inside the bedroom closet
- Home design: Manufactured single wide (Model 40/28); Updated/remodeled condition; One story; North facing; Has a view; Mobile home remains
- Construction: Metal/Vinyl construction materials; Composition roof; Pillar/Post/Pier foundation with tie downs; Manufactured house structure type; Manufactured after 06/15/1976
- Exterior features: Metal/vinyl exterior; Patio/porch/deck; Landscaped; Paved lot; Storage in back yard
Interior
- Kitchen: Dishwasher; Stove/Range; Walk-in pantry
- Bedrooms: 3 bedrooms
- Flooring: Vinyl flooring
- Bathrooms: 2 full bathrooms; 2 bathtubs; 2 showers; Jetted/soaking tub
- Heating & cooling: Baseboard heating; Forced air cooling; Electric energy source
- Interior features: Water heater; Electric fireplace
- Laundry & utility: Utility room; Washer/dryer location not specified
Neighborhood map
What this means for you Summary
Snapshot
- This is a 3-bed/2.0-bath manufactured listed at $135k.
Deal economics
- At list price, monthly cash flow is $1k ($16k/yr) — positive.
- The deal already cash-flows at list — no discount required.
- Meets the 1% rule at list price ($3k rent vs $135k).
- Recommended offer: $133k (1.5% below list) — sets the bar for market timing.
- Cap rate 17.8% vs local median 3.6% in Graham — top-decile yield for the area; either an underpriced asset or a hidden risk that comps aren't pricing in. Stress-test before assuming the spread holds.
Location & tenants
- Location reads 64/100 on livability (#373 in WA) — a middle-class / working-renter tenant base. Strengths: employment A+, housing A+; Watch: crime C-, health & safety C-, amenities F.
- Bethel School District (suburban): math 47% / reading 59% proficiency, ranked #103 of 291 in WA (top 35%) — acceptable for families but not a draw, mixed tenant base, ~2y average lease.
- Market conditions: Rents rising (+3.3%/yr); 232 active listings in the ZIP; high-income renter base; 3,209 units permitted in Pierce County in 2024 (1,269 in 5+ unit buildings).
Forward outlook
- Local home prices are declining (-3.0%/yr); year-one equity from $933 of loan paydown is wiped out by about $4k of value loss. Plan a longer hold.
- Pierce County population projected at +26% by 2050 — long-run rental-demand tailwind backs the buy-and-hold thesis.
- At projected returns (-3.0% appreciation + 3.3% rent growth), your $38k cash investment doubles in ~3 years — after that, you're playing with house money.
Negotiation context
- It's been on market 17 days — a 2% lower offer ($133k) is reasonable based on typical stale-listing flexibility.
Questions for the listing agent
- Is there a deadline driving the sale (1031 exchange, divorce, estate, relocation)? That informs how much negotiation room exists.
- What's the average days-on-market for RENTAL listings here right now (not sales)? A rising rental-DOM trend means longer vacancies and softer asking-rent achievability than the comps imply.
- What's the recent tenant-quality profile in this submarket — average credit score on applications, eviction rate, late-payment / NSF rate, and stable-employment percentage? A property-management company in the area should have these aggregated.
- How much new for-sale + rental construction is in the pipeline within 1–3 miles? Heavy new supply typically softens prices + rents 12–24 months out; constrained supply supports both.
Investment metrics
- 1% rule
- 2.00% ✓
- Cap rate
- 17.84%
- Cash-on-cash
- 41.23%
- DSCR
- 2.83
- GRM
- 4.2
CMA / ARV
- ARV (on-the-fly)
- $110,160
- Comps found
- 5
Show comp detail 5 sales within ~0.75 mi
| Address | Dist | Beds/Ba | Sqft | Sold | Price | $/sf | Match |
|---|---|---|---|---|---|---|---|
| 8805 226th Street Ct E #32 | 0.22mi | 2/2.0 (-1) | 1,080 (0%) | 7mo | $110,000 | $102 | 79 |
| 9117 232nd St E | 0.25mi | 2/1.0 (-1) | 1,070 (-1%) | 1mo | $280,000 | $262 | 77 |
| 8911 226th St E #18 | 0.17mi | 3/2.0 | 1,188 (+10%) | 18mo | $105,000 | $88 | 61 |
| 22716 91st Avenue Ct E #40 | 0.02mi | 3/2.0 | 1,232 (+14%) | 20mo | $120,000 | $97 | 59 |
| 8106 224th St E | 0.68mi | 3/2.0 | 1,056 (-2%) | 21mo | $605,000 | $573 | 47 |
Match score weights: distance 35% · size 25% · config 20% · recency 20%. Top-matched comps best support the ARV.
Projected returns pro-forma
-3.0% appreciation · 3.32% rent growth · sell at horizon
- IRR
- 38.1%
- Equity multiple
- 2.63×
- Total profit
- $61,689
- Equity at exit
- $20,129
- IRR
- 44.8%
- Equity multiple
- 5.33×
- Total profit
- $163,740
- Equity at exit
- $11,672
Cash invested: $37,800 (down + closing). Projections, not guarantees.
Landlord ↔ Tenant lean methodology
- Overall (STATE)
- 28 Tenant-Leaning
- State Washington
- 28 Tenant-Leaning · D+8
- County
- — inherits STATE
- City
- — inherits STATE
ZIP-level market 98338
- Rents YoY
- 3.3%
- Active inventory
- 232
- Price-to-rent
- 4.2×
Monthly cashflow live
- Estimated rent
- $2,698 medium interval (Pro) →
- Mortgage (P&I)
- −$708
- Tax from tax record
- −$68 /mo · $818/yr
- Insurance
- −$56
- HOA
- −$0
- Vacancy / Maint / Mgmt
- −$566
- Net cashflow
- $1,299
Break-even live
Sensitivity live
| Price | -10% $1,375 | -5% $1,337 | +0% $1,299 | +5% $1,260 | +10% $1,222 |
|---|---|---|---|---|---|
| Rent | -10% $1,086 | -5% $1,192 | +0% $1,299 | +5% $1,405 | +10% $1,512 |
| Rate | -1.0pp $1,367 | -0.5pp $1,333 | base $1,299 | +0.5pp $1,264 | +1.0pp $1,228 |
UW: 25.0% down · 7.5% · 30yr · 1.5% tax · 5.0% vac · 8.0% maint · 8.0% mgmt
Financing live
Cash to close
- Down payment
- $33,750
- Closing costs
- $4,050
- Reserves months
- —
- Total cash needed
- —
Loan-product check · same deal, 3 products live
Conventional
25% down · 7.5% · 30yr
- Down + closing
- —
- Monthly P&I
- —
- Monthly cashflow
- —
- DSCR
- —
- Eligible?
- —
Personal DTI + credit; lowest rate.
DSCR
20% down · 8.5% · 30yr
- Down + closing
- —
- Monthly P&I
- —
- Monthly cashflow
- —
- DSCR
- —
- Eligible?
- —
No personal income docs; deal must DSCR.
Hard money
10% down · 12.0% · 12mo
- Down + closing
- —
- Monthly P&I
- —
- Monthly cashflow
- —
- DSCR
- —
- Eligible?
- —
Short-term bridge; refi at stabilization.
Listing history 13 events
-
2026-06-18days on market $135,000 Active 17 DOM
-
2026-06-17days on market $135,000 Active 16 DOM
-
2026-06-16days on market $135,000 Active 15 DOM
-
2026-06-15days on market $135,000 Active 14 DOM
-
2026-06-13days on market $135,000 Active 12 DOM
-
2026-06-13days on market $135,000 Active 11 DOM
-
2026-06-09days on market $135,000 Active 8 DOM
-
2026-06-08days on market $135,000 Active 7 DOM
-
2026-06-07days on market $135,000 Active 6 DOM
-
2026-06-04days on market $135,000 Active 3 DOM
-
2026-06-03days on market $135,000 Active 2 DOM
-
2026-06-02remarks 699-char remark
-
2026-06-02$135,000 Active 1 DOM
ⓘ Source: listings_history table (triggers on properties + properties_extension) + one-shot
backfill from property_details.listing_events for pre-trigger history.
Tax reassessment forecast WA · Resets to sale price
- Current annual tax
- $818 · $68/mo
- Projected year-2 tax
- $1,323 · $110/mo
- Expected delta
- +$505/yr (+$42/mo · 61.7%)
ⓘ Screening estimate from a state-policy table — verify with the county assessor before closing.
Climate risk First Street
- Flood 3/10 Moderate FEMA zone X (unshaded) · 20% chance over 30 yrs
- Wildfire 1/10 Low
- Heat 3/10 Moderate 7 d/yr ≥87°F today · 15 d/yr by 30 yrs out
- Wind 1/10 Low
- Air quality 7/10 Severe 9 unhealthy d/yr today · 11 by 30 yrs out
Nearby sold comps map
Loading sold comps map…
Walkable amenities ~0.75 mi
Loading nearby amenities…
Taxation est. · year 1
- Rental income
- $32,371
- − Mortgage interest
- −$7,562
- − Property taxes
- −$818
- − Insurance
- −$675
- − Repairs & maintenance
- −$2,590
- − Management
- −$2,590
- − Depreciation
- −$3,927
- Taxable income
- $14,209
- Est. tax owed @ 24.0%
- −$3,410
- After-tax cash flow
- $12,174/yr
For passive investors: Depreciation is non-cash, so a rental often shows a tax loss while cash-flowing — sheltering income. Rental losses are passive: they offset passive income freely, and up to $25,000/yr can offset ordinary (W-2) income if you actively participate and your MAGI is under $100k (phasing out to $0 by $150k); unused losses carry forward. On sale, claimed depreciation is recaptured at up to 25%, and gains may owe capital-gains tax (a 1031 exchange can defer both). Figures are a year-1 estimate at your 24.0% rate — not tax advice; consult a CPA.
Schools (NCES district)
- District
- Bethel School District
- NCES district ID
- 5300480
- Math proficiency
- 47% ▬ 0.00%
- Reading proficiency
- 59% ▲ 2.00%
- Median HH income
- $65,872
- Composite
- 48.66/100
- National rank
- #4568
- State rank
- #103 of 291 in WA
Livability — Graham
- Score
- 64/100
- State rank
- #373
- US rank
- #14219
Category grades
Schools grade is shown separately in the Schools card above.
Census & demographics
- Census place
- Graham, WA
- County
- Pierce County · 788,257 people
- City population
- 32,687
- Metro
- Seattle-Tacoma-Bellevue, WA
- Population (ZIP)
- 32,687
- Household income
- $114,819
- Rent vs Own
- Severe rent burden
- 236.0
Population outlook (Pierce County) Hauer SSP2
- Today (2025)
- 956,648 people
- By 2030
- 1,010,862 · +5.7%
- By 2040
- 1,113,170 · +16.4%
- By 2050
- 1,206,524 · +26.1%
- By 2075
- 1,436,425 · +50.2%
- By 2100
- 1,563,654 · +63.5%
Race, ethnicity, and origin ACS 2023
- Neighborhood character
- Predominantly White (71%)
- Race & ethnicity
- White 71% Two or more races 15% Hispanic / Latino 12% Asian 3% Black 3% Pacific Islander 2% Native American 1%
- Hispanic origin (detail)
- Mexican 7%
- Common ancestry
- Italian 4% Portuguese 4% Iranian 3%
- Foreign-born
- 7% · Canada, South Korea, China
- Languages at home
- 88% English-only · Spanish 5% Russian/Polish/Slavic 2% Other Asian/Pacific 1%
Political lean MEDSL · Pierce
- 2024 margin
- D (+10.8) · D 53.9% · R 43.1% · Other 3.0%
- 2008→2024 swing
- -1.4pp toward R · 2008: 12.2pp · 2024: 10.8pp
- All cycles
- 2024: D+10.8 2020: D+11.2 2016: D+7.5 2012: D+11.0 2008: D+12.2
Not yet ingested
- Civics
- —
Market trends
- HPI YoY
- ▼ -501.28%
- Current HPI
- 304.4241
- Rent YoY
- ▲ 3.32%
- Metro
- Seattle-Tacoma-Bellevue, WA
- State GDP YoY
- ▲ 4.65%
- F500 in state
- 22
Industry mix (Fortune 500 HQ in WA)
| Industry | F500 HQs | Revenue |
|---|---|---|
| Retail | 2 | $269B |
|
||
| Technology / Retail | 1 | $638B |
|
||
| Technology | 1 | $245B |
|
||
| Telecommunications | 1 | $38B |
|
||
| Food / Beverage | 1 | $36B |
|
||
| Automotive / Trucks | 1 | $34B |
|
||
Price history
1 event — show timeline
- 2026-06-01 Listed $135,000 NWMLS as Distributed by MLS Grid
Property tax history
+10.9%/yrLatest (2026): $818 · +4.2% YoY. Source: county tax records.
Cash-flow waterfall
monthlySold comps — $/sqft
last 12 mo · ≤1 miLoading sold comps…