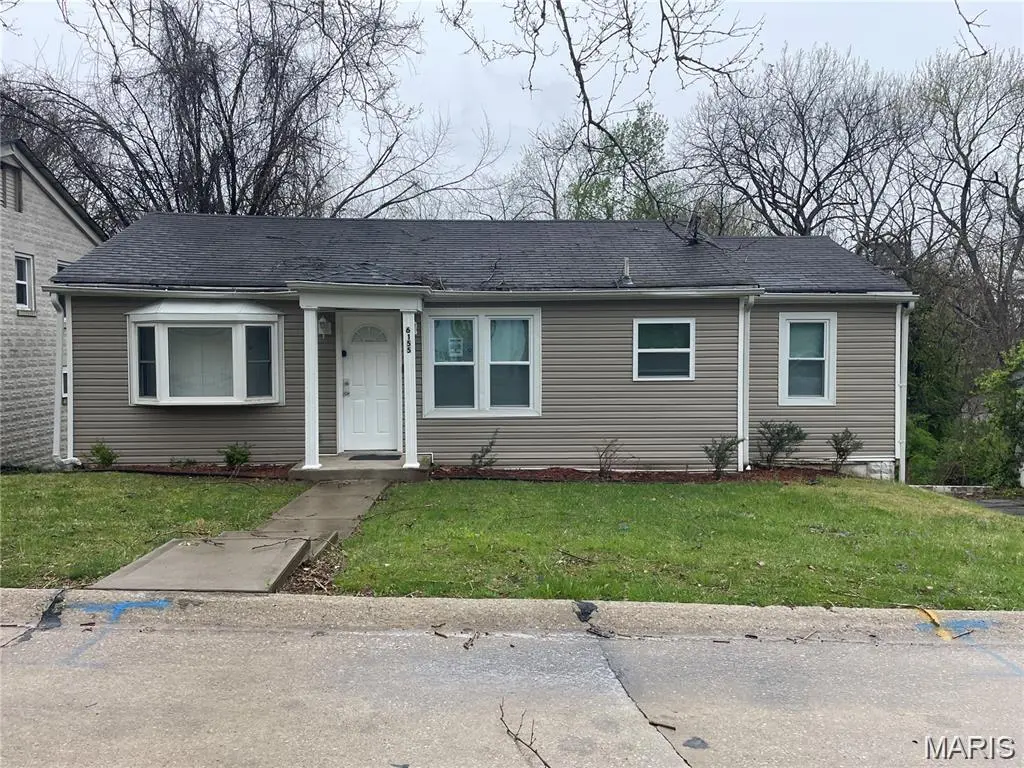
6155 Emerald Ave · Ferguson, MO
Flood risk 1/10 · Minimal
- FEMA flood zone
- X (unshaded)
- Chance of flooding over 30 yrs
- 0.0%
- Est. flood insurance / yr
- $473 – $860
Fire risk 1/10 · Minimal
- Est. fire insurance / yr
- $1,054 – $1,958
Heat risk 4/10 · Minor
- Hot days now (above 107°F)
- 7 days/yr
- Hot days in 30 yrs
- 19 days/yr
Wind risk 2/10 · Minimal
- Chance of severe wind over 30 yrs
- 1.0%
Air-quality risk 4/10 · Minor
- Unhealthy air days now
- 4 days/yr
- Unhealthy air days in 30 yrs
- 5 days/yr
Risk factors via First Street. Map © Google.
Why this score? — see what drove the C grade
The composite is a weighted blend of 9 inputs, each scored 0–100. Each bar is that input's sub-score; the figure is the points it added to the 100-point composite (weight × sub-score).
- Cash flow +30.0/30.0
- DSCR +10.0/10.0
- 1% rule +8.2/10.0
- Rent growth +4.8/5.0
- Livability +2.9/5.0
- Condition / age +2.5/5.0
- Schools +1.2/10.0
- ARV discount +0.0/15.0
- Appreciation +0.0/10.0
$95,000
🖨 Deal sheet (PDF) 📄 Offer letter ✓ Due diligence
Listing remarks MLS
Attention Investors – Turnkey Rental with Strong Returns! Don’t miss this excellent opportunity to add a cash-flowing property to your portfolio! This tenant-occupied home in Ferguson, MO is currently rented for $1,250/month, with a lease in place through June 2026. The tenant is in good standing, offering immediate and reliable income.This updated 3-bedroom, 2-bath home with a full basement features quality upgrades throughout, including neutral paint, modern fixtures, and energy-efficient appliances. The spacious living area and open kitchen create a warm and functional layout, ideal for long-term tenancy. Step outside to a large backyard and deck—perfect for relaxing, entertaining, or enjoying the quiet neighborhood vibe. Whether you're a seasoned investor or just getting started, this property offers both stability and potential for future appreciation. Showings available with an written & acceptable contract only. Secure this income-producing asset before it’s gone!
Key facts
- Large backyard
- Full basement
- Turnkey rental
Tags
Neighborhood map
What this means for you Summary
Snapshot
- This is a 2-bed/2.0-bath single-family listed at $95k.
Deal economics
- At list price, monthly cash flow is $379 ($5k/yr) — positive.
- The deal already cash-flows at list — no discount required.
- Meets the 1% rule at list price ($1k rent vs $95k).
- Recommended offer: $89k (6.0% below list) — sets the bar for market timing.
- Cap rate 11.1% vs local median 9.2% in Ferguson — meaningfully above typical; check what's discounted (condition, days-on-market, listing class) to confirm the premium yield is real.
Location & tenants
- Location reads 58/100 on livability (#586 in MO) — a working-class tenant base; expect higher turnover. Strengths: cost of living A+, housing B+; Watch: health & safety C-, schools F, crime F.
- Ferguson-Florissant R-II (suburban): math 7% / reading 20% proficiency, ranked #311 of 324 in MO (top 96%) — low school quality limits family demand, transient renter base, plan for 1-2y turnover; 70% free/reduced lunch — lower-income household profile, screen leases tightly.
- Market conditions: Rents rising fast (+9.0%/yr); 162 active listings in the ZIP; 40 comparable units currently listed for rent nearby; rentals at typical pace (median 25d on market — plan ~3-4 weeks tenant-placement turnaround); 48% of comp listings sitting > 30 days — soft ceiling on asking rent; 920 units permitted in St. Louis County in 2024 (250 in 5+ unit buildings).
Forward outlook
- Local home prices are declining (-3.0%/yr); year-one equity from $657 of loan paydown is wiped out by about $3k of value loss. Plan a longer hold.
- At projected returns (-3.0% appreciation + 8.0% rent growth), your $27k cash investment doubles in ~6 years — after that, you're playing with house money.
Negotiation context
- It's been on market 77 days — a 6% lower offer ($89k) is reasonable based on typical stale-listing flexibility.
- 6 sale attempts since 2y ago; this cycle's ask has dropped $20k (17%) from the opening price — seller is motivated, your offer sets the floor, not the list.
- Current owner paid $8k; list at $95k implies a 1088% gain — meaningful room to come down on a strong offer.
Risks & watch-outs
- Watch-outs: built in 1941 — expect roof / HVAC / electrical / plumbing capex.
Questions for the listing agent
- It's been on market 77 days. Have you received any prior offers? Is the seller open to a 6% concession, seller financing, or rate buy-down credit?
- Built in 1941 — when were the roof, HVAC, electrical panel, plumbing, and water heater last replaced?
- Why hasn't it sold? Are there any deal-killer items the seller is aware of (foundation, flood, title, zoning, code violations)?
- Is there a deadline driving the sale (1031 exchange, divorce, estate, relocation)? That informs how much negotiation room exists.
- Schools are F-rated, which usually means shorter tenancies and higher turnover. Who's the typical renter profile here, and what's been the actual vacancy rate?
- Crime grade is F in this area — have there been break-ins, vandalism, or insurance claims at this property in the last 3 years? What carrier currently insures it and at what premium?
- What's the average days-on-market for RENTAL listings here right now (not sales)? A rising rental-DOM trend means longer vacancies and softer asking-rent achievability than the comps imply.
- What's the recent tenant-quality profile in this submarket — average credit score on applications, eviction rate, late-payment / NSF rate, and stable-employment percentage? A property-management company in the area should have these aggregated.
- How much new for-sale + rental construction is in the pipeline within 1–3 miles? Heavy new supply typically softens prices + rents 12–24 months out; constrained supply supports both.
Investment metrics
- 1% rule
- 1.32% ✓
- Cap rate
- 11.08%
- Cash-on-cash
- 17.09%
- DSCR
- 1.76
- GRM
- 6.3
CMA / ARV
- ARV (median comp)
- $75,424
- List price
- $95,000
- Delta
- 25.95%
- Verdict
- OVERPRICED
- Comps
- 20 within 1.0 mi
Show comp detail 12 sales within ~0.75 mi
| Address | Dist | Beds/Ba | Sqft | Sold | Price | $/sf | Match |
|---|---|---|---|---|---|---|---|
| 6188 Dupree Ave | 0.10mi | 3/1.5 (+1) | 972 (+7%) | 4mo | $75,000 | $77 | 72 |
| 247 S Hartnett Ave Unit 1/2 | 0.60mi | 2/1.0 | 902 (-0%) | 2mo | $75,000 | $83 | 66 |
| 6016 Dupree Ave | 0.19mi | 2/1.0 | 1,020 (+13%) | 3mo | $34,900 | $34 | 64 |
| 721 Beardsley Ct | 0.32mi | 2/1.0 | 820 (-10%) | 4mo | $89,900 | $110 | 62 |
| 299 Dashwood Dr | 0.53mi | 3/2.0 (+1) | 960 (+6%) | 4mo | $114,000 | $119 | 57 |
| 296 Meadowcrest Dr | 0.50mi | 3/1.0 (+1) | 960 (+6%) | 2mo | $109,900 | $114 | 56 |
| 30 Paul Ave | 0.56mi | 3/1.0 (+1) | 875 (-3%) | 5mo | $69,900 | $80 | 55 |
| 277 Dashwood Dr | 0.58mi | 3/1.0 (+1) | 960 (+6%) | 2mo | $74,900 | $78 | 52 |
| 120 Bernhardt Ave | 0.70mi | 2/2.0 | 1,002 (+11%) | 1mo | $74,900 | $75 | 49 |
| 227 Meadowcrest Dr | 0.66mi | 3/1.0 (+1) | 960 (+6%) | 3mo | $129,900 | $135 | 48 |
| 5633 Parchester Dr | 0.70mi | 3/1.0 (+1) | 864 (-5%) | 7mo | $79,900 | $92 | 45 |
| 914 Highmont Dr | 0.73mi | 2/1.0 | 816 (-10%) | 2mo | $92,400 | $113 | 44 |
Match score weights: distance 35% · size 25% · config 20% · recency 20%. Top-matched comps best support the ARV.
Projected returns pro-forma
-3.0% appreciation · 8.0% rent growth · sell at horizon
- IRR
- 13.7%
- Equity multiple
- 1.58×
- Total profit
- $15,359
- Equity at exit
- $14,165
- IRR
- 25.9%
- Equity multiple
- 3.80×
- Total profit
- $74,601
- Equity at exit
- $8,214
Cash invested: $26,600 (down + closing). Projections, not guarantees.
Landlord ↔ Tenant lean methodology
- Overall (STATE)
- 81 Strongly Landlord-Friendly
- State Missouri
- 81 Strongly Landlord-Friendly · R+10
- County
- — inherits STATE
- City
- — inherits STATE
ZIP-level market 63135
- Rents YoY
- 9.0%
- Active inventory
- 162
- Price-to-rent
- 6.3×
Monthly cashflow live
- Estimated rent
- $1,255 high interval (Pro) →
- Mortgage (P&I)
- −$498
- Tax from tax record
- −$75 /mo · $900/yr
- Insurance
- −$40
- HOA
- −$0
- Vacancy / Maint / Mgmt
- −$264
- Net cashflow
- $379
Break-even live
Sensitivity live
| Price | -10% $433 | -5% $406 | +0% $379 | +5% $352 | +10% $325 |
|---|---|---|---|---|---|
| Rent | -10% $280 | -5% $329 | +0% $379 | +5% $428 | +10% $478 |
| Rate | -1.0pp $427 | -0.5pp $403 | base $379 | +0.5pp $354 | +1.0pp $329 |
UW: 25.0% down · 7.5% · 30yr · 1.5% tax · 5.0% vac · 8.0% maint · 8.0% mgmt
Financing live
Cash to close
- Down payment
- $23,750
- Closing costs
- $2,850
- Reserves months
- —
- Total cash needed
- —
Loan-product check · same deal, 3 products live
Conventional
25% down · 7.5% · 30yr
- Down + closing
- —
- Monthly P&I
- —
- Monthly cashflow
- —
- DSCR
- —
- Eligible?
- —
Personal DTI + credit; lowest rate.
DSCR
20% down · 8.5% · 30yr
- Down + closing
- —
- Monthly P&I
- —
- Monthly cashflow
- —
- DSCR
- —
- Eligible?
- —
No personal income docs; deal must DSCR.
Hard money
10% down · 12.0% · 12mo
- Down + closing
- —
- Monthly P&I
- —
- Monthly cashflow
- —
- DSCR
- —
- Eligible?
- —
Short-term bridge; refi at stabilization.
Rent comps 40 comps
| Address | Beds | Baths | Sqft | Rent | $/sqft | DOM | Units | Dist |
|---|---|---|---|---|---|---|---|---|
| 6180 Emerald Ave Saint Louis, MO | 2.0 | 1.0 | 729 | $1,300 | $1.78 | 44d | 1 | 0.07mi |
| 6188 Dupree Ave Saint Louis, MO | 3.0 | 1.5 | 972 | $1,300 | $1.34 | 44d | 1 | 0.09mi |
| 7733 Brand Ave Saint Louis, MO | 2.0 | 1.0 | 656 | $1,090 | $1.66 | 24d | 1 | 0.24mi |
| 26 Arbor Village Ct Ferguson, MO | 1.0–2.0 | 1.0 | 714 | $950 | $1.33 | 24d | 1 | 0.45mi |
| 5900 Sheriton Dr Saint Louis, MO | 3.0 | 1.0 | 864 | $1,050 | $1.22 | 24d | 1 | 0.45mi |
| 5830 Bermuda Dr Unit 30B St. Louis, MO | 2.0 | 1.0 | 900 | $895 | $0.99 | 24d | 1 | 0.47mi |
| 5830 Bermuda Dr Unit 34C St. Louis, MO | 2.0 | 1.0 | 850 | $895 | $1.05 | 44d | 1 | 0.47mi |
| 5925 Brand Ave Saint Louis, MO | 3.0 | 1.0 | 951 | $1,200 | $1.26 | 44d | 1 | 0.47mi |
| 296 Meadowcrest Dr Saint Louis, MO | 3.0 | 1.0 | 960 | $1,550 | $1.61 | 15d | 1 | 0.49mi |
| 12 Lee Ave Saint Louis, MO | 2.0 | 1.0 | 832 | $1,080 | $1.30 | 8d | 1 | 0.53mi |
| 110 Paul Ave Saint Louis, MO | 3.0 | 1.0 | 875 | $1,050 | $1.20 | 8d | 1 | 0.55mi |
| 249 S Hartnett Ave Saint Louis, MO | 3.0 | 1.0 | 960 | $1,220 | $1.27 | 24d | 1 | 0.57mi |
| 7816 Dartmoor Dr Saint Louis, MO | 3.0 | 1.0 | 950 | $1,195 | $1.26 | 44d | 1 | 0.58mi |
| 617 Tesmore Pl Saint Louis, MO | 2.0 | 1.0 | 877 | $1,200 | $1.37 | 44d | 1 | 0.59mi |
| 227 Meadowcrest Dr Saint Louis, MO | 3.0 | 1.0 | 960 | $1,500 | $1.56 | 44d | 1 | 0.65mi |
| 419 S Florissant Rd Ferguson, MO | 2.0 | 1.0 | 1100 | $1,200 | $1.09 | 44d | 1 | 0.67mi |
| 945 Edgehill Dr Saint Louis, MO | 3.0 | 1.0 | 1110 | $1,575 | $1.42 | 44d | 1 | 0.69mi |
| 204 Hawkesbury Dr Saint Louis, MO | 2.0 | 1.0 | 849 | $1,250 | $1.47 | 5d | 1 | 0.70mi |
| 223 Wiegel Dr Saint Louis, MO | 3.0 | 1.0 | 864 | $1,560 | $1.81 | 13d | 1 | 0.72mi |
| 801 Thomas Ave Saint Louis, MO | 3.0 | 1.0 | 864 | $1,350 | $1.56 | 44d | 1 | 0.79mi |
| 222 Randolph Ave Saint Louis, MO | 2.0 | 1.0 | 964 | $1,400 | $1.45 | 8d | 1 | 0.82mi |
| 104 Fenwick Dr Saint Louis, MO | 3.0 | 1.0 | 960 | $1,250 | $1.30 | 24d | 1 | 0.90mi |
| 246 Louisa Ave Saint Louis, MO | 3.0 | 1.0 | 1036 | $1,600 | $1.54 | 44d | 1 | 0.91mi |
| 806 Marvin Ave Saint Louis, MO | 2.0 | 1.0 | 726 | $1,100 | $1.52 | 44d | 1 | 0.94mi |
| 5300 Grove Ave Saint Louis, MO | 3.0 | 1.0 | 840 | $1,295 | $1.54 | 24d | 1 | 1.02mi |
| 8408 Hill Ave Saint Louis, MO | 3.0 | 2.0 | 1040 | $1,550 | $1.49 | 24d | 1 | 1.02mi |
| 1550 Northwinds Estates Dr St. Louis, MO | 1.0–2.0 | 1.0–1.5 | 877 | $1,050 | $1.20 | 44d | 1 | 1.04mi |
| 360 S Harvey Ave Saint Louis, MO | 2.0 | 1.0 | 936 | $925 | $0.99 | 44d | 1 | 1.09mi |
| 9717 Dennis Dr Saint Louis, MO | 3.0 | 1.0 | 1056 | $1,323 | $1.25 | 44d | 1 | 1.15mi |
| 519 Graf Ave Saint Louis, MO | 3.0 | 2.0 | 887 | $1,297 | $1.46 | 21d | 1 | 1.15mi |
| 709 Suburban Ave Saint Louis, MO | 2.0 | 1.0 | 975 | $1,400 | $1.44 | 44d | 1 | 1.16mi |
| 307 Coppinger Dr Saint Louis, MO | 3.0 | 1.0 | 960 | $1,095 | $1.14 | 18d | 1 | 1.19mi |
| 7516 Chandler Ave Saint Louis, MO | 1.0 | 1.0 | 728 | $1,000 | $1.37 | 44d | 1 | 1.20mi |
| 450 S Dade Ave Saint Louis, MO | 2.0 | 1.0 | 1040 | $1,200 | $1.15 | 24d | 1 | 1.22mi |
| 5600 Gatesworth Ave Saint Louis, MO | 2.0 | 1.0 | 672 | $1,095 | $1.63 | 5d | 1 | 1.24mi |
| 338 La Motte Ln Saint Louis, MO | 2.0 | 1.0 | 904 | $1,150 | $1.27 | 44d | 1 | 1.27mi |
| 422 Plaza Ave Saint Louis, MO | 3.0 | 1.0 | 792 | $1,000 | $1.26 | 8d | 1 | 1.28mi |
| 401 Millman Dr Saint Louis, MO | 3.0 | 1.0 | 1008 | $1,450 | $1.44 | 17d | 1 | 1.28mi |
| 415 Ames Pl Saint Louis, MO | 3.0 | 1.0 | 816 | $1,400 | $1.72 | 44d | 1 | 1.29mi |
| 7441 Calvin Ave Saint Louis, MO | 3.0 | 1.0 | 1068 | $1,350 | $1.26 | 13d | 1 | 1.31mi |
Listing history 38 events
-
2026-06-18days on market $95,000 Active 77 DOM
-
2026-06-17days on market $95,000 Active 76 DOM
-
2026-06-16days on market $95,000 Active 75 DOM
-
2026-06-15price $95,000 Active 74 DOM
-
2026-06-15days on market $100,000 Active 74 DOM
-
2026-06-13days on market $100,000 Active 72 DOM
-
2026-06-13days on market $100,000 Active 71 DOM
-
2026-06-09days on market $100,000 Active 68 DOM
-
2026-06-08days on market $100,000 Active 67 DOM
-
2026-06-07days on market $100,000 Active 66 DOM
-
2026-06-05days on market $100,000 Active 63 DOM
-
2026-06-03days on market $100,000 Active 62 DOM
-
2026-06-02days on market $100,000 Active 61 DOM
-
2026-06-01days on market $100,000 Active 60 DOM
-
2026-06-01price $100,000 Active 59 DOM
-
2026-05-31days on market $105,000 Active 59 DOM
-
2026-05-19price $105,000 1013-char remark
Show marketing remark (1013 chars)
Attention Investors – Turnkey Rental with Strong Returns! Don’t miss this excellent opportunity to add a cash-flowing property to your portfolio! This tenant-occupied home in Ferguson, MO is currently rented for $1,250/month, with a lease in place through June 2026. The tenant is in good standing, offering immediate and reliable income.This updated 3-bedroom, 2-bath home with a full basement features quality upgrades throughout, including neutral paint, modern fixtures, and energy-efficient appliances. The spacious living area and open kitchen create a warm and functional layout, ideal for long-term tenancy. Step outside to a large backyard and deck—perfect for relaxing, entertaining, or enjoying the quiet neighborhood vibe. Whether you're a seasoned investor or just getting started, this property offers both stability and potential for future appreciation. Showings available with an written & acceptable contract only. Secure this income-producing asset before it’s gone!
-
2026-04-26price $110,000 1013-char remark
Show marketing remark (1013 chars)
Attention Investors – Turnkey Rental with Strong Returns! Don’t miss this excellent opportunity to add a cash-flowing property to your portfolio! This tenant-occupied home in Ferguson, MO is currently rented for $1,250/month, with a lease in place through June 2026. The tenant is in good standing, offering immediate and reliable income.This updated 3-bedroom, 2-bath home with a full basement features quality upgrades throughout, including neutral paint, modern fixtures, and energy-efficient appliances. The spacious living area and open kitchen create a warm and functional layout, ideal for long-term tenancy. Step outside to a large backyard and deck—perfect for relaxing, entertaining, or enjoying the quiet neighborhood vibe. Whether you're a seasoned investor or just getting started, this property offers both stability and potential for future appreciation. Showings available with an written & acceptable contract only. Secure this income-producing asset before it’s gone!
-
2026-04-02$115,000 Active 1013-char remark
Show marketing remark (1013 chars)
Attention Investors – Turnkey Rental with Strong Returns! Don’t miss this excellent opportunity to add a cash-flowing property to your portfolio! This tenant-occupied home in Ferguson, MO is currently rented for $1,250/month, with a lease in place through June 2026. The tenant is in good standing, offering immediate and reliable income.This updated 3-bedroom, 2-bath home with a full basement features quality upgrades throughout, including neutral paint, modern fixtures, and energy-efficient appliances. The spacious living area and open kitchen create a warm and functional layout, ideal for long-term tenancy. Step outside to a large backyard and deck—perfect for relaxing, entertaining, or enjoying the quiet neighborhood vibe. Whether you're a seasoned investor or just getting started, this property offers both stability and potential for future appreciation. Showings available with an written & acceptable contract only. Secure this income-producing asset before it’s gone!
-
2025-11-12price $107,000
-
2025-10-18price $110,000
-
2025-10-08status Active
-
2025-09-29price $112,000
-
2025-08-26price $115,000
-
2025-08-06status Active
-
2025-07-31status Pending
-
2025-07-08price $120,000
-
2025-06-13$125,000 Active
-
2024-10-31historical
-
2024-10-14price $135,000
-
2024-09-20$140,000 Active
-
2024-08-08historical
-
2024-07-23price $120,000
-
2024-07-09price $125,000
-
2024-06-10$130,000 Active
-
2023-11-28historical
-
2023-11-20historical
-
2014-03-31soldstatus $8,000
ⓘ Source: listings_history table (triggers on properties + properties_extension) + one-shot
backfill from property_details.listing_events for pre-trigger history.
Tax reassessment forecast MO · Resets to sale price
- Current annual tax
- $900 · $75/mo
- Projected year-2 tax
- $922 · $77/mo
- Expected delta
- +$21/yr (+$2/mo · 2.4%)
ⓘ Screening estimate from a state-policy table — verify with the county assessor before closing.
Climate risk First Street
- Flood 1/10 Low FEMA zone X (unshaded) · 0% chance over 30 yrs
- Wildfire 1/10 Low
- Heat 4/10 Moderate 7 d/yr ≥107°F today · 19 d/yr by 30 yrs out
- Wind 2/10 Low 100% chance of damaging wind over 30 yrs
- Air quality 4/10 Moderate 4 unhealthy d/yr today · 5 by 30 yrs out
Nearby sold comps map
Loading sold comps map…
Walkable amenities ~0.75 mi
Loading nearby amenities…
Taxation est. · year 1
- Rental income
- $15,063
- − Mortgage interest
- −$5,321
- − Property taxes
- −$900
- − Insurance
- −$475
- − Repairs & maintenance
- −$1,205
- − Management
- −$1,205
- − Depreciation
- −$2,764
- Taxable income
- $3,192
- Est. tax owed @ 24.0%
- −$766
- After-tax cash flow
- $3,780/yr
For passive investors: Depreciation is non-cash, so a rental often shows a tax loss while cash-flowing — sheltering income. Rental losses are passive: they offset passive income freely, and up to $25,000/yr can offset ordinary (W-2) income if you actively participate and your MAGI is under $100k (phasing out to $0 by $150k); unused losses carry forward. On sale, claimed depreciation is recaptured at up to 25%, and gains may owe capital-gains tax (a 1031 exchange can defer both). Figures are a year-1 estimate at your 24.0% rate — not tax advice; consult a CPA.
Schools (NCES district)
- District
- Ferguson-Florissant R-II
- NCES district ID
- 2912010
- Math proficiency
- 7% ▼ -9.00%
- Reading proficiency
- 20% ▼ -6.00%
- Median HH income
- $44,610
- Composite
- 11.96/100
- National rank
- #9666
- State rank
- #311 of 324 in MO
Livability — Ferguson
- Score
- 58/100
- State rank
- #586
- US rank
- #20809
Category grades
Schools grade is shown separately in the Schools card above.
Census & demographics
- Census place
- Ferguson, MO
- County
- Saint Louis County · 888,823 people
- City population
- 18,381
- Metro
- St. Louis, MO-IL
- Population (ZIP)
- 18,381
- Household income
- $52,328
- Rent vs Own
- Severe rent burden
- 957.0
Population outlook (St. Louis County) Hauer SSP2
- Today (2025)
- 1,025,227 people
- By 2030
- 1,028,023 · +0.3%
- By 2040
- 1,020,940 · -0.4%
- By 2050
- 1,007,280 · -1.8%
- By 2075
- 987,277 · -3.7%
- By 2100
- 921,984 · -10.1%
Race, ethnicity, and origin ACS 2023
- Neighborhood character
- Predominantly Black (66%)
- Race & ethnicity
- Black 66% White 28% Two or more races 3% Hispanic / Latino 2%
- Common ancestry
- Lithuanian 1% Iranian 1% Romanian 1%
- Foreign-born
- 1% · Canada
- Languages at home
- 95% English-only · Spanish 4%
Political lean MEDSL · St. Louis
- 2024 margin
- Strong D (+23.4) · D 60.8% · R 37.4% · Other 1.7%
- 2008→2024 swing
- +3.5pp toward D · 2008: 19.9pp · 2024: 23.4pp
- All cycles
- 2024: D+23.4 2020: D+24.0 2016: D+16.2 2012: D+13.7 2008: D+19.9
Not yet ingested
- Civics
- —
Market trends
- HPI YoY
- ▼ -152.56%
- Current HPI
- 138.6781
- Rent YoY
- ▲ 9.03%
- Metro
- St. Louis, MO-IL
- State GDP YoY
- ▲ 1.84%
- F500 in state
- 20
Industry mix (Fortune 500 HQ in MO)
| Industry | F500 HQs | Revenue |
|---|---|---|
| Healthcare | 1 | $163B |
|
||
| Insurance | 1 | $21B |
|
||
| Industrial Technology | 1 | $17B |
|
||
| Retail | 1 | $16B |
|
||
| Industrial Distribution | 1 | $10B |
|
||
| Utilities | 1 | $9B |
|
||
Price history
+1212.5% since first listed22 events — show timeline
- 2026-05-19 Price Changed $105,000 MARIS as Distributed by MLS Grid
- 2026-04-26 Price Changed $110,000 MARIS as Distributed by MLS Grid
- 2026-04-02 Listed $115,000 MARIS as Distributed by MLS Grid
- 2025-11-12 Price Changed $107,000 MARIS as Distributed by MLS Grid
- 2025-10-18 Price Changed $110,000 MARIS as Distributed by MLS Grid
- 2025-10-08 Relisted — MARIS as Distributed by MLS Grid
- 2025-09-29 Price Changed $112,000 MARIS as Distributed by MLS Grid
- 2025-08-26 Price Changed $115,000 MARIS as Distributed by MLS Grid
- 2025-08-06 Relisted — MARIS as Distributed by MLS Grid
- 2025-07-31 Pending — MARIS as Distributed by MLS Grid
- 2025-07-08 Price Changed $120,000 MARIS as Distributed by MLS Grid
- 2025-06-13 Listed $125,000 MARIS as Distributed by MLS Grid
- 2024-10-31 Delisted — MARIS as Distributed by MLS Grid
- 2024-10-14 Price Changed $135,000 MARIS as Distributed by MLS Grid
- 2024-09-20 Listed $140,000 MARIS as Distributed by MLS Grid
- 2024-08-08 Delisted — MARIS as Distributed by MLS Grid
- 2024-07-23 Price Changed $120,000 MARIS as Distributed by MLS Grid
- 2024-07-09 Price Changed $125,000 MARIS as Distributed by MLS Grid
- 2024-06-10 Listed $130,000 MARIS as Distributed by MLS Grid
- 2023-11-28 Delisted — MARIS as Distributed by MLS Grid
- 2023-11-20 Coming Soon — MARIS as Distributed by MLS Grid
- 2014-03-31 Sold (Public Records) $8,000 Public Records
Property tax history
-2.7%/yrLatest (2022): $900 · +3.3% YoY. Source: county tax records.
Cash-flow waterfall
monthlySold comps — $/sqft
last 12 mo · ≤1 miLoading sold comps…