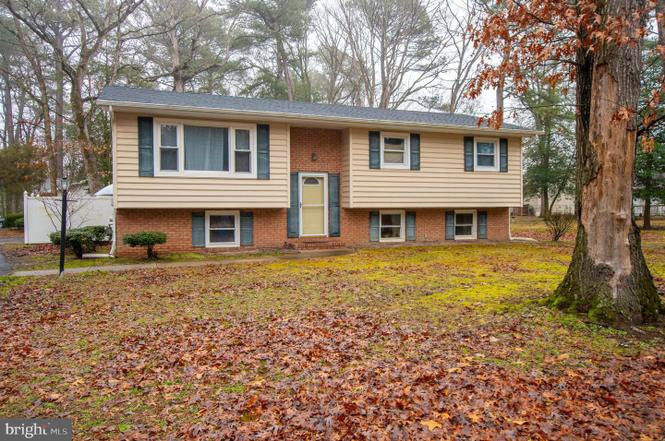
8331 Avalon Blvd · Salisbury, MD
Flood risk 1/10 · Minimal
- FEMA flood zone
- X (unshaded)
- Chance of flooding over 30 yrs
- 0.0%
- Est. flood insurance / yr
- $473 – $860
Fire risk 3/10 · Minor
- Est. fire insurance / yr
- $755 – $1,403
Heat risk 8/10 · Major
- Hot days now (above 106°F)
- 7 days/yr
- Hot days in 30 yrs
- 16 days/yr
Wind risk 8/10 · Major
- Chance of severe wind over 30 yrs
- 80.0%
Air-quality risk 2/10 · Minimal
- Unhealthy air days now
- 1 days/yr
- Unhealthy air days in 30 yrs
- 2 days/yr
Risk factors via First Street. Map © Google.
Why this score? — see what drove the C grade
The composite is a weighted blend of 9 inputs, each scored 0–100. Each bar is that input's sub-score; the figure is the points it added to the 100-point composite (weight × sub-score).
- Cash flow +23.0/30.0
- ARV discount +10.2/15.0
- DSCR +7.4/10.0
- 1% rule +5.2/10.0
- Rent growth +3.4/5.0
- Livability +3.0/5.0
- Condition / age +2.5/5.0
- Schools +1.9/10.0
- Appreciation +0.0/10.0
$240,000
🖨 Deal sheet 📄 Offer letter ✓ Due diligence
Listing remarks MLS
This home is ready for someone to come in and remodel entire inside the way you want it. On first floor there are 2 bedrooms, kitchen, Dining Room, & Living room. On the first floor there was 2 bedrooms, large room, utility room. Home has a brand new French drained installed on first floor. Home has a paved driveway and a fence in back yard with deck. See attachment for PAS requirements and WFHM offer submittal information in MLS document section.
Key facts
- New well
- Mini-split systems
- Walk-in shower
Tags
Neighborhood map
What this means for you Summary
Snapshot
- This is a 5-bed/2.0-bath single-family listed at $240k.
Deal economics
- At list price, monthly cash flow is $427 ($5k/yr) — positive.
- The deal already cash-flows at list — no discount required.
- Meets the 1% rule at list price ($2k rent vs $240k).
- Recommended offer: $236k (1.5% below list) — sets the bar for market timing.
- Cap rate 8.4% vs local median 4.8% in Salisbury — top-decile yield for the area; either an underpriced asset or a hidden risk that comps aren't pricing in. Stress-test before assuming the spread holds.
Location & tenants
- Location reads 60/100 on livability (#351 in MD) — a middle-class / working-renter tenant base. Strengths: health & safety A+, cost of living A, housing A; Watch: schools D-, crime F, amenities F.
- Wicomico County Public Schools (urban): math 16% / reading 26% proficiency, ranked #19 of 24 in MD (top 79%) — low school quality limits family demand, transient renter base, plan for 1-2y turnover.
- Market conditions: Rents rising (+3.8%/yr); 195 active listings in the ZIP; 3 comparable units currently listed for rent nearby; rentals leasing fast (median 14d on market — plan ~1-2 weeks tenant-placement turnaround); 278 units permitted in Wicomico County in 2024 (44 in 5+ unit buildings).
- This rent runs 40% of the median local income ($73k/yr) — at the standard rent-burdened threshold; future hikes will face affordability resistance.
Forward outlook
- Local home prices are declining (-3.0%/yr); year-one equity from $2k of loan paydown is wiped out by about $7k of value loss. Plan a longer hold.
- Wicomico County population projected at +14% by 2050 — modest demand growth; plan on rents tracking national, not racing it.
Negotiation context
- It's been on market 29 days — a 2% lower offer ($236k) is reasonable based on typical stale-listing flexibility.
- 7 sale attempts since 22y ago; this cycle's ask has dropped $20k (8%) from the opening price — seller is motivated, your offer sets the floor, not the list.
- Current owner paid $85k; list at $240k implies a 183% gain — meaningful room to come down on a strong offer.
Risks & watch-outs
- Climate carrying-cost: severe wind risk, 80% chance of damaging wind over 30y; extreme-heat days projected 7→16/yr by 2055 (HVAC capex compounding) — expect insurance premiums to compound above CPI over the hold.
Questions for the listing agent
- Built in 1972 — when were the roof, HVAC, electrical panel, plumbing, and water heater last replaced?
- Is there a deadline driving the sale (1031 exchange, divorce, estate, relocation)? That informs how much negotiation room exists.
- Schools are D-rated, which usually means shorter tenancies and higher turnover. Who's the typical renter profile here, and what's been the actual vacancy rate?
- Crime grade is F in this area — have there been break-ins, vandalism, or insurance claims at this property in the last 3 years? What carrier currently insures it and at what premium?
- What's the average days-on-market for RENTAL listings here right now (not sales)? A rising rental-DOM trend means longer vacancies and softer asking-rent achievability than the comps imply.
- What's the recent tenant-quality profile in this submarket — average credit score on applications, eviction rate, late-payment / NSF rate, and stable-employment percentage? A property-management company in the area should have these aggregated.
- How much new for-sale + rental construction is in the pipeline within 1–3 miles? Heavy new supply typically softens prices + rents 12–24 months out; constrained supply supports both.
Investment metrics
- 1% rule
- 1.02% ✓
- Cap rate
- 8.43%
- Cash-on-cash
- 7.63%
- DSCR
- 1.34
- GRM
- 8.2
CMA / ARV
- ARV (on-the-fly)
- $255,397
- Comps found
- 1
Show comp detail 1 sale within ~0.75 mi
| Address | Dist | Beds/Ba | Sqft | Sold | Price | $/sf | Match |
|---|---|---|---|---|---|---|---|
| 8388 Hilda Dr | 0.17mi | 4/1.5 (-1) | 2,200 (+9%) | 10mo | $280,000 | $127 | 62 |
Match score weights: distance 35% · size 25% · config 20% · recency 20%. Top-matched comps best support the ARV.
Projected returns pro-forma
-3.0% appreciation · 3.78% rent growth · sell at horizon
- IRR
- -3.9%
- Equity multiple
- 0.85×
- Total profit
- $-9,804
- Equity at exit
- $35,785
- IRR
- 6.6%
- Equity multiple
- 1.51×
- Total profit
- $34,307
- Equity at exit
- $20,751
Cash invested: $67,200 (down + closing). Projections, not guarantees.
Landlord ↔ Tenant lean methodology
- Overall (STATE)
- 27 Tenant-Leaning
- State Maryland
- 27 Tenant-Leaning · D+14
- County
- — inherits STATE
- City
- — inherits STATE
ZIP-level market 21804
- Home prices YoY
- -26.7%
- Rents YoY
- 3.8%
- Active inventory
- 195
- Price-to-rent
- 8.2×
Monthly cashflow live
- Estimated rent
- $2,439 medium interval (Pro) →
- Mortgage (P&I)
- −$1,259
- Tax from tax record
- −$141 /mo · $1,693/yr
- Insurance
- −$100
- HOA
- −$0
- Vacancy / Maint / Mgmt
- −$512
- Net cashflow
- $427
Break-even live
UW: 25.0% down · 7.5% · 30yr · 1.5% tax · 5.0% vac · 8.0% maint · 8.0% mgmt
Financing live
Cash to close
- Down payment
- $60,000
- Closing costs
- $7,200
- Reserves months
- —
- Total cash needed
- —
Loan-product check · same deal, 3 products live
Conventional
25% down · 7.5% · 30yr
- Down + closing
- —
- Monthly P&I
- —
- Monthly cashflow
- —
- DSCR
- —
- Eligible?
- —
Personal DTI + credit; lowest rate.
DSCR
20% down · 8.5% · 30yr
- Down + closing
- —
- Monthly P&I
- —
- Monthly cashflow
- —
- DSCR
- —
- Eligible?
- —
No personal income docs; deal must DSCR.
Hard money
10% down · 12.0% · 12mo
- Down + closing
- —
- Monthly P&I
- —
- Monthly cashflow
- —
- DSCR
- —
- Eligible?
- —
Short-term bridge; refi at stabilization.
Rent comps 3 comps
| Address | Beds | Baths | Sqft | Rent | $/sqft | DOM | Units | Dist |
|---|---|---|---|---|---|---|---|---|
| 8241 Robin Hood Dr Salisbury, MD | 4.0 | 2.5 | 2496 | $2,300 | $0.92 | 13d | 1 | 0.21mi |
| 8241 Robin Hood Dr Salisbury, MD | 4.0 | 2.0 | 2496 | $2,300 | $0.92 | 43d | 1 | 0.21mi |
| 8650 Barbara Ann Way Delmar, MD | 2.0–4.0 | 2.0–3.5 | 1926 | $2,395 | $1.24 | 13d | 6 | 0.85mi |
Listing history 30 events
-
2026-06-18days on market $240,000 Active 29 DOM
-
2026-06-17days on market $240,000 Active 28 DOM
-
2026-06-16days on market $240,000 Active 27 DOM
-
2026-06-15days on market $240,000 Active 26 DOM
-
2026-06-14days on market $240,000 Active 24 DOM
-
2026-06-13statusdays on market $240,000 Active 23 DOM
-
2026-03-31status Pending
-
2026-03-23price $240,000
-
2026-03-10$259,900 Active
-
2023-11-29historical
-
2023-10-19price $264,900
-
2023-10-19status Active
-
2023-10-11historical
-
2023-10-04price $275,000
-
2023-09-26$299,900 Active
-
2015-10-06soldstatus $84,800 456-char remark
Show marketing remark (456 chars)
This home is ready for someone to come in and remodel entire inside the way you want it. On first floor there are 2 bedrooms, kitchen, Dining Room, & Living room. On the first floor there was 2 bedrooms, large room, utility room. Home has a brand new French drained installed on first floor. Home has a paved driveway and a fence in back yard with deck. See attachment for PAS requirements and WFHM offer submittal information in MLS document section.
-
2015-07-30$49,900 456-char remark
Show marketing remark (456 chars)
This home is ready for someone to come in and remodel entire inside the way you want it. On first floor there are 2 bedrooms, kitchen, Dining Room, & Living room. On the first floor there was 2 bedrooms, large room, utility room. Home has a brand new French drained installed on first floor. Home has a paved driveway and a fence in back yard with deck. See attachment for PAS requirements and WFHM offer submittal information in MLS document section.
-
2014-05-24historical
-
2013-11-22$109,900
-
2006-09-07soldstatus $250,000
-
2006-09-07soldstatus $250,000
-
2006-08-29soldstatus $250,000
-
2006-07-20historical
-
2006-06-30$250,000
-
2005-01-13soldstatus $189,900
-
2005-01-13soldstatus $189,900
-
2004-11-29soldstatus $189,900
-
2004-11-02historical
-
2004-06-21$189,900
-
1984-04-18soldstatus $58,000
ⓘ Source: listings_history table (triggers on properties + properties_extension) + one-shot
backfill from property_details.listing_events for pre-trigger history.
Tax reassessment forecast MD · Partial reset (capped growth)
- Current annual tax
- $1,693 · $141/mo
- Projected year-2 tax
- $2,154 · $180/mo
- Expected delta
- +$462/yr (+$38/mo · 27.3%)
ⓘ Screening estimate from a state-policy table — verify with the county assessor before closing.
Climate risk First Street
- Flood 1/10 Low FEMA zone X (unshaded) · 0% chance over 30 yrs
- Wildfire 3/10 Moderate
- Heat 8/10 Severe 7 d/yr ≥106°F today · 16 d/yr by 30 yrs out
- Wind 8/10 Severe 80% chance of damaging wind over 30 yrs
- Air quality 2/10 Low 1 unhealthy d/yr today · 2 by 30 yrs out
Nearby sold comps map
Loading sold comps map…
Walkable amenities ~0.75 mi
Loading nearby amenities…
Taxation est. · year 1
- Rental income
- $29,271
- − Mortgage interest
- −$13,444
- − Property taxes
- −$1,693
- − Insurance
- −$1,200
- − Repairs & maintenance
- −$2,342
- − Management
- −$2,342
- − Depreciation
- −$6,982
- Taxable income
- $1,269
- Est. tax owed @ 24.0%
- −$305
- After-tax cash flow
- $4,824/yr
For passive investors: Depreciation is non-cash, so a rental often shows a tax loss while cash-flowing — sheltering income. Rental losses are passive: they offset passive income freely, and up to $25,000/yr can offset ordinary (W-2) income if you actively participate and your MAGI is under $100k (phasing out to $0 by $150k); unused losses carry forward. On sale, claimed depreciation is recaptured at up to 25%, and gains may owe capital-gains tax (a 1031 exchange can defer both). Figures are a year-1 estimate at your 24.0% rate — not tax advice; consult a CPA.
Schools (NCES district)
- District
- Wicomico County Public Schools
- NCES district ID
- 2400690
- Math proficiency
- 16% ▼ -18.00%
- Reading proficiency
- 26% ▼ -13.00%
- Median HH income
- $51,745
- Composite
- 18.87/100
- National rank
- #8860
- State rank
- #19 of 24 in MD
Livability — Salisbury
- Score
- 60/100
- State rank
- #351
- US rank
- #18948
Category grades
Schools grade is shown separately in the Schools card above.
Census & demographics
- County
- Wicomico County · 75,969 people
- City population
- 70,518
- Metro
- Salisbury, MD-DE
- Population (ZIP)
- 40,430
- Household income
- $73,156
- Rent vs Own
- Severe rent burden
- 2096.0
Population outlook (Wicomico County) Hauer SSP2
- Today (2025)
- 108,548 people
- By 2030
- 111,783 · +3.0%
- By 2040
- 118,139 · +8.8%
- By 2050
- 123,641 · +13.9%
- By 2075
- 139,784 · +28.8%
- By 2100
- 145,334 · +33.9%
Race, ethnicity, and origin ACS 2023
- Neighborhood character
- Diverse neighborhood (Simpson 0.61)
- Race & ethnicity
- White 54% Black 30% Two or more races 9% Hispanic / Latino 7% Asian 3%
- Hispanic origin (detail)
- Mexican 4% Dominican 1%
- Common ancestry
- Hispanic 8% Romanian 3% Slovak 1%
- Foreign-born
- 13% · Canada, Vietnam, South Korea
- Languages at home
- 83% English-only · French/Haitian/Cajun 7% Spanish 5% Other Indo-European 2%
Political lean MEDSL · Wicomico
- 2024 margin
- Lean R (+5.5) · D 46.1% · R 51.5% · Other 2.4%
- 2008→2024 swing
- +0.3pp no change · 2008: -5.8pp · 2024: -5.5pp
- All cycles
- 2024: R+5.5 2020: R+1.9 2016: R+11.6 2012: R+6.9 2008: R+5.8
Not yet ingested
- Civics
- —
Market trends
- HPI YoY
- ▼ -84.15%
- Current HPI
- 230.6099
- Rent YoY
- ▲ 3.78%
- Metro
- Salisbury, MD-DE
- State GDP YoY
- ▲ 2.97%
- F500 in state
- 12
Industry mix (Fortune 500 HQ in MD)
| Industry | F500 HQs | Revenue |
|---|---|---|
| Aerospace / Defense | 1 | $71B |
|
||
| Utilities | 1 | $25B |
|
||
| Hotels | 1 | $24B |
|
||
| Consumer Goods | 1 | $7B |
|
||
| Real Estate | 1 | $6B |
|
||
| Chemicals | 1 | $2B |
|
||
Price history
+313.8% since first listed24 events — show timeline
- 2026-03-31 Pending — BRIGHT MLS
- 2026-03-23 Price Changed $240,000 BRIGHT MLS
- 2026-03-10 Listed $259,900 BRIGHT MLS
- 2023-11-29 Listing Removed — BRIGHT MLS
- 2023-10-19 Price Changed $264,900 BRIGHT MLS
- 2023-10-19 Relisted — BRIGHT MLS
- 2023-10-11 Listing Removed — BRIGHT MLS
- 2023-10-04 Price Changed $275,000 BRIGHT MLS
- 2023-09-26 Listed $299,900 BRIGHT MLS
- 2015-10-06 Sold (MLS) $84,800 BRIGHT MLS
- 2015-07-30 Listed $49,900 BRIGHT MLS
- 2014-05-24 Listing Removed — BRIGHT MLS
- 2013-11-22 Listed $109,900 BRIGHT MLS
- 2006-09-07 Sold (Public Records) $250,000 Public Records
- 2006-09-07 Sold (Public Records) $250,000 Public Records
- 2006-08-29 Sold (MLS) $250,000 BRIGHT MLS
- 2006-07-20 Listing Removed — BRIGHT MLS
- 2006-06-30 Listed $250,000 BRIGHT MLS
- 2005-01-13 Sold (Public Records) $189,900 Public Records
- 2005-01-13 Sold (Public Records) $189,900 Public Records
- 2004-11-29 Sold (MLS) $189,900 BRIGHT MLS
- 2004-11-02 Listing Removed — BRIGHT MLS
- 2004-06-21 Listed $189,900 BRIGHT MLS
- 1984-04-18 Sold (Public Records) $58,000 Public Records
Property tax history
-0.4%/yrLatest (2025): $1,693 · +2.4% YoY. Source: county tax records.
Cash-flow waterfall
monthlySold comps — $/sqft
last 12 mo · ≤1 miLoading sold comps…