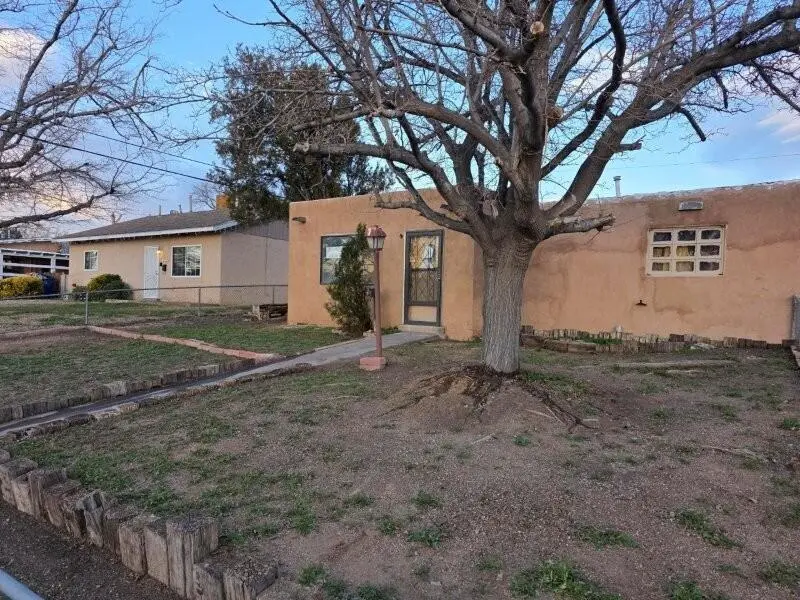
3404 Garcia St NE · Albuquerque, NM
Flood risk 1/10 · Minimal
- FEMA flood zone
- X (unshaded)
- Chance of flooding over 30 yrs
- 0.0%
- Est. flood insurance / yr
- $507 – $1,088
Fire risk 1/10 · Minimal
- Est. fire insurance / yr
- $706 – $1,312
Heat risk 4/10 · Minor
- Hot days now (above 94°F)
- 6 days/yr
- Hot days in 30 yrs
- 16 days/yr
Wind risk 1/10 · Minimal
- Chance of severe wind over 30 yrs
- —
Air-quality risk 1/10 · Minimal
- Unhealthy air days now
- 0 days/yr
- Unhealthy air days in 30 yrs
- 0 days/yr
Risk factors via First Street. Map © Google.
Why this score? — see what drove the C grade
The composite is a weighted blend of 9 inputs, each scored 0–100. Each bar is that input's sub-score; the figure is the points it added to the 100-point composite (weight × sub-score).
- Cash flow +17.2/30.0
- ARV discount +15.0/15.0
- DSCR +5.4/10.0
- Schools +5.3/10.0
- 1% rule +4.1/10.0
- Livability +3.6/5.0
- Rent growth +2.7/5.0
- Condition / age +2.5/5.0
- Appreciation +0.0/10.0
$184,900
🖨 Deal sheet (PDF) 📄 Offer letter ✓ Due diligence
Listing remarks MLS
Major fixer-upper opportunity. The home is in poor condition and cited as substandard with the city. The home will require extensive repairs and updates throughout, including but not limited to roof, plumbing, flooring, paint, and water damage remediation. Not move-in ready. Property is being sold as-is, where-is, with no repairs by seller.
Key facts
- 6,621 sq ft lot
- Built 1953
- Listed 128 days
Neighborhood map
What this means for you Summary
Snapshot
- This is a 2-bed/1.5-bath other listed at $185k.
Deal economics
- At list price, monthly cash flow is $133 ($2k/yr) — positive.
- The deal already cash-flows at list — no discount required.
- To meet the 1% rule (rent ≥ 1% of price), the offer needs to be $169k (8.7% below list).
- Recommended offer: $163k (12.0% below list) — sets the bar for market timing.
- Cap rate 7.2% vs local median 3.6% in Albuquerque — top-decile yield for the area; either an underpriced asset or a hidden risk that comps aren't pricing in. Stress-test before assuming the spread holds.
Location & tenants
- Location reads 72/100 on livability (#13 in NM) — a middle-class / working-renter tenant base. Strengths: amenities A+, commute A+, cost of living A+; Watch: crime F.
- Albuquerque Public Schools (urban): math 51% / reading 75% proficiency, ranked #3 of 29 in NM (top 10%) — acceptable for families but not a draw, mixed tenant base, ~2y average lease; 60% free/reduced lunch — lower-income household profile, screen leases tightly.
- Zoned schools: Coronado Elementary (308 students, 30% FRL); Madison Middle (602 students, 41% FRL); Sandia High (math 72% / reading 82%, grade A-, #9 of 110 statewide, top 7%, 1,728 students, 32% FRL) — zoned schools average 34% FRL vs 60% district-wide (26 pts lower); this property's tenant base skews higher-income than the district average.
- Zoned-school proficiency averages 77% at this address vs 63% district-wide (+14 pts) — the actual schools serving this property are materially stronger than the Albuquerque Public Schools average implies; a family-tenant draw the district grade alone would hide.
- Market conditions: Rents flat; 270 active listings in the ZIP; 35 comparable units currently listed for rent nearby; rentals at typical pace (median 16d on market — plan ~3-4 weeks tenant-placement turnaround); solid renter incomes; 1,316 units permitted in Bernalillo County in 2024 (546 in 5+ unit buildings).
Forward outlook
- Local home prices are declining (-3.0%/yr); year-one equity from $1k of loan paydown is wiped out by about $6k of value loss. Plan a longer hold.
Negotiation context
- It's been on market 128 days — a 12% lower offer ($163k) is reasonable based on typical stale-listing flexibility.
- 2 sale attempts; this cycle's ask has dropped $25k (12%) from the opening price — seller is motivated, your offer sets the floor, not the list.
Risks & watch-outs
- Watch-outs: built in 1953 — expect roof / HVAC / electrical / plumbing capex.
Questions for the listing agent
- It's been on market 128 days. Have you received any prior offers? Is the seller open to a 12% concession, seller financing, or rate buy-down credit?
- Built in 1953 — when were the roof, HVAC, electrical panel, plumbing, and water heater last replaced?
- Why hasn't it sold? Are there any deal-killer items the seller is aware of (foundation, flood, title, zoning, code violations)?
- Is there a deadline driving the sale (1031 exchange, divorce, estate, relocation)? That informs how much negotiation room exists.
- Schools are D-rated, which usually means shorter tenancies and higher turnover. Who's the typical renter profile here, and what's been the actual vacancy rate?
- Crime grade is F in this area — have there been break-ins, vandalism, or insurance claims at this property in the last 3 years? What carrier currently insures it and at what premium?
- What's the average days-on-market for RENTAL listings here right now (not sales)? A rising rental-DOM trend means longer vacancies and softer asking-rent achievability than the comps imply.
- What's the recent tenant-quality profile in this submarket — average credit score on applications, eviction rate, late-payment / NSF rate, and stable-employment percentage? A property-management company in the area should have these aggregated.
- How much new for-sale + rental construction is in the pipeline within 1–3 miles? Heavy new supply typically softens prices + rents 12–24 months out; constrained supply supports both.
Investment metrics
- 1% rule
- 0.91% ✗
- Cap rate
- 7.15%
- Cash-on-cash
- 3.08%
- DSCR
- 1.14
- GRM
- 9.1
CMA / ARV
- ARV (median comp)
- $317,999
- List price
- $184,900
- Delta
- -41.86%
- Verdict
- UNDERPRICED
- Comps
- 20 within 1.0 mi
Projected returns pro-forma
-3.0% appreciation · 0.6% rent growth · sell at horizon
- IRR
- -14.1%
- Equity multiple
- 0.51×
- Total profit
- $-25,511
- Equity at exit
- $27,569
- IRR
- -9.4%
- Equity multiple
- 0.48×
- Total profit
- $-26,987
- Equity at exit
- $15,987
Cash invested: $51,772 (down + closing). Projections, not guarantees.
Landlord ↔ Tenant lean methodology
- Overall (STATE)
- 55 Moderately Landlord-Leaning
- State New Mexico
- 55 Moderately Landlord-Leaning · D+3
- County
- — inherits STATE
- City
- — inherits STATE
ZIP-level market 87111
- Rents YoY
- 0.6%
- Active inventory
- 270
- Price-to-rent
- 9.1×
Monthly cashflow live
- Estimated rent
- $1,688 high interval (Pro) →
- Mortgage (P&I)
- −$970
- Tax from tax record
- −$154 /mo · $1,851/yr
- Insurance
- −$77
- HOA
- −$0
- Vacancy / Maint / Mgmt
- −$355
- Net cashflow
- $133
Break-even live
Sensitivity live
| Price | -10% $237 | -5% $185 | +0% $133 | +5% $80 | +10% $28 |
|---|---|---|---|---|---|
| Rent | -10% $-1 | -5% $66 | +0% $133 | +5% $199 | +10% $266 |
| Rate | -1.0pp $226 | -0.5pp $180 | base $133 | +0.5pp $85 | +1.0pp $36 |
UW: 25.0% down · 7.5% · 30yr · 1.5% tax · 5.0% vac · 8.0% maint · 8.0% mgmt
Financing live
Cash to close
- Down payment
- $46,225
- Closing costs
- $5,547
- Reserves months
- —
- Total cash needed
- —
Loan-product check · same deal, 3 products live
Conventional
25% down · 7.5% · 30yr
- Down + closing
- —
- Monthly P&I
- —
- Monthly cashflow
- —
- DSCR
- —
- Eligible?
- —
Personal DTI + credit; lowest rate.
DSCR
20% down · 8.5% · 30yr
- Down + closing
- —
- Monthly P&I
- —
- Monthly cashflow
- —
- DSCR
- —
- Eligible?
- —
No personal income docs; deal must DSCR.
Hard money
10% down · 12.0% · 12mo
- Down + closing
- —
- Monthly P&I
- —
- Monthly cashflow
- —
- DSCR
- —
- Eligible?
- —
Short-term bridge; refi at stabilization.
Rent comps 35 comps
| Address | Beds | Baths | Sqft | Rent | $/sqft | DOM | Units | Dist |
|---|---|---|---|---|---|---|---|---|
| 9408 Candelaria Rd NE Albuquerque, NM | 2.0 | 1.0 | 1100 | $1,300 | $1.18 | 25d | 1 | 0.35mi |
| 8906 Aztec Rd NE Albuquerque, NM | 3.0 | 1.5 | 1100 | $2,400 | $2.18 | 21d | 1 | 0.38mi |
| 9019 Los Arboles Ave NE Albuquerque, NM | 3.0 | 2.0 | 1445 | $1,800 | $1.25 | 45d | 1 | 0.52mi |
| 10108 Comanche Rd NE Unit A Albuquerque, NM | 1.0 | 1.0 | 875 | $1,095 | $1.25 | 45d | 1 | 0.60mi |
| 4236 Eubank Blvd NE Albuquerque, NM | 1.0–3.0 | 1.0–2.0 | 862 | $1,636 | $1.90 | 4d | 15 | 0.65mi |
| 9402 Claremont Ave NE Unit B Albuquerque, NM | 2.0 | 1.0 | 1000 | $1,775 | $1.77 | 25d | 1 | 0.66mi |
| 10211 Blume St NE Albuquerque, NM | 3.0 | 2.0 | 1632 | $1,850 | $1.13 | 5d | 1 | 0.74mi |
| 10113 Blume St NE Albuquerque, NM | 3.0 | 2.0 | 1700 | $1,900 | $1.12 | 45d | 1 | 0.74mi |
| 3300 Morris St NE Albuquerque, NM | 1.0–2.0 | 1.0 | 785 | $1,175 | $1.50 | 16d | 4 | 0.79mi |
| 9516 Dona Marguerita Ave NE Albuquerque, NM | 3.0 | 2.0 | 1650 | $1,800 | $1.09 | 45d | 1 | 0.85mi |
| 3101 Lori Pl NE Albuquerque, NM | 2.0 | 1.0 | 895 | $1,200 | $1.34 | 16d | 4 | 0.90mi |
| 4610 Eubank Blvd NE Albuquerque, NM | 2.0 | 1.0–2.0 | 652 | $1,309 | $2.01 | 5d | 8 | 0.91mi |
| 2316 Britt St NE Albuquerque, NM | 3.0 | 2.0 | 1403 | $2,300 | $1.64 | 25d | 1 | 0.98mi |
| 8911 Northeastern Blvd NE Albuquerque, NM | 2.0 | 1.0–2.0 | 705 | $1,350 | $1.91 | 5d | 8 | 0.99mi |
| 8000 Montgomery Blvd NE Albuquerque, NM | 1.0–2.0 | 1.0–2.0 | 816 | $1,602 | $1.96 | 5d | 14 | 1.03mi |
| 9500 Osuna Rd NE Albuquerque, NM | 1.0–2.0 | 1.0–2.0 | 925 | $1,798 | $1.94 | 5d | 16 | 1.03mi |
| 4929 Osuna Pl NE Albuquerque, NM | 2.0 | 2.0 | 1122 | $1,825 | $1.63 | 45d | 1 | 1.04mi |
| 2208 Lester Dr NE Albuquerque, NM | 2.0 | 1.0–2.0 | 758 | $1,345 | $1.77 | 45d | 1 | 1.05mi |
| 10000 Menaul Blvd NE Albuquerque, NM | 1.0–2.0 | 1.0–2.0 | 782 | $1,300 | $1.66 | 4d | 13 | 1.05mi |
| 4401 Morris St NE Albuquerque, NM | 2.0 | 1.0–2.0 | 652 | $1,464 | $2.24 | 4d | 23 | 1.05mi |
| 2201 Ambassador Rd NE Albuquerque, NM | 1.0–2.0 | 1.0–2.0 | 845 | $1,370 | $1.62 | 5d | 11 | 1.05mi |
| 10316 Gutierrez Rd NE Albuquerque, NM | 3.0 | 2.0 | 1250 | $1,945 | $1.56 | 21d | 1 | 1.17mi |
| 2405 Dorothy St NE Albuquerque, NM | 3.0 | 1.0 | 1064 | $1,700 | $1.60 | 25d | 1 | 1.18mi |
| 9900 Spain Rd NE Albuquerque, NM | 1.0–2.0 | 1.0–2.0 | 880 | $1,558 | $1.77 | 5d | 10 | 1.21mi |
| 8902 Spain Rd NE Albuquerque, NM | 2.0 | 2.0 | 1700 | $1,900 | $1.12 | 16d | 1 | 1.26mi |
| 7600 Montgomery Blvd NE Albuquerque, NM | 1.0–3.0 | 1.0–2.0 | 910 | $1,639 | $1.80 | 4d | 18 | 1.26mi |
| 8506 Spain Rd NE Albuquerque, NM | 2.0 | 2.0 | 1716 | $2,200 | $1.28 | 45d | 1 | 1.32mi |
| 5100 Mesa Del Oso Rd NE Albuquerque, NM | 2.0 | 1.0–2.5 | 1165 | $1,882 | $1.62 | 16d | 1 | 1.33mi |
| 5300 Eubank Blvd NE Albuquerque, NM | 2.0 | 1.0–2.0 | 728 | $1,758 | $2.41 | 4d | 17 | 1.35mi |
| 5316 Van Christopher Dr NE Albuquerque, NM | 3.0 | 2.0 | 1722 | $2,800 | $1.63 | 45d | 1 | 1.38mi |
| 8432 Chambers Ct NE Albuquerque, NM | 2.0 | 1.0 | 1035 | $1,600 | $1.55 | 25d | 1 | 1.38mi |
| 5222 Wyoming Blvd NE Albuquerque, NM | 1.0–2.0 | 1.0 | 852 | $1,410 | $1.65 | 5d | 8 | 1.41mi |
| 10333 Camino del Oso NE Albuquerque, NM | 3.0 | 2.0 | 1436 | $2,295 | $1.60 | 45d | 1 | 1.42mi |
| 8401 Spain Rd NE Albuquerque, NM | 1.0–2.0 | 1.0–2.0 | 687 | $1,640 | $2.39 | 5d | 40 | 1.46mi |
| 10409 Camino del Oso NE Albuquerque, NM | 2.0 | 2.0 | 1165 | $2,150 | $1.85 | 45d | 1 | 1.47mi |
Listing history 22 events
-
2026-06-22days on market $184,900 Active 128 DOM
-
2026-06-18days on market $184,900 Active 125 DOM
-
2026-06-17days on market $184,900 Active 124 DOM
-
2026-06-16days on market $184,900 Active 123 DOM
-
2026-06-15days on market $184,900 Active 122 DOM
-
2026-06-13days on market $184,900 Active 120 DOM
-
2026-06-10days on market $184,900 Active 117 DOM
-
2026-06-09days on market $184,900 Active 116 DOM
-
2026-06-08days on market $184,900 Active 115 DOM
-
2026-06-07days on market $184,900 Active 114 DOM
-
2026-06-05days on market $184,900 Active 111 DOM
-
2026-06-03days on market $184,900 Active 110 DOM
-
2026-06-02days on market $184,900 Active 109 DOM
-
2026-06-01days on market $184,900 Active 108 DOM
-
2026-05-31days on market $184,900 Active 107 DOM
-
2026-05-13status Active 342-char remark
Show marketing remark (342 chars)
Major fixer-upper opportunity. The home is in poor condition and cited as substandard with the city. The home will require extensive repairs and updates throughout, including but not limited to roof, plumbing, flooring, paint, and water damage remediation. Not move-in ready. Property is being sold as-is, where-is, with no repairs by seller.
-
2026-05-13price $184,900 342-char remark
Show marketing remark (342 chars)
Major fixer-upper opportunity. The home is in poor condition and cited as substandard with the city. The home will require extensive repairs and updates throughout, including but not limited to roof, plumbing, flooring, paint, and water damage remediation. Not move-in ready. Property is being sold as-is, where-is, with no repairs by seller.
-
2026-05-07historical 342-char remark
Show marketing remark (342 chars)
Major fixer-upper opportunity. The home is in poor condition and cited as substandard with the city. The home will require extensive repairs and updates throughout, including but not limited to roof, plumbing, flooring, paint, and water damage remediation. Not move-in ready. Property is being sold as-is, where-is, with no repairs by seller.
-
2026-04-09price $194,900 342-char remark
Show marketing remark (342 chars)
Major fixer-upper opportunity. The home is in poor condition and cited as substandard with the city. The home will require extensive repairs and updates throughout, including but not limited to roof, plumbing, flooring, paint, and water damage remediation. Not move-in ready. Property is being sold as-is, where-is, with no repairs by seller.
-
2026-03-10price $199,900 342-char remark
Show marketing remark (342 chars)
Major fixer-upper opportunity. The home is in poor condition and cited as substandard with the city. The home will require extensive repairs and updates throughout, including but not limited to roof, plumbing, flooring, paint, and water damage remediation. Not move-in ready. Property is being sold as-is, where-is, with no repairs by seller.
-
2026-02-05$209,900 Active 342-char remark
Show marketing remark (342 chars)
Major fixer-upper opportunity. The home is in poor condition and cited as substandard with the city. The home will require extensive repairs and updates throughout, including but not limited to roof, plumbing, flooring, paint, and water damage remediation. Not move-in ready. Property is being sold as-is, where-is, with no repairs by seller.
-
1998-07-23soldstatus
ⓘ Source: listings_history table (triggers on properties + properties_extension) + one-shot
backfill from property_details.listing_events for pre-trigger history.
Tax reassessment forecast NM · Resets to sale price
- Current annual tax
- $1,851 · $154/mo
- Projected year-2 tax
- $1,851 · $154/mo
- Expected delta
- $0/yr ($0/mo · -0.0%)
ⓘ Screening estimate from a state-policy table — verify with the county assessor before closing.
Climate risk First Street
- Flood 1/10 Low FEMA zone X (unshaded) · 0% chance over 30 yrs
- Wildfire 1/10 Low
- Heat 4/10 Moderate 6 d/yr ≥94°F today · 16 d/yr by 30 yrs out
- Wind 1/10 Low
- Air quality 1/10 Low 0 unhealthy d/yr today · 0 by 30 yrs out
Nearby sold comps map
Loading sold comps map…
Walkable amenities ~0.75 mi
Loading nearby amenities…
Taxation est. · year 1
- Rental income
- $20,258
- − Mortgage interest
- −$10,357
- − Property taxes
- −$1,851
- − Insurance
- −$924
- − Repairs & maintenance
- −$1,621
- − Management
- −$1,621
- − Depreciation
- −$5,379
- Taxable loss
- −$1,495
- Est. tax savings @ 24.0%
- +$359
- After-tax cash flow
- $1,952/yr
For passive investors: Depreciation is non-cash, so a rental often shows a tax loss while cash-flowing — sheltering income. Rental losses are passive: they offset passive income freely, and up to $25,000/yr can offset ordinary (W-2) income if you actively participate and your MAGI is under $100k (phasing out to $0 by $150k); unused losses carry forward. On sale, claimed depreciation is recaptured at up to 25%, and gains may owe capital-gains tax (a 1031 exchange can defer both). Figures are a year-1 estimate at your 24.0% rate — not tax advice; consult a CPA.
Schools (NCES district)
- District
- Albuquerque Public Schools
- NCES district ID
- 3500060
- Math proficiency
- 51% ▲ 30.00%
- Reading proficiency
- 75% ▲ 45.00%
- Median HH income
- $48,151
- Composite
- 53.29/100
- National rank
- #1487
- State rank
- #3 of 29 in NM
Livability — Albuquerque
- Score
- 72/100
- State rank
- #13
- US rank
- #6219
Category grades
Schools grade is shown separately in the Schools card above.
Census & demographics
- Census place
- Albuquerque, NM
- County
- Bernalillo County · 647,165 people
- City population
- 647,165
- Metro
- Albuquerque, NM
- Population (ZIP)
- 57,085
- Household income
- $90,290
- Rent vs Own
- Severe rent burden
- 2602.0
Population outlook (Bernalillo County) Hauer SSP2
- Today (2025)
- 704,528 people
- By 2030
- 711,723 · +1.0%
- By 2040
- 714,522 · +1.4%
- By 2050
- 709,274 · +0.7%
- By 2075
- 680,015 · -3.5%
- By 2100
- 619,879 · -12.0%
Race, ethnicity, and origin ACS 2023
- Neighborhood character
- Diverse neighborhood (Simpson 0.56)
- Race & ethnicity
- White 61% Hispanic / Latino 28% Two or more races 16% Native American 3% Asian 3% Black 1%
- Hispanic origin (detail)
- Mexican 11%
- Common ancestry
- Slovak 3% Lithuanian 2% Italian 2%
- Foreign-born
- 8% · Canada, Vietnam, China
- Languages at home
- 84% English-only · Spanish 9% Other Indo-European 2% German/W. Germanic 1%
Political lean MEDSL · Bernalillo
- 2024 margin
- Strong D (+21.0) · D 59.2% · R 38.2% · Other 2.6%
- 2008→2024 swing
- -0.3pp no change · 2008: 21.4pp · 2024: 21.0pp
- All cycles
- 2024: D+21.0 2020: D+24.4 2016: D+17.8 2012: D+16.2 2008: D+21.4
Not yet ingested
- Civics
- —
Market trends
- HPI YoY
- ▼ -334.94%
- Current HPI
- 236.0581
- Rent YoY
- ▲ 0.60%
- Metro
- Albuquerque, NM
- State GDP YoY
- —
- F500 in state
- 0
Price history
-11.9% since first listed7 events — show timeline
- 2026-05-13 Relisted — Southwest MLS
- 2026-05-13 Price Changed $184,900 Southwest MLS
- 2026-05-07 Delisted — Southwest MLS
- 2026-04-09 Price Changed $194,900 Southwest MLS
- 2026-03-10 Price Changed $199,900 Southwest MLS
- 2026-02-05 Listed $209,900 Southwest MLS
- 1998-07-23 Sold (Public Records) — Public Records
Property tax history
+2.7%/yrLatest (2025): $1,851 · +3.2% YoY. Source: county tax records.
Cash-flow waterfall
monthlySold comps — $/sqft
last 12 mo · ≤1 miLoading sold comps…