57 Kyle Rd · Hampton Bays, NY
Flood risk 1/10 · Minimal
- FEMA flood zone
- X (unshaded)
- Chance of flooding over 30 yrs
- 0.0%
- Est. flood insurance / yr
- $473 – $860
Fire risk 1/10 · Minimal
- Est. fire insurance / yr
- $691 – $1,283
Heat risk 4/10 · Minor
- Hot days now (above 90°F)
- 7 days/yr
- Hot days in 30 yrs
- 21 days/yr
Wind risk 8/10 · Major
- Chance of severe wind over 30 yrs
- 80.0%
Air-quality risk 3/10 · Minor
- Unhealthy air days now
- 2 days/yr
- Unhealthy air days in 30 yrs
- 3 days/yr
Risk factors via First Street. Map © Google.
Why this score? — see what drove the B- grade
The composite is a weighted blend of 9 inputs, each scored 0–100. Each bar is that input's sub-score; the figure is the points it added to the 100-point composite (weight × sub-score).
- Cash flow +27.4/30.0
- ARV discount +10.0/15.0
- DSCR +9.6/10.0
- 1% rule +6.6/10.0
- Rent growth +5.0/5.0
- Schools +4.0/10.0
- Livability +3.4/5.0
- Condition / age +2.5/5.0
- Appreciation +0.0/10.0
$825,000
🖨 Deal sheet 📄 Offer letter ✓ Due diligence
Listing remarks
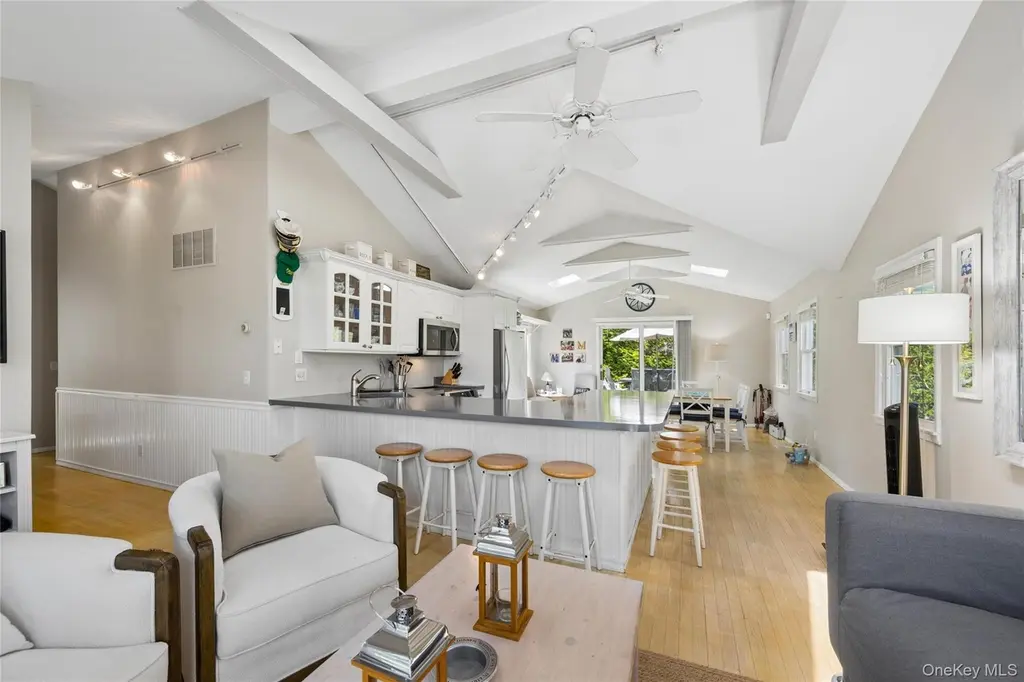
Welcome to this stunning abode nestled in the heart of Hampton Bays. This inviting property boasts three spacious bedrooms and two well-appointed bathrooms, offering plenty of room for relaxation and comfort. As you step inside, you'll be captivated by the blend of modern design and traditional charm. The open-concept living area is perfect for entertaining, while the kitchen is a chef's dream with its state-of-the-art appliances and ample counter space. The bedrooms are generously sized, each offering a private retreat for rest and rejuvenation. The bathrooms are equally impressive, featuring sleek fixtures and finishes. The real appeal of this home doesn't stop at its interior. Outside, y
Key facts
- Wealth of amenities
- 0.26 acre lot
- Built 1991
Tags
Property features AI
Exterior
- Parking: Driveway
- Utilities: Cesspool sewer; Electricity connected
- Home design: Single family residence
- Construction: Frame construction
- Exterior features: Frame construction; Not waterfront
Interior
- Kitchen: Dishwasher; Refrigerator
- Bathrooms: 1 full bath; 1 half bath
- Heating & cooling: Oil heating; Other heating; Wall/window air conditioning units
- Interior features: Partial unfinished basement; Attic (see remarks); 10 total rooms; Other interior features
Neighborhood map
What this means for you Summary
Snapshot
- This is a 3-bed/2.0-bath single-family listed at $825k.
Deal economics
- At list price, monthly cash flow is $2k ($29k/yr) — positive.
- The deal already cash-flows at list — no discount required.
- Meets the 1% rule at list price ($10k rent vs $825k).
- Recommended offer: $800k (3.0% below list) — sets the bar for market timing.
- Cap rate 9.8% vs local median 6.4% in Hampton Bays — top-decile yield for the area; either an underpriced asset or a hidden risk that comps aren't pricing in. Stress-test before assuming the spread holds.
Location & tenants
- Location reads 68/100 on livability (#551 in NY) — a middle-class / working-renter tenant base. Strengths: crime A+, employment A+, health & safety B+; Watch: amenities F, commute F, cost of living F.
- Hampton Bays Union Free School District (suburban): math 45% / reading 44% proficiency, ranked #434 of 590 in NY (top 74%) — families likely to look elsewhere, expect single-tenant / working-renter base with shorter leases.
- Zoned schools: Hampton Bays Elementary School (math 32% / reading 52%, grade F, #1,361 of 2,108 statewide, top 67%, 682 students, 55% FRL); Hampton Bays Middle School (math 25% / reading 38%, grade F, #522 of 729 statewide, top 73%, 597 students, 64% FRL); Hampton Bays High School (math 98% / reading 57%, grade A-, #580 of 1,100 statewide, top 53%, 769 students, 53% FRL) — zoned schools average 58% FRL vs 38% district-wide (20 pts higher); higher-poverty schools than district average — tighter screening recommended.
- Market conditions: Rents rising fast (+16.1%/yr); 172 active listings in the ZIP; 17 comparable units currently listed for rent nearby; rentals at typical pace (median 25d on market — plan ~3-4 weeks tenant-placement turnaround); high-income renter base; 1,366 units permitted in Suffolk County in 2024 (216 in 5+ unit buildings).
- At $9,535/mo this rent would consume 85% of the median local household income ($134k/yr) (locally 199% of renters already pay >50% of income on rent) — very limited rent-growth headroom before tenants either downsize or default.
Forward outlook
- Local home prices are declining (-3.0%/yr); year-one equity from $6k of loan paydown is wiped out by about $25k of value loss. Plan a longer hold.
- Suffolk County population projected to shrink 5% by 2050 — rents likely to lag national; underwrite the cash flow, not the appreciation.
- At projected returns (-3.0% appreciation + 8.0% rent growth), your $231k cash investment doubles in ~7 years — after that, you're playing with house money.
Negotiation context
- It's been on market 43 days — a 3% lower offer ($800k) is reasonable based on typical stale-listing flexibility.
Risks & watch-outs
- Climate carrying-cost: severe wind risk, 80% chance of damaging wind over 30y — expect insurance premiums to compound above CPI over the hold.
Questions for the listing agent
- It's been on market 43 days. Have you received any prior offers? Is the seller open to a 3% concession, seller financing, or rate buy-down credit?
- Is there a deadline driving the sale (1031 exchange, divorce, estate, relocation)? That informs how much negotiation room exists.
- Schools are B-rated — typically a magnet for longer-tenancy family renters. What's the average tenant stay here, and is there a school-zone premium baked into asking?
- What's the average days-on-market for RENTAL listings here right now (not sales)? A rising rental-DOM trend means longer vacancies and softer asking-rent achievability than the comps imply.
- What's the recent tenant-quality profile in this submarket — average credit score on applications, eviction rate, late-payment / NSF rate, and stable-employment percentage? A property-management company in the area should have these aggregated.
- How much new for-sale + rental construction is in the pipeline within 1–3 miles? Heavy new supply typically softens prices + rents 12–24 months out; constrained supply supports both.
Investment metrics
- 1% rule
- 1.16% ✓
- Cap rate
- 9.81%
- Cash-on-cash
- 12.56%
- DSCR
- 1.56
- GRM
- 7.2
CMA / ARV
- ARV (median comp)
- $874,000
- List price
- $825,000
- Delta
- -5.61%
- Verdict
- FAIR
- Comps
- 20 within 1.0 mi
Show comp detail 12 sales within ~0.75 mi
| Address | Dist | Beds/Ba | Sqft | Sold | Price | $/sf | Match |
|---|---|---|---|---|---|---|---|
| 39 Lynncliff Rd | 0.21mi | 3/2.0 | 1,112 (+0%) | 0mo | $790,000 | $710 | 89 |
| 4 Holiday Ct | 0.16mi | 3/2.0 | 1,097 (-1%) | 6mo | $700,000 | $638 | 86 |
| 18 Lovell Rd | 0.33mi | 3/1.5 | 1,100 (-1%) | 12mo | $818,000 | $744 | 71 |
| 7 Harvard Dr | 0.17mi | 2/2.0 (-1) | 1,228 (+11%) | 2mo | $815,000 | $664 | 68 |
| 12 Harvard Dr | 0.14mi | 3/1.0 | 1,016 (-8%) | 10mo | $717,000 | $706 | 67 |
| 28 Kyle Rd | 0.24mi | 3/2.0 | 1,008 (-9%) | 12mo | $770,000 | $764 | 63 |
| 6 Westerly Ct | 0.17mi | 3/1.0 | 1,276 (+15%) | 6mo | $755,000 | $592 | 58 |
| 23 Chevy Chase Rd | 0.37mi | 3/1.0 | 1,025 (-8%) | 10mo | $699,000 | $682 | 58 |
| 8 Park Ln | 0.32mi | 2/2.0 (-1) | 1,000 (-10%) | 9mo | $685,000 | $685 | 56 |
| 38 Woodridge Rd | 0.53mi | 3/1.0 | 1,200 (+8%) | 6mo | $825,000 | $688 | 53 |
| 5 Chevy Chase Rd | 0.54mi | 2/1.0 (-1) | 1,025 (-8%) | 11mo | $643,500 | $628 | 43 |
| 51A Foster Ave | 0.74mi | 3/2.0 | 1,174 (+6%) | 17mo | $895,000 | $762 | 42 |
Match score weights: distance 35% · size 25% · config 20% · recency 20%. Top-matched comps best support the ARV.
Projected returns pro-forma
-3.0% appreciation · 8.0% rent growth · sell at horizon
- IRR
- 7.4%
- Equity multiple
- 1.30×
- Total profit
- $70,425
- Equity at exit
- $123,010
- IRR
- 20.4%
- Equity multiple
- 3.11×
- Total profit
- $488,017
- Equity at exit
- $71,331
Cash invested: $231,000 (down + closing). Projections, not guarantees.
Landlord ↔ Tenant lean methodology
- Overall (STATE)
- 15 Strongly Tenant-Friendly
- State New York
- 15 Strongly Tenant-Friendly · D+10
- County
- — inherits STATE
- City
- — inherits STATE
ZIP-level market 11946
- Home prices YoY
- -20.3%
- Rents YoY
- 16.1%
- Active inventory
- 172
- Price-to-rent
- 7.2×
Monthly cashflow live
- Estimated rent
- $9,535 medium interval (Pro) →
- Mortgage (P&I)
- −$4,326
- Tax from tax record
- −$446 /mo · $5,350/yr
- Insurance
- −$344
- HOA
- −$0
- Vacancy / Maint / Mgmt
- −$2,002
- Net cashflow
- $2,417
Break-even live
UW: 25.0% down · 7.5% · 30yr · 1.5% tax · 5.0% vac · 8.0% maint · 8.0% mgmt
Financing live
Cash to close
- Down payment
- $206,250
- Closing costs
- $24,750
- Reserves months
- —
- Total cash needed
- —
Loan-product check · same deal, 3 products live
Conventional
25% down · 7.5% · 30yr
- Down + closing
- —
- Monthly P&I
- —
- Monthly cashflow
- —
- DSCR
- —
- Eligible?
- —
Personal DTI + credit; lowest rate.
DSCR
20% down · 8.5% · 30yr
- Down + closing
- —
- Monthly P&I
- —
- Monthly cashflow
- —
- DSCR
- —
- Eligible?
- —
No personal income docs; deal must DSCR.
Hard money
10% down · 12.0% · 12mo
- Down + closing
- —
- Monthly P&I
- —
- Monthly cashflow
- —
- DSCR
- —
- Eligible?
- —
Short-term bridge; refi at stabilization.
Rent comps 17 comps
| Address | Beds | Baths | Sqft | Rent | $/sqft | DOM | Units | Dist |
|---|---|---|---|---|---|---|---|---|
| 6 Long Ln Hampton Bays, NY | 2.0 | 2.0 | 1163 | $40,000 | $34.39 | 24d | 1 | 0.10mi |
| 40 Kyle Rd Hampton Bays, NY | 3.0 | 2.0 | 1320 | $5,000 | $3.79 | 43d | 1 | 0.11mi |
| 121 Ponquogue Ave Hampton Bays, NY | 3.0 | 3.0 | 1316 | $27,000 | $20.52 | 24d | 1 | 0.42mi |
| 94 Bay Ave E Hampton Bays, NY | 2.0 | 2.0 | 1000 | $20,000 | $20.00 | 15d | 1 | 0.44mi |
| 3 Foster Ave Hampton Bays, NY | 2.0 | 2.0 | 1400 | $5,000 | $3.57 | 43d | 1 | 0.48mi |
| 38 Woodridge Rd Hampton Bays, NY | 3.0 | 1.0 | 1398 | $8,000 | $5.72 | 24d | 1 | 0.54mi |
| 6 Lynn Ct Hampton Bays, NY | 2.0 | 2.0 | 1212 | $2,900 | $2.39 | 43d | 1 | 0.64mi |
| 71 Hampton Rd Hampton Bays, NY | 3.0 | 2.5 | 1500 | $18,000 | $12.00 | 24d | 1 | 0.71mi |
| 111 Fanning Ave Hampton Bays, NY | 3.0 | 2.0 | 1474 | $20,000 | $13.57 | 5d | 1 | 0.81mi |
| 229 Springville Rd Hampton Bays, NY | 2.0 | 2.0 | 1200 | $6,000 | $5.00 | 19d | 1 | 0.85mi |
| 28 Bay Ave W Hampton Bays, NY | 3.0 | 2.5 | 945 | $66,000 | $69.84 | 43d | 1 | 0.87mi |
| 68 Foster Ave #12 Hampton Bays, NY | 2.0 | 1.5 | 1125 | $18,000 | $16.00 | 43d | 1 | 1.00mi |
| 25 Gardners Ln Unit A Hampton Bays, NY | 2.0 | 1.5 | 1000 | $3,750 | $3.75 | 24d | 1 | 1.00mi |
| 3 Debbie Trl Hampton Bays, NY | 3.0 | 2.0 | 1375 | $5,500 | $4.00 | 20d | 1 | 1.08mi |
| 18 Old Riverhead Rd Hampton Bays, NY | 3.0 | 2.0 | 1056 | $13,500 | $12.78 | 24d | 1 | 1.14mi |
| 35 Grant Blvd Hampton Bays, NY | 4.0 | 3.0 | 1484 | $35,000 | $23.58 | 24d | 1 | 1.28mi |
| 51 Ocean Ave Hampton Bays, NY | 3.0 | 2.0 | 1200 | $5,000 | $4.17 | 43d | 1 | 1.46mi |
Listing history 15 events
-
2026-06-18days on market $825,000 Active 43 DOM
-
2026-06-17days on market $825,000 Active 42 DOM
-
2026-06-16days on market $825,000 Active 41 DOM
-
2026-06-15days on market $825,000 Active 40 DOM
-
2026-06-13days on market $825,000 Active 38 DOM
-
2026-06-13days on market $825,000 Active 37 DOM
-
2026-06-09days on market $825,000 Active 34 DOM
-
2026-06-08days on market $825,000 Active 33 DOM
-
2026-06-07days on market $825,000 Active 32 DOM
-
2026-06-04days on market $825,000 Active 29 DOM
-
2026-06-03days on market $825,000 Active 28 DOM
-
2026-06-02days on market $825,000 Active 27 DOM
-
2026-06-01days on market $825,000 Active 26 DOM
-
2026-05-31days on market $825,000 Active 25 DOM
-
2026-05-04$825,000 Active 1316-char remark
ⓘ Source: listings_history table (triggers on properties + properties_extension) + one-shot
backfill from property_details.listing_events for pre-trigger history.
Tax reassessment forecast NY · Partial reset (capped growth)
- Current annual tax
- $5,350 · $446/mo
- Projected year-2 tax
- $9,646 · $804/mo
- Expected delta
- +$4,296/yr (+$358/mo · 80.3%)
ⓘ Screening estimate from a state-policy table — verify with the county assessor before closing.
Climate risk First Street
- Flood 1/10 Low FEMA zone X (unshaded) · 0% chance over 30 yrs
- Wildfire 1/10 Low
- Heat 4/10 Moderate 7 d/yr ≥90°F today · 21 d/yr by 30 yrs out
- Wind 8/10 Severe 80% chance of damaging wind over 30 yrs
- Air quality 3/10 Moderate 2 unhealthy d/yr today · 3 by 30 yrs out
Nearby sold comps map
Loading sold comps map…
Walkable amenities ~0.75 mi
Loading nearby amenities…
Taxation est. · year 1
- Rental income
- $114,423
- − Mortgage interest
- −$46,213
- − Property taxes
- −$5,350
- − Insurance
- −$4,125
- − Repairs & maintenance
- −$9,154
- − Management
- −$9,154
- − Depreciation
- −$24,000
- Taxable income
- $16,428
- Est. tax owed @ 24.0%
- −$3,943
- After-tax cash flow
- $25,060/yr
For passive investors: Depreciation is non-cash, so a rental often shows a tax loss while cash-flowing — sheltering income. Rental losses are passive: they offset passive income freely, and up to $25,000/yr can offset ordinary (W-2) income if you actively participate and your MAGI is under $100k (phasing out to $0 by $150k); unused losses carry forward. On sale, claimed depreciation is recaptured at up to 25%, and gains may owe capital-gains tax (a 1031 exchange can defer both). Figures are a year-1 estimate at your 24.0% rate — not tax advice; consult a CPA.
Schools (NCES district)
- District
- Hampton Bays Union Free School District
- NCES district ID
- 3613530
- Math proficiency
- 45% ▼ -8.00%
- Reading proficiency
- 44% ▼ -1.00%
- Median HH income
- $70,274
- Composite
- 40.18/100
- National rank
- #3788
- State rank
- #434 of 590 in NY
Livability — Hampton Bays
- Score
- 68/100
- State rank
- #551
- US rank
- #9894
Category grades
Schools grade is shown separately in the Schools card above.
Census & demographics
- Census place
- Hampton Bays, NY
- County
- Suffolk County · 679,920 people
- City population
- 15,819
- Metro
- New York-Newark-Jersey City, NY-NJ-PA
- Population (ZIP)
- 15,819
- Household income
- $133,918
- Rent vs Own
- Severe rent burden
- 199.0
Population outlook (Suffolk County) Hauer SSP2
- Today (2025)
- 1,505,262 people
- By 2030
- 1,498,318 · -0.5%
- By 2040
- 1,471,101 · -2.3%
- By 2050
- 1,424,848 · -5.3%
- By 2075
- 1,337,157 · -11.2%
- By 2100
- 1,217,720 · -19.1%
Race, ethnicity, and origin ACS 2023
- Neighborhood character
- Majority White (62%)
- Race & ethnicity
- White 62% Hispanic / Latino 32% Two or more races 13% Asian 3% Black 2%
- Hispanic origin (detail)
- Mexican 6%
- Common ancestry
- Romanian 4% Slovak 2% Portuguese 2%
- Foreign-born
- 26% · Canada, Jamaica, Guatemala
- Languages at home
- 64% English-only · Spanish 29% Other Indo-European 2% French/Haitian/Cajun 2%
Political lean MEDSL · Suffolk
- 2024 margin
- Lean R (+10.0) · D 45.0% · R 55.0%
- 2008→2024 swing
- -16.0pp toward R · 2008: 6.0pp · 2024: -10.0pp
- All cycles
- 2024: R+10.0 2020: R+0.0 2016: R+8.2 2012: D+2.9 2008: D+6.0
Not yet ingested
- Civics
- —
Market trends
- HPI YoY
- ▼ -118.82%
- Current HPI
- 467.2466
- Rent YoY
- ▲ 16.07%
- Metro
- New York-Newark-Jersey City, NY-NJ-PA
- State GDP YoY
- ▲ 2.60%
- F500 in state
- 92
Industry mix (Fortune 500 HQ in NY)
| Industry | F500 HQs | Revenue |
|---|---|---|
| Financial Services | 10 | $950B |
|
||
| Consumer Goods | 9 | $162B |
|
||
| Insurance | 4 | $225B |
|
||
| Telecommunications | 2 | $144B |
|
||
| Pharmaceuticals | 2 | $112B |
|
||
| Media / Entertainment | 2 | $69B |
|
||
Price history
1 event — show timeline
- 2026-05-04 Listed $825,000 OneKey® MLS as Distributed by MLS Grid
Property tax history
+0.8%/yrLatest (2022): $5,350 · +0.0% YoY. Source: county tax records.
Cash-flow waterfall
monthlySold comps — $/sqft
last 12 mo · ≤1 miLoading sold comps…