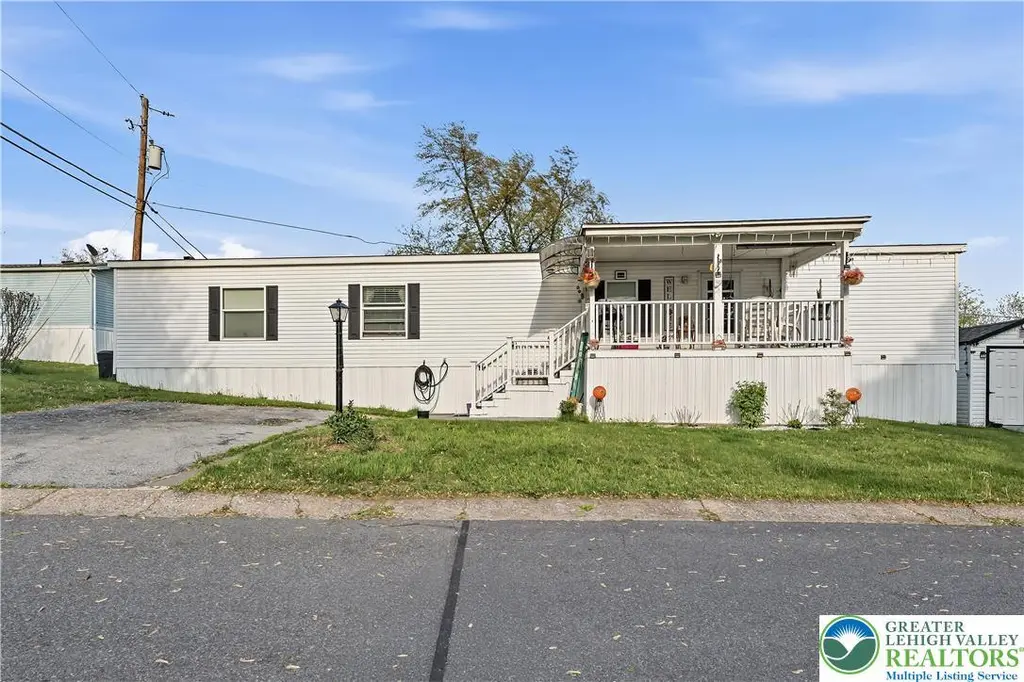
65 Easy St · Northampton, PA
Flood risk 6/10 · Moderate
- FEMA flood zone
- X (unshaded)
- Chance of flooding over 30 yrs
- 0.74%
- Est. flood insurance / yr
- $507 – $1,088
Fire risk 1/10 · Minimal
- Est. fire insurance / yr
- $511 – $949
Heat risk 4/10 · Minor
- Hot days now (above 100°F)
- 7 days/yr
- Hot days in 30 yrs
- 15 days/yr
Wind risk 4/10 · Minor
- Chance of severe wind over 30 yrs
- 20.0%
Air-quality risk 2/10 · Minimal
- Unhealthy air days now
- 0 days/yr
- Unhealthy air days in 30 yrs
- 1 days/yr
Risk factors via First Street. Map © Google.
Why this score? — see what drove the C grade
The composite is a weighted blend of 9 inputs, each scored 0–100. Each bar is that input's sub-score; the figure is the points it added to the 100-point composite (weight × sub-score).
- Cash flow +25.6/30.0
- 1% rule +10.0/10.0
- DSCR +8.5/10.0
- Schools +4.4/10.0
- Livability +4.0/5.0
- Rent growth +2.8/5.0
- Condition / age +2.5/5.0
- ARV discount +0.0/15.0
- Appreciation +0.0/10.0
$80,000
🖨 Deal sheet 📄 Offer letter ✓ Due diligence
Listing remarks
Tucked away in the desirable Whispering Hollows community, this charming 2 bedroom, 2 bath home on Easy Street offers the perfect blend of comfort and scenic surroundings. The standout feature is the oversized covered porch where you can take in the beautiful views and enjoy peaceful mornings or relaxing evenings year round. Inside, the home features an open and welcoming layout with spacious living areas, plenty of natural light, and a well designed floor plan ideal for everyday living. Conveniently located near local shopping, dining, and major routes, this home offers privacy, accessibility and a low maintenance lifestyle. Don’t miss the opportunity to enjoy easy living with beauti
Key facts
- Natural light
- Dining
- Local shopping
Tags
Property features AI
Finance
- HOA & community: Association fee $635 monthly
Exterior
- Parking: Carport; Off-street parking; On-street parking
- Utilities: 200+ amp electric service with circuit breakers; Community/Coop water; Community/Coop sewer
- Home design: Single-story; Mobile home; Unknown year built; Asphalt/fiberglass roof; Vinyl siding
- Construction: Vinyl siding construction; Asphalt and fiberglass roof
- Exterior features: Porch; Patio; Propane tank (leased); Mobile home structure; Has a view
Interior
- Kitchen: Refrigerator
- Bedrooms: Total rooms: 5
- Flooring: Vinyl
- Bathrooms: 2 full bathrooms
- Heating & cooling: Central air; Ceiling fans; Forced air heating; Propane heating
- Interior features: Eat-in kitchen; Vinyl flooring
- Laundry & utility: Washer; Dryer; Electric water heater
Neighborhood map
What this means for you Summary
Snapshot
- This is a 2-bed/2.0-bath manufactured listed at $80k.
Deal economics
- At list price, monthly cash flow is $190 ($2k/yr) — positive.
- The deal already cash-flows at list — no discount required.
- Meets the 1% rule at list price ($2k rent vs $80k).
- Recommended offer: $78k (3.0% below list) — sets the bar for market timing.
- Cap rate 9.1% vs local median 4.1% in Northampton — top-decile yield for the area; either an underpriced asset or a hidden risk that comps aren't pricing in. Stress-test before assuming the spread holds.
Location & tenants
- Location reads 80/100 on livability (#226 in PA, #1,961 nationally) — a professional / high-income tenant draw. Strengths: crime A+, cost of living A+, housing A+; Watch: amenities F, commute F.
- Northampton Area SD (suburban): math 47% / reading 54% proficiency, ranked #153 of 539 in PA (top 28%) — acceptable for families but not a draw, mixed tenant base, ~2y average lease.
- Market conditions: Rents rising (+1.3%/yr); 98 active listings in the ZIP; solid renter incomes; 567 units permitted in Northampton County in 2024 (151 in 5+ unit buildings).
Forward outlook
- Local home prices are declining (-3.0%/yr); year-one equity from $553 of loan paydown is wiped out by about $2k of value loss. Plan a longer hold.
Negotiation context
- It's been on market 34 days — a 3% lower offer ($78k) is reasonable based on typical stale-listing flexibility.
- 7 sale attempts since 19y ago with the ask held roughly flat each time — persistent listings suggest the price (not the market) is what's stuck; bring a comps-based counter.
- Current owner paid $16k; list at $80k implies a 391% gain — meaningful room to come down on a strong offer.
Risks & watch-outs
- Watch-outs: HOA is 37% of rent.
- Climate carrying-cost: major flood risk — expect insurance premiums to compound above CPI over the hold.
Questions for the listing agent
- It's been on market 34 days. Have you received any prior offers? Is the seller open to a 3% concession, seller financing, or rate buy-down credit?
- What does the HOA fee cover, when was the last increase, and are there any pending special assessments or reserve-fund shortfalls?
- Is there a deadline driving the sale (1031 exchange, divorce, estate, relocation)? That informs how much negotiation room exists.
- Schools are B-rated — typically a magnet for longer-tenancy family renters. What's the average tenant stay here, and is there a school-zone premium baked into asking?
- What's the average days-on-market for RENTAL listings here right now (not sales)? A rising rental-DOM trend means longer vacancies and softer asking-rent achievability than the comps imply.
- What's the recent tenant-quality profile in this submarket — average credit score on applications, eviction rate, late-payment / NSF rate, and stable-employment percentage? A property-management company in the area should have these aggregated.
- How much new for-sale + rental construction is in the pipeline within 1–3 miles? Heavy new supply typically softens prices + rents 12–24 months out; constrained supply supports both.
Investment metrics
- 1% rule
- 2.17% ✓
- Cap rate
- 9.14%
- Cash-on-cash
- 10.15%
- DSCR
- 1.45
- GRM
- 3.8
CMA / ARV
- ARV (median comp)
- $54,848
- List price
- $80,000
- Delta
- 45.86%
- Verdict
- OVERPRICED
- Comps
- 2 within 1.0 mi
Show comp detail 2 sales within ~0.75 mi
| Address | Dist | Beds/Ba | Sqft | Sold | Price | $/sf | Match |
|---|---|---|---|---|---|---|---|
| 75 Easy St | 0.02mi | 3/1.0 (+1) | 1,050 (+10%) | 7mo | $57,000 | $54 | 67 |
| 53 Country Club Rd W | 0.09mi | 2/1.0 | 840 (-12%) | 7mo | $62,000 | $74 | 66 |
Match score weights: distance 35% · size 25% · config 20% · recency 20%. Top-matched comps best support the ARV.
Projected returns pro-forma
-3.0% appreciation · 1.28% rent growth · sell at horizon
- IRR
- -4.2%
- Equity multiple
- 0.85×
- Total profit
- $-3,430
- Equity at exit
- $11,928
- IRR
- 1.8%
- Equity multiple
- 1.11×
- Total profit
- $2,541
- Equity at exit
- $6,917
Cash invested: $22,400 (down + closing). Projections, not guarantees.
Landlord ↔ Tenant lean methodology
- Overall (STATE)
- 62 Landlord-Friendly
- State Pennsylvania
- 62 Landlord-Friendly · EVEN
- County
- — inherits STATE
- City
- — inherits STATE
ZIP-level market 18067
- Rents YoY
- 1.3%
- Active inventory
- 98
- Price-to-rent
- 3.8×
Monthly cashflow live
- Estimated rent
- $1,732 medium interval (Pro) →
- Mortgage (P&I)
- −$420
- Tax from tax record
- −$91 /mo · $1,092/yr
- Insurance
- −$33
- HOA
- −$635
- Vacancy / Maint / Mgmt
- −$364
- Net cashflow
- $190
Break-even live
UW: 25.0% down · 7.5% · 30yr · 1.5% tax · 5.0% vac · 8.0% maint · 8.0% mgmt
Financing live
Cash to close
- Down payment
- $20,000
- Closing costs
- $2,400
- Reserves months
- —
- Total cash needed
- —
Loan-product check · same deal, 3 products live
Conventional
25% down · 7.5% · 30yr
- Down + closing
- —
- Monthly P&I
- —
- Monthly cashflow
- —
- DSCR
- —
- Eligible?
- —
Personal DTI + credit; lowest rate.
DSCR
20% down · 8.5% · 30yr
- Down + closing
- —
- Monthly P&I
- —
- Monthly cashflow
- —
- DSCR
- —
- Eligible?
- —
No personal income docs; deal must DSCR.
Hard money
10% down · 12.0% · 12mo
- Down + closing
- —
- Monthly P&I
- —
- Monthly cashflow
- —
- DSCR
- —
- Eligible?
- —
Short-term bridge; refi at stabilization.
HOA detail
- Monthly dues
- $635 · $7,620/yr
Listing history 23 events
-
2026-06-10status $80,000 Pending 34 DOM
-
2026-06-09days on market $80,000 Active 34 DOM
-
2026-06-08days on market $80,000 Active 33 DOM
-
2026-06-07days on market $80,000 Active 32 DOM
-
2026-06-05days on market $80,000 Active 29 DOM
-
2026-06-03days on market $80,000 Active 28 DOM
-
2026-06-02days on market $80,000 Active 27 DOM
-
2026-06-01days on market $80,000 Active 26 DOM
-
2026-05-31days on market $80,000 Active 25 DOM
-
2026-05-31days on market $80,000 Active 24 DOM
-
2026-05-06$80,000 Active 744-char remark
-
2020-09-11historical
-
2020-06-25price $37,900
-
2020-03-16$39,900 Active
-
2012-09-21soldstatus $16,300
-
2012-07-21$21,500
-
2008-08-26soldstatus $26,500
-
2008-04-08$32,500
-
2008-04-05historical
-
2007-10-04historical
-
2007-10-04$36,500
-
2007-04-03$36,500
-
2007-04-02$36,500
ⓘ Source: listings_history table (triggers on properties + properties_extension) + one-shot
backfill from property_details.listing_events for pre-trigger history.
Tax reassessment forecast PA · Partial reset (capped growth)
- Current annual tax
- $1,092 · $91/mo
- Projected year-2 tax
- $1,178 · $98/mo
- Expected delta
- +$86/yr (+$7/mo · 7.8%)
ⓘ Screening estimate from a state-policy table — verify with the county assessor before closing.
Climate risk First Street
- Flood 6/10 Major FEMA zone X (unshaded) · 74% chance over 30 yrs
- Wildfire 1/10 Low
- Heat 4/10 Moderate 7 d/yr ≥100°F today · 15 d/yr by 30 yrs out
- Wind 4/10 Moderate 20% chance of damaging wind over 30 yrs
- Air quality 2/10 Low 0 unhealthy d/yr today · 1 by 30 yrs out
Nearby sold comps map
Loading sold comps map…
Walkable amenities ~0.75 mi
Loading nearby amenities…
Taxation est. · year 1
- Rental income
- $20,786
- − Mortgage interest
- −$4,481
- − Property taxes
- −$1,092
- − Insurance
- −$400
- − Repairs & maintenance
- −$1,663
- − Management
- −$1,663
- − HOA
- −$7,620
- − Depreciation
- −$2,327
- Taxable income
- $1,539
- Est. tax owed @ 24.0%
- −$369
- After-tax cash flow
- $1,905/yr
For passive investors: Depreciation is non-cash, so a rental often shows a tax loss while cash-flowing — sheltering income. Rental losses are passive: they offset passive income freely, and up to $25,000/yr can offset ordinary (W-2) income if you actively participate and your MAGI is under $100k (phasing out to $0 by $150k); unused losses carry forward. On sale, claimed depreciation is recaptured at up to 25%, and gains may owe capital-gains tax (a 1031 exchange can defer both). Figures are a year-1 estimate at your 24.0% rate — not tax advice; consult a CPA.
Schools (NCES district)
- District
- Northampton Area SD
- NCES district ID
- 4217370
- Math proficiency
- 47% ▼ -1.00%
- Reading proficiency
- 54% ▼ -13.00%
- Median HH income
- $62,326
- Composite
- 44.35/100
- National rank
- #2822
- State rank
- #153 of 539 in PA
Livability — Northampton
- Score
- 80/100
- State rank
- #226
- US rank
- #1961
Category grades
Schools grade is shown separately in the Schools card above.
Census & demographics
- County
- Northampton County · 236,814 people
- City population
- 19,590
- Metro
- Allentown-Bethlehem-Easton, PA-NJ
- Population (ZIP)
- 19,590
- Household income
- $93,652
- Rent vs Own
- Severe rent burden
- 326.0
Population outlook (Northampton County) Hauer SSP2
- Today (2025)
- 312,227 people
- By 2030
- 314,769 · +0.8%
- By 2040
- 316,914 · +1.5%
- By 2050
- 318,037 · +1.9%
- By 2075
- 334,003 · +7.0%
- By 2100
- 344,696 · +10.4%
Race, ethnicity, and origin ACS 2023
- Neighborhood character
- Predominantly White (85%)
- Race & ethnicity
- White 85% Hispanic / Latino 10% Two or more races 7% Asian 1% Black 1%
- Hispanic origin (detail)
- Mexican 2% Puerto Rican 6% Dominican 1%
- Common ancestry
- Polish 4% Romanian 3% Scotch-Irish 2%
- Foreign-born
- 5% · Canada, China
- Languages at home
- 92% English-only · Spanish 3% Other Indo-European 2% Russian/Polish/Slavic 1%
Political lean MEDSL · Northampton
- 2024 margin
- Toss-up / Even · D 48.6% · R 50.4%
- 2008→2024 swing
- -14.1pp toward R · 2008: 12.3pp · 2024: -1.8pp
- All cycles
- 2024: R+1.8 2020: D+0.7 2016: R+3.8 2012: D+4.6 2008: D+12.3
Not yet ingested
- Civics
- —
Market trends
- HPI YoY
- ▼ -183.11%
- Current HPI
- 222.3606
- Rent YoY
- ▲ 1.28%
- Metro
- Allentown-Bethlehem-Easton, PA-NJ
- State GDP YoY
- ▲ 1.68%
- F500 in state
- 34
Industry mix (Fortune 500 HQ in PA)
| Industry | F500 HQs | Revenue |
|---|---|---|
| Healthcare | 2 | $309B |
|
||
| Insurance | 2 | $27B |
|
||
| Telecommunications / Media | 1 | $124B |
|
||
| Industrial Distribution | 1 | $22B |
|
||
| Financial Services | 1 | $20B |
|
||
| Chemicals / Materials | 1 | $18B |
|
||
Price history
+119.2% since first listed14 events — show timeline
- 2026-06-10 Pending — GLVRMLS
- 2026-05-06 Listed $80,000 GLVRMLS
- 2020-09-11 Listing Removed — GLVRMLS
- 2020-06-25 Price Changed $37,900 GLVRMLS
- 2020-03-16 Listed $39,900 GLVRMLS
- 2012-09-21 Sold (MLS) $16,300 GLVRMLS
- 2012-07-21 Listed $21,500 GLVRMLS
- 2008-08-26 Sold (MLS) $26,500 GLVRMLS
- 2008-04-08 Listed $32,500 GLVRMLS
- 2008-04-05 Listing Removed — GLVRMLS
- 2007-10-04 Listed $36,500 GLVRMLS
- 2007-10-04 Listing Removed — GLVRMLS
- 2007-04-03 Listed $36,500 PMAR
- 2007-04-02 Listed $36,500 GLVRMLS
Property tax history
+1.1%/yrLatest (2026): $1,092 · +3.1% YoY. Source: county tax records.
Cash-flow waterfall
monthlySold comps — $/sqft
last 12 mo · ≤1 miLoading sold comps…