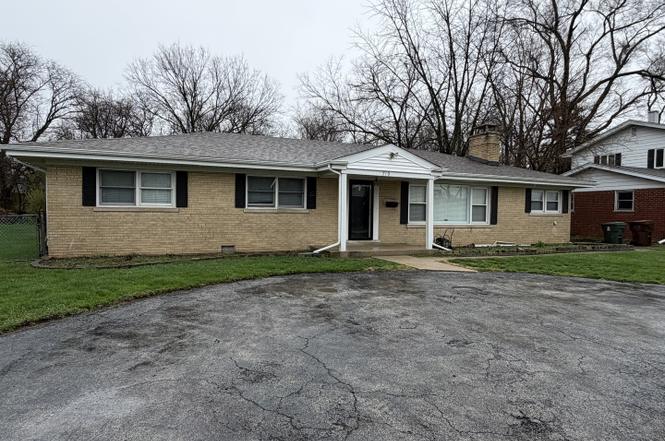
719 Braemar Rd · Flossmoor, IL
Flood risk No data
- FEMA flood zone
- —
- Chance of flooding over 30 yrs
- —
- Est. flood insurance / yr
- —
Fire risk No data
- Est. fire insurance / yr
- —
Heat risk No data
- Hot days now (above threshold)
- —
- Hot days in 30 yrs
- —
Wind risk No data
- Chance of severe wind over 30 yrs
- —
Air-quality risk No data
- Unhealthy air days now
- —
- Unhealthy air days in 30 yrs
- —
Risk factors via First Street. Map © Google.
Why this score? — see what drove the D+ grade
The composite is a weighted blend of 9 inputs, each scored 0–100. Each bar is that input's sub-score; the figure is the points it added to the 100-point composite (weight × sub-score).
- Cash flow +14.8/30.0
- ARV discount +10.5/15.0
- DSCR +4.5/10.0
- 1% rule +4.1/10.0
- Livability +4.0/5.0
- Rent growth +2.5/5.0
- Condition / age +2.5/5.0
- Schools +2.4/10.0
- Appreciation +0.0/10.0
$299,900
🖨 Deal sheet (PDF) 📄 Offer letter ✓ Due diligence
Listing remarks
Welcome to 719 Braemar in beautiful Flossmoor! This spacious 3-bedroom, 1.5-bath home offers room for everyone, featuring a bright sunroom perfect for relaxing, entertaining, or enjoying your morning coffee. Conveniently located within walking distance of the highly regarded Homewood-Flossmoor High School, this home combines location, space, and opportunity. The updated kitchen provides modern touches and functionality, while the bathroom offers an opportunity to add your own personal style and finishing touches. With generous living spaces throughout and endless potential, this home is ideal for buyers looking to build equity and make it their own. Don't miss your chance to get an exclusiv
Key facts
- 0.35 acre lot
- 4 parking spots
- Built 1961
Property features AI
Finance
- HOA & community: No master association fee required
Exterior
- Parking: Four parking spaces; Asphalt parking (owned)
- Home design: Detached single-family home; One-story
- Construction: Built 61–70 years ago; Built before 1978
- Exterior features: Quarter to half-acre lot
Interior
- Kitchen: Kitchen on main level (11 x 9)
- Bedrooms: Three bedrooms; Primary bedroom on main level (15 x 12); Bedroom on main level (12 x 11); Bedroom on main level (11 x 11)
- Bathrooms: One full bathroom; One half bathroom
- Interior features: Seven total rooms; Sun room (14 x 12)
- Laundry & utility: Main-level laundry room (15 x 7)
Neighborhood map
What this means for you Summary
Snapshot
- This is a 4-bed/1.5-bath single-family listed at $300k.
Deal economics
- At list price, monthly cash flow is $80 ($959/yr) — positive.
- The deal already cash-flows at list — no discount required.
- To meet the 1% rule (rent ≥ 1% of price), the offer needs to be $272k (9.1% below list).
- Recommended offer: $272k (9.1% below list) — sets the bar for 1% rule.
- Cap rate 6.6% vs local median 4.3% in Flossmoor — top-decile yield for the area; either an underpriced asset or a hidden risk that comps aren't pricing in. Stress-test before assuming the spread holds.
Location & tenants
- Location reads 80/100 on livability (#107 in IL, #1,718 nationally) — a professional / high-income tenant draw. Strengths: employment A+, housing A+, crime B+; Watch: cost of living D, amenities F.
- Homewood Flossmoor Chsd 233 (suburban): math 21% / reading 27% proficiency, ranked #272 of 620 in IL (top 44%) — low school quality limits family demand, transient renter base, plan for 1-2y turnover.
- Zoned schools: Western Avenue Elem School (math 32% / reading 37%, grade F, #517 of 2,056 statewide, top 28%, 491 students, 0% FRL); Parker Junior High School (math 16% / reading 21%, grade F, #438 of 665 statewide, top 67%, 858 students, 0% FRL); Homewood-Flossmoor High School (math 21% / reading 27%, grade F, #304 of 693 statewide, top 44%, 2,798 students, 0% FRL).
- Market conditions: 95 active listings in the ZIP; 6 comparable units currently listed for rent nearby; rentals leasing fast (median 5d on market — plan ~1-2 weeks tenant-placement turnaround); 6,272 units permitted in Cook County in 2024 (4,658 in 5+ unit buildings).
Forward outlook
- Local home prices are declining (-3.0%/yr); year-one equity from $2k of loan paydown is wiped out by about $9k of value loss. Plan a longer hold.
Negotiation context
- Only 5 days on market — expect competitive offers; lowballing is unlikely to land.
Questions for the listing agent
- Built in 1961 — when were the roof, HVAC, electrical panel, plumbing, and water heater last replaced?
- Is there a deadline driving the sale (1031 exchange, divorce, estate, relocation)? That informs how much negotiation room exists.
- Schools are B-rated — typically a magnet for longer-tenancy family renters. What's the average tenant stay here, and is there a school-zone premium baked into asking?
- The area grade is low — what's the realistic commute time and amenity access for the typical tenant pool here? Any planned neighborhood developments (good or bad) we should know about?
- What's the average days-on-market for RENTAL listings here right now (not sales)? A rising rental-DOM trend means longer vacancies and softer asking-rent achievability than the comps imply.
- What's the recent tenant-quality profile in this submarket — average credit score on applications, eviction rate, late-payment / NSF rate, and stable-employment percentage? A property-management company in the area should have these aggregated.
- How much new for-sale + rental construction is in the pipeline within 1–3 miles? Heavy new supply typically softens prices + rents 12–24 months out; constrained supply supports both.
Investment metrics
- 1% rule
- 0.91% ✗
- Cap rate
- 6.61%
- Cash-on-cash
- 1.14%
- DSCR
- 1.05
- GRM
- 9.2
CMA / ARV
- ARV (on-the-fly)
- $321,088
- Comps found
- 12
Show comp detail 12 sales within ~0.75 mi
| Address | Dist | Beds/Ba | Sqft | Sold | Price | $/sf | Match |
|---|---|---|---|---|---|---|---|
| 710 Bruce Ave | 0.21mi | 3/2.0 (-1) | 1,944 (+5%) | 4mo | $215,000 | $111 | 72 |
| 831 Verne Ln | 0.15mi | 3/2.0 (-1) | 1,700 (-8%) | 1mo | $335,000 | $197 | 71 |
| 18450 Stedhall Rd | 0.37mi | 4/1.5 | 2,014 (+8%) | 2mo | $305,000 | $151 | 67 |
| 1002 Douglas Ave | 0.34mi | 4/2.5 | 2,000 (+8%) | 2mo | $385,000 | $193 | 66 |
| 625 Perth Ave | 0.41mi | 3/1.5 (-1) | 1,768 (-5%) | 3mo | $305,000 | $173 | 66 |
| 18547 Fresno Ln | 0.35mi | 4/3.5 | 1,963 (+6%) | 1mo | $389,000 | $198 | 66 |
| 802 Argyle Ave | 0.33mi | 3/1.5 (-1) | 1,651 (-11%) | 5mo | $291,235 | $176 | 57 |
| 18456 Perth Ave | 0.49mi | 4/2.0 | 2,077 (+12%) | 2mo | $355,000 | $171 | 54 |
| 18210 Perth Ave | 0.73mi | 4/2.0 | 1,950 (+5%) | 3mo | $232,500 | $119 | 53 |
| 950 Gardner Rd | 0.65mi | 3/2.0 (-1) | 1,734 (-7%) | 6mo | $190,000 | $110 | 46 |
| 1248 Berry Ln | 0.73mi | 4/2.5 | 2,107 (+14%) | 1mo | $300,000 | $142 | 38 |
| 18330 Perth Ave | 0.62mi | 3/3.0 (-1) | 1,600 (-14%) | 6mo | $350,000 | $219 | 32 |
Match score weights: distance 35% · size 25% · config 20% · recency 20%. Top-matched comps best support the ARV.
Projected returns pro-forma
-3.0% appreciation · 3.0% rent growth · sell at horizon
- IRR
- -14.5%
- Equity multiple
- 0.48×
- Total profit
- $-43,464
- Equity at exit
- $44,716
- IRR
- -5.7%
- Equity multiple
- 0.63×
- Total profit
- $-31,125
- Equity at exit
- $25,930
Cash invested: $83,972 (down + closing). Projections, not guarantees.
Landlord ↔ Tenant lean methodology
- Overall (STATE)
- 43 Moderately Tenant-Leaning
- State Illinois
- 43 Moderately Tenant-Leaning · D+7
- County
- — inherits STATE
- City
- — inherits STATE
ZIP-level market 60422
- Home prices YoY
- -26.3%
- Active inventory
- 95
- Price-to-rent
- 9.2×
Monthly cashflow live
- Estimated rent
- $2,725 high interval (Pro) →
- Mortgage (P&I)
- −$1,573
- Tax est. 1.5%
- −$375 /mo · $4,498/yr
- Insurance
- −$125
- HOA
- −$0
- Vacancy / Maint / Mgmt
- −$572
- Net cashflow
- $80
Break-even live
Sensitivity live
| Price | -10% $287 | -5% $184 | +0% $80 | +5% $-24 | +10% $-127 |
|---|---|---|---|---|---|
| Rent | -10% $-135 | -5% $-28 | +0% $80 | +5% $188 | +10% $295 |
| Rate | -1.0pp $231 | -0.5pp $156 | base $80 | +0.5pp $2 | +1.0pp $-77 |
UW: 25.0% down · 7.5% · 30yr · 1.5% tax · 5.0% vac · 8.0% maint · 8.0% mgmt
Financing live
Cash to close
- Down payment
- $74,975
- Closing costs
- $8,997
- Reserves months
- —
- Total cash needed
- —
Loan-product check · same deal, 3 products live
Conventional
25% down · 7.5% · 30yr
- Down + closing
- —
- Monthly P&I
- —
- Monthly cashflow
- —
- DSCR
- —
- Eligible?
- —
Personal DTI + credit; lowest rate.
DSCR
20% down · 8.5% · 30yr
- Down + closing
- —
- Monthly P&I
- —
- Monthly cashflow
- —
- DSCR
- —
- Eligible?
- —
No personal income docs; deal must DSCR.
Hard money
10% down · 12.0% · 12mo
- Down + closing
- —
- Monthly P&I
- —
- Monthly cashflow
- —
- DSCR
- —
- Eligible?
- —
Short-term bridge; refi at stabilization.
Rent comps 6 comps
| Address | Beds | Baths | Sqft | Rent | $/sqft | DOM | Units | Dist |
|---|---|---|---|---|---|---|---|---|
| 2817 Sunset Ave Flossmoor, IL | 3.0 | 1.5 | 1648 | $1,900 | $1.15 | 26d | 1 | 0.52mi |
| 1337 Lawrence Cres Flossmoor, IL | 4.0 | 2.0 | 2264 | $4,000 | $1.77 | 4d | 1 | 0.80mi |
| 3212 Charlemagne Ave Hazel Crest, IL | 3.0 | 2.5 | 1412 | $2,650 | $1.88 | 0d | 1 | 1.10mi |
| 3515 Bordeaux Ct Hazel Crest, IL | 4.0 | 2.0 | 1486 | $2,900 | $1.95 | 3d | 1 | 1.17mi |
| 1802 Evergreen Rd Homewood, IL | 4.0 | 2.0 | 1716 | $2,836 | $1.65 | 0d | 1 | 1.36mi |
| 2722 Larkspur Ln Hazel Crest, IL | 3.0 | 1.5 | 1441 | $2,650 | $1.84 | 14d | 1 | 1.46mi |
Listing history 12 events
-
2026-06-21days on market $299,900 Active 5 DOM
-
2026-06-18days on market $299,900 Active 2 DOM
-
2026-06-17remarks 699-char remark
-
2026-06-17pricestatusdays on market $299,900 Active 1 DOM
-
2026-06-16days on market Coming Soon 13 DOM
-
2026-06-15days on market Coming Soon 12 DOM
-
2026-06-13days on market Coming Soon 10 DOM
-
2026-06-09days on market Coming Soon 6 DOM
-
2026-06-08days on market Coming Soon 5 DOM
-
2026-06-07days on market Coming Soon 4 DOM
-
2026-06-04remarks 97-char remark
-
2026-06-04Coming Soon 1 DOM
ⓘ Source: listings_history table (triggers on properties + properties_extension) + one-shot
backfill from property_details.listing_events for pre-trigger history.
Nearby sold comps map
Loading sold comps map…
Walkable amenities ~0.75 mi
Loading nearby amenities…
Taxation est. · year 1
- Rental income
- $32,696
- − Mortgage interest
- −$16,799
- − Property taxes
- −$4,498
- − Insurance
- −$1,500
- − Repairs & maintenance
- −$2,616
- − Management
- −$2,616
- − Depreciation
- −$8,724
- Taxable loss
- −$4,057
- Est. tax savings @ 24.0%
- +$974
- After-tax cash flow
- $1,933/yr
For passive investors: Depreciation is non-cash, so a rental often shows a tax loss while cash-flowing — sheltering income. Rental losses are passive: they offset passive income freely, and up to $25,000/yr can offset ordinary (W-2) income if you actively participate and your MAGI is under $100k (phasing out to $0 by $150k); unused losses carry forward. On sale, claimed depreciation is recaptured at up to 25%, and gains may owe capital-gains tax (a 1031 exchange can defer both). Figures are a year-1 estimate at your 24.0% rate — not tax advice; consult a CPA.
Schools (NCES district)
- District
- Homewood Flossmoor Chsd 233
- NCES district ID
- 1719560
- Math proficiency
- 21% ▼ -15.00%
- Reading proficiency
- 27% ▼ -13.00%
- Median HH income
- $83,564
- Composite
- 24.42/100
- National rank
- #7681
- State rank
- #272 of 620 in IL
Livability — Flossmoor
- Score
- 80/100
- State rank
- #107
- US rank
- #1718
Category grades
Schools grade is shown separately in the Schools card above.
Census & demographics
- Census place
- Flossmoor, IL
- City population
- 9,885
- Population (ZIP)
- 9,885
Population outlook (Cook County) Hauer SSP2
- Today (2025)
- 5,347,519 people
- By 2030
- 5,357,703 · +0.2%
- By 2040
- 5,324,924 · -0.4%
- By 2050
- 5,230,762 · -2.2%
- By 2075
- 4,785,735 · -10.5%
- By 2100
- 4,188,836 · -21.7%
Race, ethnicity, and origin ACS 2023
- Neighborhood character
- Majority Black (63%)
- Race & ethnicity
- Black 63% White 28% Hispanic / Latino 5% Two or more races 4% Asian 2%
- Common ancestry
- Iranian 3% Romanian 3% Portuguese 2%
- Foreign-born
- 5% · Canada
- Languages at home
- 92% English-only · Spanish 4% Other Asian/Pacific 2% Other Indo-European 1%
Political lean MEDSL · Cook
- 2024 margin
- Solid D (+42.0) · D 70.4% · R 28.4% · Other 1.2%
- 2008→2024 swing
- -11.4pp toward R · 2008: 53.4pp · 2024: 42.0pp
- All cycles
- 2024: D+42.0 2020: D+50.3 2016: D+53.0 2012: D+49.4 2008: D+53.4
Not yet ingested
- Civics
- —
Market trends
- HPI YoY
- ▼ -67.78%
- Current HPI
- 189.5534
- Rent YoY
- —
- Metro
- —
- State GDP YoY
- ▲ 1.59%
- F500 in state
- 60
Industry mix (Fortune 500 HQ in IL)
| Industry | F500 HQs | Revenue |
|---|---|---|
| Insurance | 4 | $201B |
|
||
| Consumer Goods | 4 | $87B |
|
||
| Industrial Machinery | 3 | $64B |
|
||
| Healthcare | 2 | $55B |
|
||
| Retail / Pharmacy | 1 | $148B |
|
||
| Agriculture / Food | 1 | $86B |
|
||
Cash-flow waterfall
monthlySold comps — $/sqft
last 12 mo · ≤1 miLoading sold comps…