2839 W Kings Hwy Unit W · Prescott Valley, AZ
Flood risk 5/10 · Moderate
- FEMA flood zone
- X (unshaded)
- Chance of flooding over 30 yrs
- 0.67%
- Est. flood insurance / yr
- $507 – $1,088
Fire risk 5/10 · Moderate
- Est. fire insurance / yr
- $610 – $1,132
Heat risk 4/10 · Minor
- Hot days now (above 92°F)
- 7 days/yr
- Hot days in 30 yrs
- 17 days/yr
Wind risk 1/10 · Minimal
- Chance of severe wind over 30 yrs
- —
Air-quality risk 1/10 · Minimal
- Unhealthy air days now
- 0 days/yr
- Unhealthy air days in 30 yrs
- 0 days/yr
Risk factors via First Street. Map © Google.
Why this score? — see what drove the B- grade
The composite is a weighted blend of 9 inputs, each scored 0–100. Each bar is that input's sub-score; the figure is the points it added to the 100-point composite (weight × sub-score).
- Cash flow +30.0/30.0
- DSCR +10.0/10.0
- 1% rule +9.2/10.0
- ARV discount +7.5/15.0
- Livability +3.1/5.0
- Schools +2.9/10.0
- Rent growth +2.7/5.0
- Condition / age +2.2/5.0
- Appreciation +0.0/10.0
$140,000
🖨 Deal sheet (PDF) 📄 Offer letter ✓ Due diligence
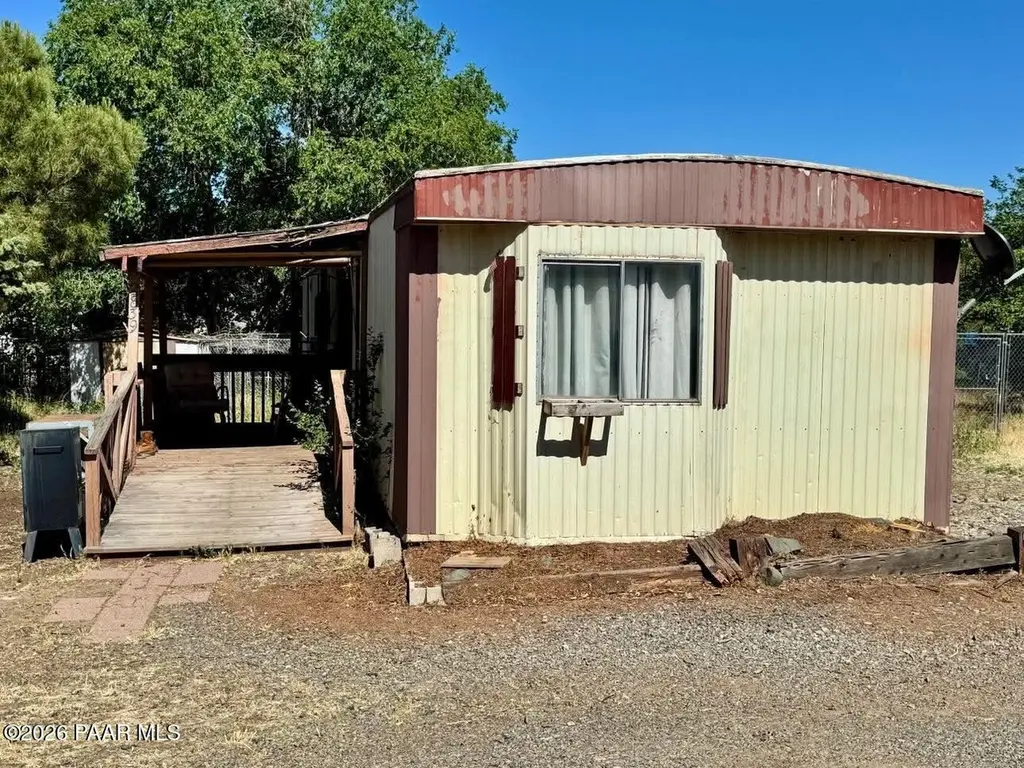
Listing remarks
Charming 3-Bedroom Home on owned land with Bonus Space. Prime Location close to shopping, hospitals, schools, and parks! Charming 3-Bedroom Home with Bonus Space and Prime Location! This inviting 1982 single-wide with a thoughtful addition offers three bedrooms, two bathrooms , plustwo additional potential bedrooms for flexible living. Enjoy an open living and dining area filled with natural light, ample cabinetry for storage, a dedicated laundry room , and a convenient home office workspace . Step outside to a covered shaded porch perfect for relaxing, surrounded by mature shade trees in both the front and backyard. The property allows RV parking and is ideally located near shopping, resta
Key facts
- Rv parking
- Covered shaded porch
- Mature shade trees
Tags
Property features AI
Finance
- Other: Lot approximately 0.2 acre (owner reported); County road frontage on a paved road (county maintains road); Zoned R1-01; Views; level topography; Subdivision: Castle Canyon Mesa
- HOA & community: Not a senior community
Exterior
- Parking: RV garage/parking available; Driveway parking
- Security: Smoke detector(s)
- Utilities: Public water; Septic (WWT - Septic Conv); Electricity available (220 volts); Natural gas available; Underground utilities; Natural gas water heater
- Home design: Residential manufactured home (single wide); One-story
- Construction: Steel frame construction; Rolled/hot mop and rubber roofing; Piers foundation; Built as a manufactured home
- Exterior features: Covered patio/porch; Circular, dirt and gravel driveway; Front landscaping; Level entry; Native vegetation (Juniper/Pinon); Shed(s)
Interior
- Kitchen: Gas range; Microwave; Oven; Range; Refrigerator
- Bedrooms: 5 possible bedrooms
- Flooring: Carpet; Laminate
- Bathrooms: 2 total bathrooms (1 full, 1 three-quarter)
- Heating & cooling: Natural gas heating; Wall furnace; Evaporative cooling
- Interior features: Eat-in kitchen and kitchen/dining combo; Laminate counters; Living on one level; Master bedroom on the main level; Walk-in closet(s); Smoke detector(s)
- Laundry & utility: Washer/dryer hookup; Laundry room; Workshop/utility space
Neighborhood map
What this means for you Summary
Snapshot
- This is a 3-bed/2.0-bath single-family listed at $140k. Condition is rated fair.
Deal economics
- At list price, monthly cash flow is $608 ($7k/yr) — positive.
- The deal already cash-flows at list — no discount required.
- Meets the 1% rule at list price ($2k rent vs $140k).
- Recommended offer: $138k (1.5% below list) — sets the bar for market timing.
- Cap rate 11.5% vs local median 3.1% in Prescott Valley — top-decile yield for the area; either an underpriced asset or a hidden risk that comps aren't pricing in. Stress-test before assuming the spread holds.
Location & tenants
- Location reads 62/100 on livability (#126 in AZ) — a middle-class / working-renter tenant base. Strengths: housing A+, crime A-; Watch: amenities F, commute F, health & safety F.
- Humboldt Unified District (4469) (suburban): math 31% / reading 37% proficiency, ranked #94 of 249 in AZ (top 38%) — families likely to look elsewhere, expect single-tenant / working-renter base with shorter leases.
- Zoned schools: Liberty Traditional School (math 56% / reading 53%, grade C, #208 of 1,109 statewide, top 19%, 785 students, 39% FRL); Glassford Hill Middle School (math 19% / reading 24%, grade F, #122 of 218 statewide, top 57%, 398 students, 49% FRL); Bradshaw Mountain High School (math 15% / reading 26%, grade F, #222 of 381 statewide, top 59%, 1,697 students, 43% FRL).
- Market conditions: Rents flat; 455 active listings in the ZIP; 7 comparable units currently listed for rent nearby; rentals at typical pace (median 16d on market — plan ~3-4 weeks tenant-placement turnaround); 2,062 units permitted in Yavapai County in 2024 (98 in 5+ unit buildings).
- This rent runs 35% of the median local income ($69k/yr) — at the standard rent-burdened threshold; future hikes will face affordability resistance.
Forward outlook
- Local home prices are declining (-3.0%/yr); year-one equity from $968 of loan paydown is wiped out by about $4k of value loss. Plan a longer hold.
- Yavapai County population projected at +10% by 2050 — modest demand growth; plan on rents tracking national, not racing it.
- At projected returns (-3.0% appreciation + 1.0% rent growth), your $39k cash investment doubles in ~8 years — after that, you're playing with house money.
Negotiation context
- It's been on market 23 days — a 2% lower offer ($138k) is reasonable based on typical stale-listing flexibility.
Risks & watch-outs
- Climate carrying-cost: moderate flood risk; moderate wildfire risk — expect insurance premiums to compound above CPI over the hold.
Questions for the listing agent
- Have any recent inspections been done? Can we get a copy of the seller's disclosures and any deferred-maintenance estimates?
- Is there a deadline driving the sale (1031 exchange, divorce, estate, relocation)? That informs how much negotiation room exists.
- What's the average days-on-market for RENTAL listings here right now (not sales)? A rising rental-DOM trend means longer vacancies and softer asking-rent achievability than the comps imply.
- What's the recent tenant-quality profile in this submarket — average credit score on applications, eviction rate, late-payment / NSF rate, and stable-employment percentage? A property-management company in the area should have these aggregated.
- How much new for-sale + rental construction is in the pipeline within 1–3 miles? Heavy new supply typically softens prices + rents 12–24 months out; constrained supply supports both.
Investment metrics
- 1% rule
- 1.42% ✓
- Cap rate
- 11.51%
- Cash-on-cash
- 18.62%
- DSCR
- 1.83
- GRM
- 5.8
CMA / ARV
- ARV (on-the-fly)
- $362,880
- Comps found
- 12
Show comp detail 12 sales within ~0.75 mi
| Address | Dist | Beds/Ba | Sqft | Sold | Price | $/sf | Match |
|---|---|---|---|---|---|---|---|
| 3044 N Kings Hwy | 0.22mi | 3/2.0 | 1,377 (-4%) | 11mo | $245,000 | $178 | 74 |
| 3001 N Cedar Springs Ln | 0.31mi | 3/2.0 | 1,445 (+0%) | 14mo | $475,000 | $329 | 74 |
| 3133 N Queen St | 0.32mi | 3/2.0 | 1,568 (+9%) | 1mo | $353,000 | $225 | 69 |
| 2780 N Date Creek Dr | 0.11mi | 3/2.0 | 1,266 (-12%) | 7mo | $365,000 | $288 | 69 |
| 3170 N Kings Hwy E | 0.34mi | 3/2.0 | 1,344 (-7%) | 8mo | $330,000 | $246 | 67 |
| 3130 N Kings Hwy E | 0.31mi | 3/2.0 | 1,323 (-8%) | 9mo | $345,000 | $261 | 64 |
| 3098 N Starlight Dr | 0.44mi | 3/1.5 | 1,268 (-12%) | 9mo | $365,000 | $288 | 50 |
| 3015 N Indian Wells Dr | 0.37mi | 2/2.0 (-1) | 1,333 (-7%) | 19mo | $324,900 | $244 | 49 |
| 3030 N Cedar Springs Ln | 0.33mi | 3/2.0 | 1,638 (+14%) | 15mo | $410,000 | $250 | 49 |
| 3421 N Tower Rd | 0.59mi | 4/3.0 (+1) | 1,458 (+1%) | 16mo | $366,800 | $252 | 48 |
| 3571 N Prescott East Hwy | 0.73mi | 3/2.0 | 1,369 (-5%) | 18mo | $374,000 | $273 | 43 |
| 3434 N Tower Rd | 0.60mi | 4/2.0 (+1) | 1,607 (+12%) | 14mo | $365,000 | $227 | 36 |
Match score weights: distance 35% · size 25% · config 20% · recency 20%. Top-matched comps best support the ARV.
Projected returns pro-forma
-3.0% appreciation · 0.97% rent growth · sell at horizon
- IRR
- 8.1%
- Equity multiple
- 1.31×
- Total profit
- $12,083
- Equity at exit
- $20,874
- IRR
- 15.5%
- Equity multiple
- 2.14×
- Total profit
- $44,786
- Equity at exit
- $12,105
Cash invested: $39,200 (down + closing). Projections, not guarantees.
Landlord ↔ Tenant lean methodology
- Overall (STATE)
- 87 Strongly Landlord-Friendly
- State Arizona
- 87 Strongly Landlord-Friendly · R+3
- County
- — inherits STATE
- City
- — inherits STATE
ZIP-level market 86314
- Home prices YoY
- -32.3%
- Rents YoY
- 1.0%
- Active inventory
- 455
- Price-to-rent
- 5.8×
Monthly cashflow live
- Estimated rent
- $1,994 high interval (Pro) →
- Mortgage (P&I)
- −$734
- Tax est. 1.5%
- −$175 /mo · $2,100/yr
- Insurance
- −$58
- HOA
- −$0
- Vacancy / Maint / Mgmt
- −$419
- Net cashflow
- $608
Break-even live
Sensitivity live
| Price | -10% $705 | -5% $656 | +0% $608 | +5% $560 | +10% $511 |
|---|---|---|---|---|---|
| Rent | -10% $451 | -5% $529 | +0% $608 | +5% $687 | +10% $766 |
| Rate | -1.0pp $679 | -0.5pp $644 | base $608 | +0.5pp $572 | +1.0pp $535 |
UW: 25.0% down · 7.5% · 30yr · 1.5% tax · 5.0% vac · 8.0% maint · 8.0% mgmt
Financing live
Cash to close
- Down payment
- $35,000
- Closing costs
- $4,200
- Reserves months
- —
- Total cash needed
- —
Loan-product check · same deal, 3 products live
Conventional
25% down · 7.5% · 30yr
- Down + closing
- —
- Monthly P&I
- —
- Monthly cashflow
- —
- DSCR
- —
- Eligible?
- —
Personal DTI + credit; lowest rate.
DSCR
20% down · 8.5% · 30yr
- Down + closing
- —
- Monthly P&I
- —
- Monthly cashflow
- —
- DSCR
- —
- Eligible?
- —
No personal income docs; deal must DSCR.
Hard money
10% down · 12.0% · 12mo
- Down + closing
- —
- Monthly P&I
- —
- Monthly cashflow
- —
- DSCR
- —
- Eligible?
- —
Short-term bridge; refi at stabilization.
Rent comps 7 comps
| Address | Beds | Baths | Sqft | Rent | $/sqft | DOM | Units | Dist |
|---|---|---|---|---|---|---|---|---|
| 2809 N Superstition Ln Apt D Prescott Valley, AZ | 2.0 | 2.0 | 1013 | $1,600 | $1.58 | 46d | 1 | 0.31mi |
| 2809 N Superstition Ln Apt A Prescott Valley, AZ | 2.0 | 2.0 | 1013 | $1,495 | $1.48 | 15d | 1 | 0.31mi |
| 5805 Market St Prescott Valley, AZ | 1.0–3.0 | 1.0–2.0 | 1015 | $2,465 | $2.43 | 15d | 1 | 0.39mi |
| 5700 Market St Prescott Valley, AZ | 1.0–3.0 | 1.0–2.0 | 936 | $1,992 | $2.13 | 15d | 20 | 0.44mi |
| 3131 N Main St Prescott Valley, AZ | 1.0–3.0 | 1.0–2.0 | 935 | $1,985 | $2.12 | 15d | 33 | 1.30mi |
| 1889 N Emerald Dr Prescott, AZ | 3.0 | 2.0 | 1408 | $2,200 | $1.56 | 46d | 1 | 1.34mi |
| 5270 Diamond Dr Unit B Prescott, AZ | 3.0 | 2.0 | 1460 | $1,865 | $1.28 | 23d | 1 | 1.40mi |
Listing history 9 events
-
2026-06-10days on market $140,000 Active 23 DOM
-
2026-06-09days on market $140,000 Active 22 DOM
-
2026-06-08days on market $140,000 Active 21 DOM
-
2026-06-07days on market $140,000 Active 20 DOM
-
2026-06-02days on market $140,000 Active 15 DOM
-
2026-06-01days on market $140,000 Active 14 DOM
-
2026-05-31days on market $140,000 Active 13 DOM
-
2026-05-30days on market $140,000 Active 12 DOM
-
2026-05-18$150,000 Active
ⓘ Source: listings_history table (triggers on properties + properties_extension) + one-shot
backfill from property_details.listing_events for pre-trigger history.
Climate risk First Street
- Flood 5/10 Major FEMA zone X (unshaded) · 67% chance over 30 yrs
- Wildfire 5/10 Major
- Heat 4/10 Moderate 7 d/yr ≥92°F today · 17 d/yr by 30 yrs out
- Wind 1/10 Low
- Air quality 1/10 Low 0 unhealthy d/yr today · 0 by 30 yrs out
Nearby sold comps map
Loading sold comps map…
Walkable amenities ~0.75 mi
Loading nearby amenities…
Taxation est. · year 1
- Rental income
- $23,934
- − Mortgage interest
- −$7,842
- − Property taxes
- −$2,100
- − Insurance
- −$700
- − Repairs & maintenance
- −$1,915
- − Management
- −$1,915
- − Depreciation
- −$4,073
- Taxable income
- $5,389
- Est. tax owed @ 24.0%
- −$1,293
- After-tax cash flow
- $6,004/yr
For passive investors: Depreciation is non-cash, so a rental often shows a tax loss while cash-flowing — sheltering income. Rental losses are passive: they offset passive income freely, and up to $25,000/yr can offset ordinary (W-2) income if you actively participate and your MAGI is under $100k (phasing out to $0 by $150k); unused losses carry forward. On sale, claimed depreciation is recaptured at up to 25%, and gains may owe capital-gains tax (a 1031 exchange can defer both). Figures are a year-1 estimate at your 24.0% rate — not tax advice; consult a CPA.
Condition & rehab AI · 30 photos
This single-wide mobile home requires extensive repairs and updates to improve its condition and increase its resale or rental value.
Repairs flagged
- Major Exposed ceiling — Structural damage and safety hazard.
- Major Missing cabinets — Aesthetics and functionality compromised.
- Major Weathered siding — Structural integrity and appearance compromised.
- Major Overgrown landscaping — Safety and aesthetics compromised.
- Major Porch railings — Safety hazard and aesthetics compromised.
Value-add opportunities
- Resale Painting and updating the kitchen and bathrooms — Enhances curb appeal and interior aesthetics.
- Resale Flooring replacement — Improves living space and adds value.
- Resale Cabinet installation — Enhances storage and functionality.
- Resale Landscaping maintenance — Improves curb appeal and adds value.
- Resale Porch railings replacement — Enhances safety and aesthetics.
Renovation cost estimate screening
| Repair item | Severity | Est. cost |
|---|---|---|
| Exposed ceiling · Structural damage and safety hazard. | Major | $15,000–50,000 |
| Missing cabinets · Aesthetics and functionality compromised. | Major | $15,000–50,000 |
| Weathered siding · Structural integrity and appearance compromised. | Major | $15,000–50,000 |
| Overgrown landscaping · Safety and aesthetics compromised. | Major | $15,000–50,000 |
| Porch railings · Safety hazard and aesthetics compromised. | Major | $15,000–50,000 |
| Total estimated repair cost · 5 items | $75,000–250,000 |
Value-add ROI direction
- Resale Painting and updating the kitchen and bathrooms — Enhances curb appeal and interior aesthetics. ↑
- Resale Flooring replacement — Improves living space and adds value. ↑
- Resale Cabinet installation — Enhances storage and functionality. ↑
- Resale Landscaping maintenance — Improves curb appeal and adds value. ↑
- Resale Porch railings replacement — Enhances safety and aesthetics. ↑
ⓘ Cost ranges are severity-bucket heuristics (US national rule-of-thumb). Get contractor quotes + a written scope before underwriting a rehab budget.
Schools (NCES district)
- District
- Humboldt Unified District (4469)
- NCES district ID
- 0403870
- Math proficiency
- 31% ▼ -13.00%
- Reading proficiency
- 37% ▼ -14.00%
- Median HH income
- $45,326
- Composite
- 29.06/100
- National rank
- #6605
- State rank
- #94 of 249 in AZ
Livability — Prescott Valley
- Score
- 62/100
- State rank
- #126
- US rank
- #16160
Category grades
Schools grade is shown separately in the Schools card above.
Census & demographics
- County
- Yavapai County · 190,406 people
- City population
- 63,155
- Metro
- Prescott Valley-Prescott, AZ
- Population (ZIP)
- 40,317
- Household income
- $69,208
- Rent vs Own
- Severe rent burden
- 1236.0
Population outlook (Yavapai County) Hauer SSP2
- Today (2025)
- 241,389 people
- By 2030
- 249,523 · +3.4%
- By 2040
- 259,966 · +7.7%
- By 2050
- 264,736 · +9.7%
- By 2075
- 269,334 · +11.6%
- By 2100
- 256,505 · +6.3%
Race, ethnicity, and origin ACS 2023
- Neighborhood character
- Predominantly White (71%)
- Race & ethnicity
- White 71% Hispanic / Latino 22% Two or more races 15% Asian 1% Native American 1%
- Hispanic origin (detail)
- Mexican 20%
- Common ancestry
- Slovak 4% Lithuanian 3% Romanian 3%
- Foreign-born
- 8% · Canada
- Languages at home
- 83% English-only · Spanish 15%
Political lean MEDSL · Yavapai
- 2024 margin
- Solid R (+33.9) · D 32.6% · R 66.5%
- 2008→2024 swing
- -9.5pp toward R · 2008: -24.4pp · 2024: -33.9pp
- All cycles
- 2024: R+33.9 2020: R+29.3 2016: R+31.4 2012: R+30.7 2008: R+24.4
Not yet ingested
- Civics
- —
Market trends
- HPI YoY
- ▼ -176.27%
- Current HPI
- 370.04
- Rent YoY
- ▲ 0.97%
- Metro
- Prescott Valley-Prescott, AZ
- State GDP YoY
- ▲ 4.54%
- F500 in state
- 20
Industry mix (Fortune 500 HQ in AZ)
| Industry | F500 HQs | Revenue |
|---|---|---|
| Technology | 2 | $13B |
|
||
| Mining / Metals | 1 | $23B |
|
||
| Environmental Services | 1 | $16B |
|
||
| Metals / Steel | 1 | $14B |
|
||
| Technology Distribution | 1 | $9B |
|
||
| Homebuilding | 1 | $8B |
|
||
Cash-flow waterfall
monthlySold comps — $/sqft
last 12 mo · ≤1 miLoading sold comps…