2314 Backwoods Way · Pittman Center, TN
Flood risk 1/10 · Minimal
- FEMA flood zone
- X (unshaded)
- Chance of flooding over 30 yrs
- 0.0%
- Est. flood insurance / yr
- $507 – $1,088
Fire risk 5/10 · Moderate
- Est. fire insurance / yr
- $949 – $1,763
Heat risk 4/10 · Minor
- Hot days now (above 99°F)
- 7 days/yr
- Hot days in 30 yrs
- 20 days/yr
Wind risk 2/10 · Minimal
- Chance of severe wind over 30 yrs
- —
Air-quality risk 2/10 · Minimal
- Unhealthy air days now
- 1 days/yr
- Unhealthy air days in 30 yrs
- 2 days/yr
Risk factors via First Street. Map © Google.
Why this score? — see what drove the F grade
The composite is a weighted blend of 9 inputs, each scored 0–100. Each bar is that input's sub-score; the figure is the points it added to the 100-point composite (weight × sub-score).
- Cash flow +14.6/30.0
- DSCR +4.5/10.0
- Livability +3.1/5.0
- 1% rule +3.0/10.0
- Rent growth +2.5/5.0
- Schools +2.5/10.0
- Condition / age +2.5/5.0
- ARV discount +0.0/15.0
- Appreciation +0.0/10.0
$649,900
🖨 Deal sheet 📄 Offer letter ✓ Due diligence
Listing remarks MLS
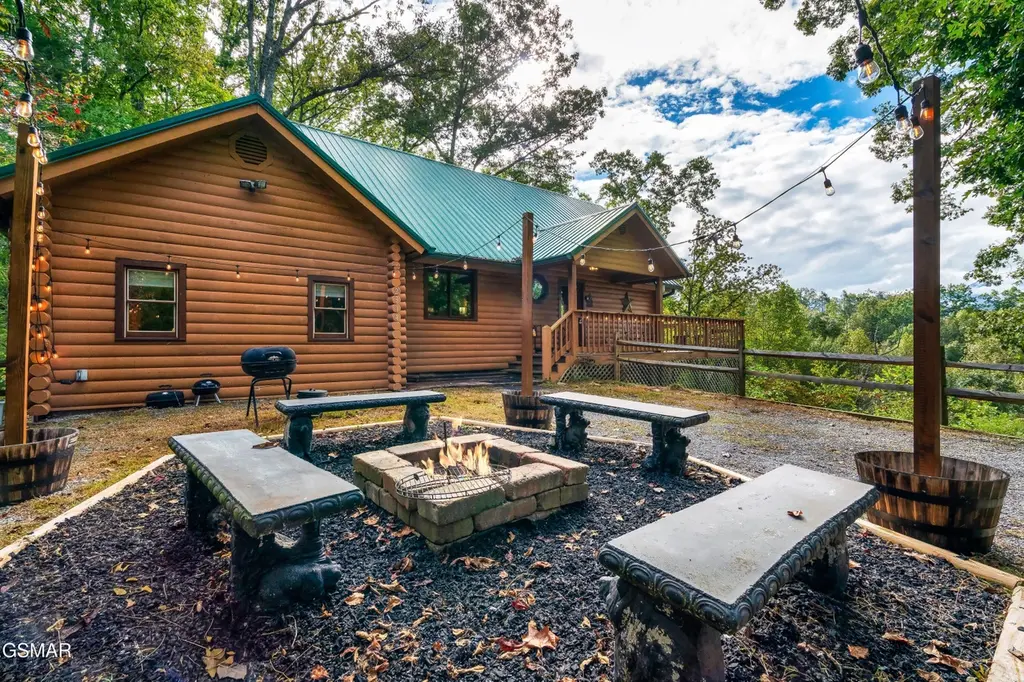
Incredible views surround this tastefully decorated 2-bedroom cabin with a loft. Enjoy two separate decks with scenic views, a hot tub, fire pit, and outdoor dining area. The game room features billiards, a racing arcade, several additional games, and a movie area with a big-screen TV. The gourmet kitchen offers quartz countertops, a gas stove, island bar seating, and an open-concept layout. Inside, you'll find a stacked stone fireplace and two king bedrooms with beautifully designed bathrooms. Conveniently located just minutes from the Gatlinburg Arts & Crafts District.
Key facts
- Hot tub
- Billiards
- Outdoor dining area
Tags
Property features AI
Finance
- HOA & community: Annual association fee of $150
Exterior
- Parking: Other parking
- Utilities: Septic tank
- Home design: Attached property
- Construction: Log construction
- Exterior features: Mountain view; Log construction
Interior
- Kitchen: Dishwasher; Microwave; Refrigerator
- Flooring: Hardwood
- Bathrooms: 2 full bathrooms
- Heating & cooling: Propane heating; Central cooling
- Interior features: Eat-in kitchen; Wood-burning fireplace
- Laundry & utility: Washer; Dryer
Neighborhood map
What this means for you Summary
Snapshot
- This is a 2-bed/4.0-bath single-family listed at $650k.
Deal economics
- At list price, monthly cash flow is $154 ($2k/yr) — positive.
- The deal already cash-flows at list — no discount required.
- To meet the 1% rule (rent ≥ 1% of price), the offer needs to be $518k (20.3% below list).
- Recommended offer: $518k (20.3% below list) — sets the bar for 1% rule.
- Cap rate 6.6% vs local median 1.2% in Pittman Center — top-decile yield for the area; either an underpriced asset or a hidden risk that comps aren't pricing in. Stress-test before assuming the spread holds.
Location & tenants
- Location reads 62/100 on livability (#208 in TN) — a middle-class / working-renter tenant base. Strengths: cost of living A+, housing A-; Watch: crime D, schools D-, amenities F.
- Sevier County (rural): math 31% / reading 28% proficiency, ranked #62 of 139 in TN (top 45%) — low school quality limits family demand, transient renter base, plan for 1-2y turnover.
- Market conditions: 696 active listings in the ZIP; 1 comparable units currently listed for rent nearby; 1,594 units permitted in Sevier County in 2024 (456 in 5+ unit buildings).
Forward outlook
- Local home prices are declining (-3.0%/yr); year-one equity from $4k of loan paydown is wiped out by about $19k of value loss. Plan a longer hold.
- Sevier County population projected at +22% by 2050 — long-run rental-demand tailwind backs the buy-and-hold thesis.
Negotiation context
- It's been on market 15 days — a 2% lower offer ($640k) is reasonable based on typical stale-listing flexibility.
- 6 sale attempts since 18y ago with the ask held roughly flat each time — persistent listings suggest the price (not the market) is what's stuck; bring a comps-based counter.
Risks & watch-outs
- Climate carrying-cost: moderate wildfire risk — expect insurance premiums to compound above CPI over the hold.
Questions for the listing agent
- What does the HOA fee cover, when was the last increase, and are there any pending special assessments or reserve-fund shortfalls?
- Is there a deadline driving the sale (1031 exchange, divorce, estate, relocation)? That informs how much negotiation room exists.
- Schools are D-rated, which usually means shorter tenancies and higher turnover. Who's the typical renter profile here, and what's been the actual vacancy rate?
- Crime grade is D in this area — have there been break-ins, vandalism, or insurance claims at this property in the last 3 years? What carrier currently insures it and at what premium?
- The area grade is low — what's the realistic commute time and amenity access for the typical tenant pool here? Any planned neighborhood developments (good or bad) we should know about?
- What's the average days-on-market for RENTAL listings here right now (not sales)? A rising rental-DOM trend means longer vacancies and softer asking-rent achievability than the comps imply.
- What's the recent tenant-quality profile in this submarket — average credit score on applications, eviction rate, late-payment / NSF rate, and stable-employment percentage? A property-management company in the area should have these aggregated.
- How much new for-sale + rental construction is in the pipeline within 1–3 miles? Heavy new supply typically softens prices + rents 12–24 months out; constrained supply supports both.
Investment metrics
- 1% rule
- 0.80% ✗
- Cap rate
- 6.58%
- Cash-on-cash
- 1.02%
- DSCR
- 1.05
- GRM
- 10.5
CMA / ARV
- ARV (on-the-fly)
- $552,874
- Comps found
- 2
Show comp detail 2 sales within ~0.75 mi
| Address | Dist | Beds/Ba | Sqft | Sold | Price | $/sf | Match |
|---|---|---|---|---|---|---|---|
| 2339 Backwoods Way | 0.14mi | 3/2.0 (+1) | 1,600 (+13%) | 13mo | $625,000 | $391 | 48 |
| 2201 Berry Clark Dr | 0.08mi | 1/1.5 (-1) | 1,250 (-12%) | 20mo | $478,000 | $382 | 46 |
Match score weights: distance 35% · size 25% · config 20% · recency 20%. Top-matched comps best support the ARV.
Projected returns pro-forma
-3.0% appreciation · 3.0% rent growth · sell at horizon
- IRR
- -14.7%
- Equity multiple
- 0.47×
- Total profit
- $-95,760
- Equity at exit
- $96,902
- IRR
- -6.1%
- Equity multiple
- 0.61×
- Total profit
- $-71,816
- Equity at exit
- $56,191
Cash invested: $181,972 (down + closing). Projections, not guarantees.
Landlord ↔ Tenant lean methodology
- Overall (STATE)
- 87 Strongly Landlord-Friendly
- State Tennessee
- 87 Strongly Landlord-Friendly · R+13
- County
- — inherits STATE
- City
- — inherits STATE
ZIP-level market 37738
- Home prices YoY
- -28.5%
- Active inventory
- 696
- Price-to-rent
- 10.5×
Monthly cashflow live
- Estimated rent
- $5,178 medium interval (Pro) →
- Mortgage (P&I)
- −$3,408
- Tax from tax record
- −$245 /mo · $2,935/yr
- Insurance
- −$271
- HOA
- −$13
- Vacancy / Maint / Mgmt
- −$1,087
- Net cashflow
- $154
Break-even live
UW: 25.0% down · 7.5% · 30yr · 1.5% tax · 5.0% vac · 8.0% maint · 8.0% mgmt
Financing live
Cash to close
- Down payment
- $162,475
- Closing costs
- $19,497
- Reserves months
- —
- Total cash needed
- —
Loan-product check · same deal, 3 products live
Conventional
25% down · 7.5% · 30yr
- Down + closing
- —
- Monthly P&I
- —
- Monthly cashflow
- —
- DSCR
- —
- Eligible?
- —
Personal DTI + credit; lowest rate.
DSCR
20% down · 8.5% · 30yr
- Down + closing
- —
- Monthly P&I
- —
- Monthly cashflow
- —
- DSCR
- —
- Eligible?
- —
No personal income docs; deal must DSCR.
Hard money
10% down · 12.0% · 12mo
- Down + closing
- —
- Monthly P&I
- —
- Monthly cashflow
- —
- DSCR
- —
- Eligible?
- —
Short-term bridge; refi at stabilization.
Rent comps 1 comps
| Address | Beds | Baths | Sqft | Rent | $/sqft | DOM | Units | Dist |
|---|---|---|---|---|---|---|---|---|
| 5151 Riversong Way Unit 1051751P Sevierville, TN | 2.0 | 2.0 | 1151 | $5,178 | $4.50 | 43d | 1 | 1.49mi |
HOA detail
- Monthly dues
- $13 · $156/yr
- Likely covers
- gas
Listing history 12 events
-
2026-06-19days on market $649,900 Active 15 DOM
-
2026-06-18days on market $649,900 Active 14 DOM
-
2026-06-17days on market $649,900 Active 13 DOM
-
2026-06-16days on market $649,900 Active 12 DOM
-
2026-06-15days on market $649,900 Active 11 DOM
-
2026-06-14days on market $649,900 Active 9 DOM
-
2026-06-13pricedays on market $649,900 Active 8 DOM
-
2026-06-10days on market $649,909 Active 6 DOM
-
2026-06-09days on market $649,909 Active 5 DOM
-
2026-06-08days on market $649,909 Active 4 DOM
-
2026-06-07remarks 579-char remark
-
2026-06-07$649,909 Active 3 DOM
ⓘ Source: listings_history table (triggers on properties + properties_extension) + one-shot
backfill from property_details.listing_events for pre-trigger history.
Tax reassessment forecast TN · Resets to sale price
- Current annual tax
- $2,935 · $245/mo
- Projected year-2 tax
- $4,614 · $385/mo
- Expected delta
- +$1,679/yr (+$140/mo · 57.2%)
ⓘ Screening estimate from a state-policy table — verify with the county assessor before closing.
Climate risk First Street
- Flood 1/10 Low FEMA zone X (unshaded) · 0% chance over 30 yrs
- Wildfire 5/10 Major
- Heat 4/10 Moderate 7 d/yr ≥99°F today · 20 d/yr by 30 yrs out
- Wind 2/10 Low
- Air quality 2/10 Low 1 unhealthy d/yr today · 2 by 30 yrs out
Nearby sold comps map
Loading sold comps map…
Walkable amenities ~0.75 mi
Loading nearby amenities…
Taxation est. · year 1
- Rental income
- $62,136
- − Mortgage interest
- −$36,405
- − Property taxes
- −$2,935
- − Insurance
- −$3,250
- − Repairs & maintenance
- −$4,971
- − Management
- −$4,971
- − HOA
- −$156
- − Depreciation
- −$18,906
- Taxable loss
- −$9,457
- Est. tax savings @ 24.0%
- +$2,270
- After-tax cash flow
- $4,119/yr
For passive investors: Depreciation is non-cash, so a rental often shows a tax loss while cash-flowing — sheltering income. Rental losses are passive: they offset passive income freely, and up to $25,000/yr can offset ordinary (W-2) income if you actively participate and your MAGI is under $100k (phasing out to $0 by $150k); unused losses carry forward. On sale, claimed depreciation is recaptured at up to 25%, and gains may owe capital-gains tax (a 1031 exchange can defer both). Figures are a year-1 estimate at your 24.0% rate — not tax advice; consult a CPA.
Schools (NCES district)
- District
- Sevier County
- NCES district ID
- 4703780
- Math proficiency
- 31% ▼ -6.00%
- Reading proficiency
- 28% ▼ -4.00%
- Median HH income
- $42,730
- Composite
- 25.12/100
- National rank
- #7527
- State rank
- #62 of 139 in TN
Livability — Pittman Center
- Score
- 62/100
- State rank
- #208
- US rank
- #16107
Category grades
Schools grade is shown separately in the Schools card above.
Census & demographics
- Population (ZIP)
- 5,269
Population outlook (Sevier County) Hauer SSP2
- Today (2025)
- 107,903 people
- By 2030
- 113,633 · +5.3%
- By 2040
- 123,969 · +14.9%
- By 2050
- 132,123 · +22.4%
- By 2075
- 148,524 · +37.6%
- By 2100
- 153,436 · +42.2%
Race, ethnicity, and origin ACS 2023
- Neighborhood character
- Predominantly White (81%)
- Race & ethnicity
- White 81% Hispanic / Latino 12% Two or more races 4% Black 3% Asian 3%
- Hispanic origin (detail)
- Mexican 2%
- Common ancestry
- Slovak 6% Serbian 5% Romanian 3%
- Foreign-born
- 12% · Canada, China
- Languages at home
- 86% English-only · Spanish 10% Other Indo-European 2% Chinese 1%
Political lean MEDSL · Sevier
- 2024 margin
- Solid R (+61.1) · D 18.9% · R 80.1% · Other 1.0%
- 2008→2024 swing
- -13.1pp toward R · 2008: -48.1pp · 2024: -61.1pp
- All cycles
- 2024: R+61.1 2020: R+57.6 2016: R+61.7 2012: R+54.8 2008: R+48.1
Not yet ingested
- Civics
- —
Market trends
- HPI YoY
- ▼ -118.02%
- Current HPI
- 296.203
- Rent YoY
- —
- Metro
- —
- State GDP YoY
- ▲ 2.78%
- F500 in state
- 22
Industry mix (Fortune 500 HQ in TN)
| Industry | F500 HQs | Revenue |
|---|---|---|
| Healthcare | 3 | $91B |
|
||
| Retail | 3 | $72B |
|
||
| Transportation / Logistics | 1 | $88B |
|
||
| Paper / Packaging | 1 | $19B |
|
||
| Insurance | 1 | $13B |
|
||
| Energy | 1 | $12B |
|
||
Price history
+655.7% since first listed13 events — show timeline
- 2026-05-21 Listed $649,909 Knoxville MLS
- 2026-05-21 Listed $649,909 GSMAR
- 2022-08-03 Sold (Public Records) $730,000 Public Records
- 2022-08-03 Sold (MLS) $730,000 GSMAR
- 2012-10-11 Sold (Public Records) $285,000 Public Records
- 2012-10-09 Sold (MLS) $285,000 Knoxville MLS
- 2012-10-09 Sold (MLS) $285,000 GSMAR
- 2012-08-23 Listed $299,900 Knoxville MLS
- 2011-08-22 Sold (MLS) $215,000 GSMAR
- 2009-09-16 Listed $269,900 Knoxville MLS
- 2009-03-22 Listed $289,900 Knoxville MLS
- 2008-09-18 Listed $299,900 Knoxville MLS
- 1996-07-26 Sold (Public Records) $86,000 Public Records
Property tax history
+7.4%/yrLatest (2025): $2,935 · +2.4% YoY. Source: county tax records.
Cash-flow waterfall
monthlySold comps — $/sqft
last 12 mo · ≤1 miLoading sold comps…