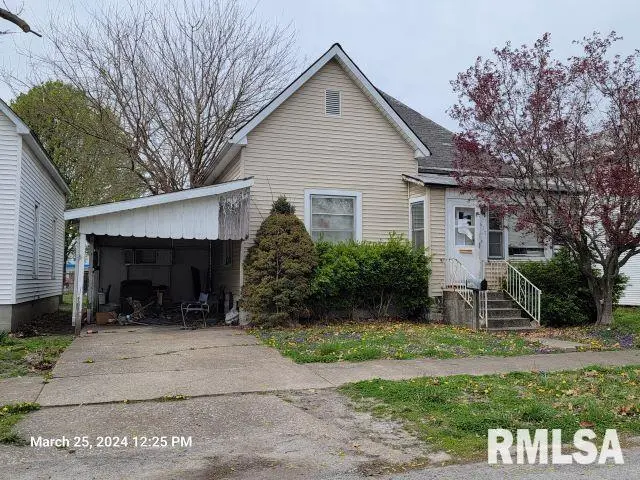
617 N 14th St · Herrin, IL
Flood risk 1/10 · Minimal
- FEMA flood zone
- X (unshaded)
- Chance of flooding over 30 yrs
- 0.0%
- Est. flood insurance / yr
- $473 – $860
Fire risk 1/10 · Minimal
- Est. fire insurance / yr
- $804 – $1,492
Heat risk 5/10 · Moderate
- Hot days now (above 107°F)
- 7 days/yr
- Hot days in 30 yrs
- 21 days/yr
Wind risk 2/10 · Minimal
- Chance of severe wind over 30 yrs
- 2.0%
Air-quality risk 2/10 · Minimal
- Unhealthy air days now
- 0 days/yr
- Unhealthy air days in 30 yrs
- 2 days/yr
Risk factors via First Street. Map © Google.
Why this score? — see what drove the B+ grade
The composite is a weighted blend of 9 inputs, each scored 0–100. Each bar is that input's sub-score; the figure is the points it added to the 100-point composite (weight × sub-score).
- Cash flow +30.0/30.0
- ARV discount +15.0/15.0
- 1% rule +10.0/10.0
- DSCR +10.0/10.0
- Livability +3.2/5.0
- Rent growth +2.5/5.0
- Condition / age +2.5/5.0
- Schools +2.1/10.0
- Appreciation +0.0/10.0
$42,200
🖨 Deal sheet (PDF) 📄 Offer letter ✓ Due diligence
Listing remarks
This 2 bedroom, 1.5 bath house has had several recent updates to it. Work is still needed before it can be moved into. This house has sat vacant for a couple of years without electricity, so the basement was full of water. The seller has rewired the house, some new plumbing, ripped out all the carpet, put in new toilets, light fixtures, outlets, replaced the panes in a couple of broken windows, replaced the sump pump and water heater. Seller added new stairs and updated laundry hookups. The entire house has been painted and the basement has been drained and professionally cleaned. A new front door was also put in to secure the property. The outside HVAC unit is missing from the property and
Key facts
- 6,750 sq ft lot
- Built 1900
- Listed 178 days
Neighborhood map
What this means for you Summary
Snapshot
- This is a 2-bed/1.5-bath other listed at $42k.
Deal economics
- At list price, monthly cash flow is $571 ($7k/yr) — positive.
- The deal already cash-flows at list — no discount required.
- Meets the 1% rule at list price ($1k rent vs $42k).
- Recommended offer: $37k (12.0% below list) — sets the bar for market timing.
- Cap rate 22.5% vs local median 8.5% in Herrin — top-decile yield for the area; either an underpriced asset or a hidden risk that comps aren't pricing in. Stress-test before assuming the spread holds.
Location & tenants
- Location reads 64/100 on livability (#667 in IL) — a middle-class / working-renter tenant base. Strengths: cost of living A+, housing A+, health & safety B; Watch: schools D, crime D-, amenities F.
- Herrin CUSD 4 (suburban): math 22% / reading 27% proficiency, ranked #364 of 620 in IL (top 59%) — low school quality limits family demand, transient renter base, plan for 1-2y turnover.
- Market conditions: 91 active listings in the ZIP; 3 comparable units currently listed for rent nearby; rentals lingering (median 44d on market — plan ~5-8 weeks vacancy on turnover, expect pricing pressure); 100% of comp listings sitting > 30 days — soft ceiling on asking rent; 130 units permitted in Williamson County in 2024 (5 in 5+ unit buildings).
Forward outlook
- Local home prices are declining (-3.0%/yr); year-one equity from $292 of loan paydown is wiped out by about $1k of value loss. Plan a longer hold.
- At projected returns (-3.0% appreciation + 3.0% rent growth), your $12k cash investment doubles in ~2 years — after that, you're playing with house money.
Negotiation context
- It's been on market 179 days — a 12% lower offer ($37k) is reasonable based on typical stale-listing flexibility.
- 5 sale attempts since 26y ago; this cycle's ask has dropped $23k (35%) from the opening price — seller is motivated, your offer sets the floor, not the list.
Risks & watch-outs
- Watch-outs: built in 1900 — expect roof / HVAC / electrical / plumbing capex.
- Climate carrying-cost: extreme-heat days projected 7→21/yr by 2055 (HVAC capex compounding) — expect insurance premiums to compound above CPI over the hold.
Questions for the listing agent
- It's been on market 179 days. Have you received any prior offers? Is the seller open to a 12% concession, seller financing, or rate buy-down credit?
- Built in 1900 — when were the roof, HVAC, electrical panel, plumbing, and water heater last replaced?
- Why hasn't it sold? Are there any deal-killer items the seller is aware of (foundation, flood, title, zoning, code violations)?
- Is there a deadline driving the sale (1031 exchange, divorce, estate, relocation)? That informs how much negotiation room exists.
- Schools are D-rated, which usually means shorter tenancies and higher turnover. Who's the typical renter profile here, and what's been the actual vacancy rate?
- Crime grade is D in this area — have there been break-ins, vandalism, or insurance claims at this property in the last 3 years? What carrier currently insures it and at what premium?
- What's the average days-on-market for RENTAL listings here right now (not sales)? A rising rental-DOM trend means longer vacancies and softer asking-rent achievability than the comps imply.
- What's the recent tenant-quality profile in this submarket — average credit score on applications, eviction rate, late-payment / NSF rate, and stable-employment percentage? A property-management company in the area should have these aggregated.
- How much new for-sale + rental construction is in the pipeline within 1–3 miles? Heavy new supply typically softens prices + rents 12–24 months out; constrained supply supports both.
Investment metrics
- 1% rule
- 2.59% ✓
- Cap rate
- 22.52%
- Cash-on-cash
- 57.94%
- DSCR
- 3.58
- GRM
- 3.2
CMA / ARV
- ARV (median comp)
- $80,444
- List price
- $42,200
- Delta
- -47.54%
- Verdict
- UNDERPRICED
- Comps
- 20 within 1.0 mi
Projected returns pro-forma
-3.0% appreciation · 3.0% rent growth · sell at horizon
- IRR
- 56.5%
- Equity multiple
- 3.50×
- Total profit
- $29,514
- Equity at exit
- $6,292
- IRR
- 61.4%
- Equity multiple
- 7.14×
- Total profit
- $72,555
- Equity at exit
- $3,649
Cash invested: $11,816 (down + closing). Projections, not guarantees.
Landlord ↔ Tenant lean methodology
- Overall (STATE)
- 43 Moderately Tenant-Leaning
- State Illinois
- 43 Moderately Tenant-Leaning · D+7
- County
- — inherits STATE
- City
- — inherits STATE
ZIP-level market 62948
- Home prices YoY
- -34.1%
- Active inventory
- 91
- Price-to-rent
- 3.2×
Monthly cashflow live
- Estimated rent
- $1,091 medium interval (Pro) →
- Mortgage (P&I)
- −$221
- Tax est. 1.5%
- −$53 /mo · $633/yr
- Insurance
- −$18
- HOA
- −$0
- Vacancy / Maint / Mgmt
- −$229
- Net cashflow
- $571
Break-even live
Sensitivity live
| Price | -10% $600 | -5% $585 | +0% $571 | +5% $556 | +10% $541 |
|---|---|---|---|---|---|
| Rent | -10% $484 | -5% $527 | +0% $571 | +5% $614 | +10% $657 |
| Rate | -1.0pp $592 | -0.5pp $581 | base $571 | +0.5pp $560 | +1.0pp $548 |
UW: 25.0% down · 7.5% · 30yr · 1.5% tax · 5.0% vac · 8.0% maint · 8.0% mgmt
Financing live
Cash to close
- Down payment
- $10,550
- Closing costs
- $1,266
- Reserves months
- —
- Total cash needed
- —
Loan-product check · same deal, 3 products live
Conventional
25% down · 7.5% · 30yr
- Down + closing
- —
- Monthly P&I
- —
- Monthly cashflow
- —
- DSCR
- —
- Eligible?
- —
Personal DTI + credit; lowest rate.
DSCR
20% down · 8.5% · 30yr
- Down + closing
- —
- Monthly P&I
- —
- Monthly cashflow
- —
- DSCR
- —
- Eligible?
- —
No personal income docs; deal must DSCR.
Hard money
10% down · 12.0% · 12mo
- Down + closing
- —
- Monthly P&I
- —
- Monthly cashflow
- —
- DSCR
- —
- Eligible?
- —
Short-term bridge; refi at stabilization.
Rent comps 3 comps
| Address | Beds | Baths | Sqft | Rent | $/sqft | DOM | Units | Dist |
|---|---|---|---|---|---|---|---|---|
| 6 Court C Herrin, IL | 2.0 | 1.0 | 900 | $895 | $0.99 | 44d | 1 | 1.06mi |
| 3 Ct D Herrin, IL | 3.0 | 1.0 | 1000 | $1,195 | $1.20 | 44d | 1 | 1.10mi |
| 715 N 35th St Unit D Herrin, IL | 2.0 | 1.0 | 850 | $1,200 | $1.41 | 44d | 1 | 1.27mi |
Listing history 39 events
-
2026-06-19days on market $42,200 Active 179 DOM
-
2026-06-18days on market $42,200 Active 178 DOM
-
2026-06-17days on market $42,200 Active 177 DOM
-
2026-06-16days on market $42,200 Active 176 DOM
-
2026-06-15days on market $42,200 Active 175 DOM
-
2026-06-14days on market $42,200 Active 173 DOM
-
2026-06-13days on market $42,200 Active 172 DOM
-
2026-06-10days on market $42,200 Active 170 DOM
-
2026-06-09days on market $42,200 Active 169 DOM
-
2026-06-08days on market $42,200 Active 168 DOM
-
2026-06-07days on market $42,200 Active 167 DOM
-
2026-06-03days on market $42,200 Active 163 DOM
-
2026-06-02days on market $42,200 Active 162 DOM
-
2026-06-01days on market $42,200 Active 161 DOM
-
2026-05-31days on market $42,200 Active 160 DOM
-
2026-05-30days on market $42,200 Active 159 DOM
-
2026-04-16price $42,200
-
2026-03-05status Active
-
2026-02-28historical
-
2026-01-27price $44,700
-
2026-01-06historical
-
2025-09-02Active
-
2025-09-01historical
-
2025-08-31historical
-
2025-08-12price
-
2025-08-02price
-
2025-06-24price
-
2025-05-20price
-
2025-03-22price
-
2025-03-07price
-
2025-02-03Active
-
2021-08-06historical
-
2006-12-25soldstatus $65,500
-
2006-12-22soldstatus $66,500
-
2006-08-07$65,000
-
2006-08-04historical
-
2000-12-29soldstatus $40,000
-
2000-12-29soldstatus $40,000
-
2000-11-22$45,000
ⓘ Source: listings_history table (triggers on properties + properties_extension) + one-shot
backfill from property_details.listing_events for pre-trigger history.
Climate risk First Street
- Flood 1/10 Low FEMA zone X (unshaded) · 0% chance over 30 yrs
- Wildfire 1/10 Low
- Heat 5/10 Major 7 d/yr ≥107°F today · 21 d/yr by 30 yrs out
- Wind 2/10 Low 2% chance of damaging wind over 30 yrs
- Air quality 2/10 Low 0 unhealthy d/yr today · 2 by 30 yrs out
Nearby sold comps map
Loading sold comps map…
Walkable amenities ~0.75 mi
Loading nearby amenities…
Taxation est. · year 1
- Rental income
- $13,096
- − Mortgage interest
- −$2,364
- − Property taxes
- −$633
- − Insurance
- −$211
- − Repairs & maintenance
- −$1,048
- − Management
- −$1,048
- − Depreciation
- −$1,228
- Taxable income
- $6,565
- Est. tax owed @ 24.0%
- −$1,576
- After-tax cash flow
- $5,270/yr
For passive investors: Depreciation is non-cash, so a rental often shows a tax loss while cash-flowing — sheltering income. Rental losses are passive: they offset passive income freely, and up to $25,000/yr can offset ordinary (W-2) income if you actively participate and your MAGI is under $100k (phasing out to $0 by $150k); unused losses carry forward. On sale, claimed depreciation is recaptured at up to 25%, and gains may owe capital-gains tax (a 1031 exchange can defer both). Figures are a year-1 estimate at your 24.0% rate — not tax advice; consult a CPA.
Schools (NCES district)
- District
- Herrin CUSD 4
- NCES district ID
- 1718810
- Math proficiency
- 22% ▼ -11.00%
- Reading proficiency
- 27% ▼ -17.00%
- Median HH income
- $38,824
- Composite
- 20.56/100
- National rank
- #8558
- State rank
- #364 of 620 in IL
Livability — Herrin
- Score
- 64/100
- State rank
- #667
- US rank
- #13670
Category grades
Schools grade is shown separately in the Schools card above.
Census & demographics
- Census place
- Herrin, IL
- City population
- 12,728
- Population (ZIP)
- 12,728
Population outlook (Williamson County) Hauer SSP2
- Today (2025)
- 69,553 people
- By 2030
- 70,090 · +0.8%
- By 2040
- 70,345 · +1.1%
- By 2050
- 69,394 · -0.2%
- By 2075
- 63,590 · -8.6%
- By 2100
- 51,154 · -26.5%
Race, ethnicity, and origin ACS 2023
- Neighborhood character
- Predominantly White (85%)
- Race & ethnicity
- White 85% Two or more races 8% Black 5% Hispanic / Latino 4% Native American 1%
- Common ancestry
- Romanian 4% Lithuanian 3% Slovak 2%
- Foreign-born
- 3% · Canada
- Languages at home
- 95% English-only · Spanish 3%
Political lean MEDSL · Williamson
- 2024 margin
- Solid R (+38.8) · D 30.0% · R 68.8% · Other 1.3%
- 2008→2024 swing
- -24.0pp toward R · 2008: -14.8pp · 2024: -38.8pp
- All cycles
- 2024: R+38.8 2020: R+37.3 2016: R+41.2 2012: R+25.0 2008: R+14.8
Not yet ingested
- Civics
- —
Market trends
- HPI YoY
- ▼ -67.82%
- Current HPI
- 131.1617
- Rent YoY
- —
- Metro
- —
- State GDP YoY
- ▲ 1.59%
- F500 in state
- 60
Industry mix (Fortune 500 HQ in IL)
| Industry | F500 HQs | Revenue |
|---|---|---|
| Insurance | 4 | $201B |
|
||
| Consumer Goods | 4 | $87B |
|
||
| Industrial Machinery | 3 | $64B |
|
||
| Healthcare | 2 | $55B |
|
||
| Retail / Pharmacy | 1 | $148B |
|
||
| Agriculture / Food | 1 | $86B |
|
||
Price history
-6.2% since first listed23 events — show timeline
- 2026-04-16 Price Changed $42,200 MRED as Distributed by MLS Grid
- 2026-03-05 Relisted — MRED as Distributed by MLS Grid
- 2026-02-28 Listing Removed — MRED as Distributed by MLS Grid
- 2026-01-27 Price Changed $44,700 MRED as Distributed by MLS Grid
- 2026-01-06 Listing Removed — RMLSA as Distributed by MLS Grid
- 2025-09-02 Listed — RMLSA as Distributed by MLS Grid
- 2025-09-01 Listing Removed — RMLSA as Distributed by MLS Grid
- 2025-08-31 Listing Removed — MRED as Distributed by MLS Grid
- 2025-08-12 Price Changed — RMLSA as Distributed by MLS Grid
- 2025-08-02 Price Changed — RMLSA as Distributed by MLS Grid
- 2025-06-24 Price Changed — RMLSA as Distributed by MLS Grid
- 2025-05-20 Price Changed — RMLSA as Distributed by MLS Grid
- 2025-03-22 Price Changed — RMLSA as Distributed by MLS Grid
- 2025-03-07 Price Changed — RMLSA as Distributed by MLS Grid
- 2025-02-03 Listed — RMLSA as Distributed by MLS Grid
- 2021-08-06 Listing Removed — RMLSA as Distributed by MLS Grid
- 2006-12-25 Sold (MLS) $65,500 RMLSA as Distributed by MLS Grid
- 2006-12-22 Sold (Public Records) $66,500 Public Records
- 2006-08-07 Listed $65,000 RMLSA as Distributed by MLS Grid
- 2006-08-04 Listing Removed — MRED as Distributed by MLS Grid
- 2000-12-29 Sold (Public Records) $40,000 Public Records
- 2000-12-29 Sold (MLS) $40,000 RMLSA as Distributed by MLS Grid
- 2000-11-22 Listed $45,000 RMLSA as Distributed by MLS Grid
Property tax history
+6.4%/yrLatest (2025): $2,561 · +2.2% YoY. Source: county tax records.
Cash-flow waterfall
monthlySold comps — $/sqft
last 12 mo · ≤1 miLoading sold comps…