 🏷️ Likely Rental
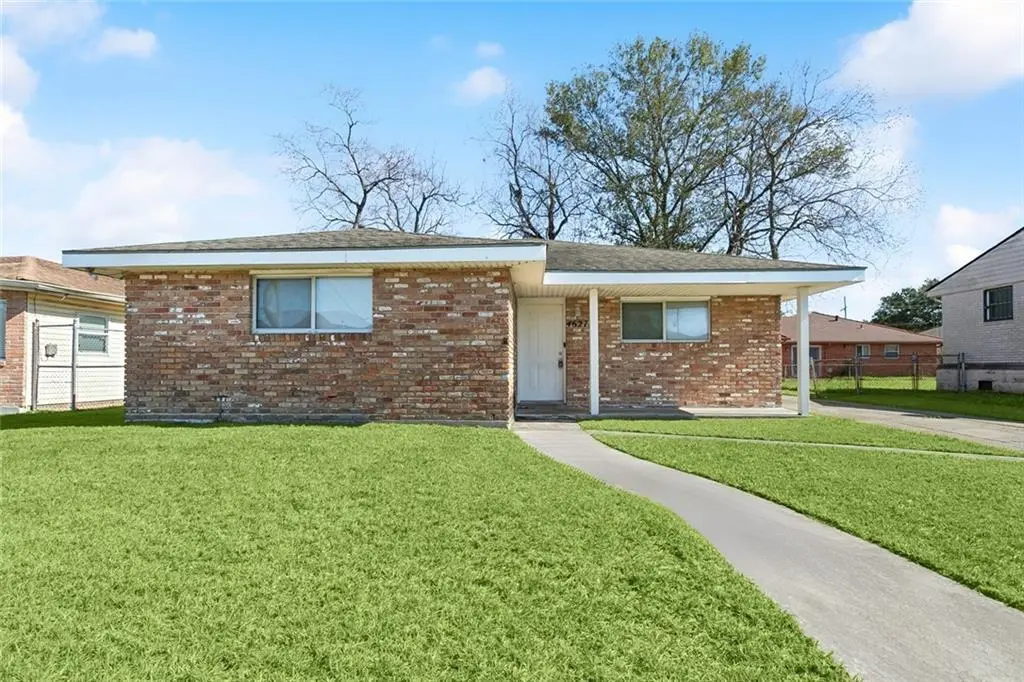
4627 Evangeline Dr · New Orleans, LA
Flood risk 8/10 · Major
- FEMA flood zone
- X (shaded)
- Chance of flooding over 30 yrs
- 0.6%
- Est. flood insurance / yr
- $507 – $1,088
Fire risk 1/10 · Minimal
- Est. fire insurance / yr
- $1,269 – $2,357
Heat risk 10/10 · Severe
- Hot days now (above 107°F)
- 7 days/yr
- Hot days in 30 yrs
- 22 days/yr
Wind risk 10/10 · Severe
- Chance of severe wind over 30 yrs
- 99.0%
Air-quality risk 3/10 · Minor
- Unhealthy air days now
- 3 days/yr
- Unhealthy air days in 30 yrs
- 3 days/yr
Risk factors via First Street. Map © Google.
Why this score? — see what drove the C grade
The composite is a weighted blend of 9 inputs, each scored 0–100. Each bar is that input's sub-score; the figure is the points it added to the 100-point composite (weight × sub-score).
- Cash flow +21.3/30.0
- ARV discount +15.0/15.0
- DSCR +6.8/10.0
- 1% rule +4.9/10.0
- Livability +4.0/5.0
- Rent growth +2.5/5.0
- Condition / age +2.5/5.0
- Schools +1.6/10.0
- Appreciation +0.0/10.0
$145,000
🖨 Deal sheet 📄 Offer letter ✓ Due diligence
Listing remarks MLS
Fantastic opportunity to expand your rental portfolio (section 8 approved property with tenant in place) OR make this charming home your own! * THIS HOME QUALIFIES FOR UP TO 100% FINANCING WITH NO PMI, AND UP TO $6000 IN GRANT FUNDS ASSITANCE through preferred lender program * Precious 3-sided brick home in New Orleans East, nestled on a large lot with ample off-street parking! Fabulous, covered patio, and paved sidewalk entry. This home features tile flooring throughout. Open floor plan living/dining room opens to galley kitchen and laundry room. Large primary bedroom with walk-in closet and ensuite with single vanity and tub/shower combo. Spacious guest bedrooms with large closets. Guest bathroom features single vanity and tub/shower combo. Fantastic, all brick rear patio perfect for entertaining. Large rear yard, fully fenced with chain link fencing. Convenient location with easy access to Chef Menteur Hwy, I-10, restaurants and shopping. No flood insurance required - but current policy of $843/yr can be assumed. Currently tenant occupied at $1500/month. A MUST SEE! Make it yours today!
Key facts
- Large lot
- Covered patio
- Paved sidewalk entry
Tags
Neighborhood map
What this means for you Summary
Snapshot
- This is a 3-bed/2.0-bath single-family listed at $145k.
Deal economics
- At list price, monthly cash flow is $145 ($2k/yr) — positive.
- The deal already cash-flows at list — no discount required.
- To meet the 1% rule (rent ≥ 1% of price), the offer needs to be $143k (1.4% below list).
- Recommended offer: $128k (12.0% below list) — sets the bar for market timing.
- Cap rate 8.0% vs local median 4.4% in New Orleans — top-decile yield for the area; either an underpriced asset or a hidden risk that comps aren't pricing in. Stress-test before assuming the spread holds.
Location & tenants
- Location reads 81/100 on livability (#3 in LA, #1,383 nationally) — a professional / high-income tenant draw. Strengths: amenities A+, commute A+, health & safety A+; Watch: crime C-, employment D.
- Orleans Parish (urban): math 11% / reading 27% proficiency, ranked #69 of 98 in LA (top 70%) — low school quality limits family demand, transient renter base, plan for 1-2y turnover; 68% free/reduced lunch — lower-income household profile, screen leases tightly.
- Market conditions: 128 active listings in the ZIP; 25 comparable units currently listed for rent nearby; rentals at typical pace (median 24d on market — plan ~3-4 weeks tenant-placement turnaround); lower-income renter base — watch delinquency; 710 units permitted in Orleans Parish in 2024 (244 in 5+ unit buildings).
- This rent runs 42% of the median local income ($41k/yr) — at the standard rent-burdened threshold; future hikes will face affordability resistance.
Forward outlook
- Local home prices are declining (-3.0%/yr); year-one equity from $1k of loan paydown is wiped out by about $4k of value loss. Plan a longer hold.
- Orleans County population projected at +61% by 2050 — long-run rental-demand tailwind backs the buy-and-hold thesis.
Negotiation context
- It's been on market 140 days — a 12% lower offer ($128k) is reasonable based on typical stale-listing flexibility.
- 6 sale attempts since 17y ago; this cycle's ask has dropped $10k (6%) from the opening price — seller is motivated, your offer sets the floor, not the list.
- Current owner paid $30k; list at $145k implies a 383% gain — meaningful room to come down on a strong offer.
Risks & watch-outs
- Watch-outs: flood insurance adds $66/mo.
- Climate carrying-cost: severe flood risk; severe wind risk, 99% chance of damaging wind over 30y; extreme-heat days projected 7→22/yr by 2055 (HVAC capex compounding) — expect insurance premiums to compound above CPI over the hold.
Questions for the listing agent
- It's been on market 140 days. Have you received any prior offers? Is the seller open to a 12% concession, seller financing, or rate buy-down credit?
- Built in 1964 — when were the roof, HVAC, electrical panel, plumbing, and water heater last replaced?
- What's the actual annual flood-insurance premium (NFIP or private), and is the property in a SFHA with mandatory coverage?
- Why hasn't it sold? Are there any deal-killer items the seller is aware of (foundation, flood, title, zoning, code violations)?
- Is there a deadline driving the sale (1031 exchange, divorce, estate, relocation)? That informs how much negotiation room exists.
- What's the average days-on-market for RENTAL listings here right now (not sales)? A rising rental-DOM trend means longer vacancies and softer asking-rent achievability than the comps imply.
- What's the recent tenant-quality profile in this submarket — average credit score on applications, eviction rate, late-payment / NSF rate, and stable-employment percentage? A property-management company in the area should have these aggregated.
- How much new for-sale + rental construction is in the pipeline within 1–3 miles? Heavy new supply typically softens prices + rents 12–24 months out; constrained supply supports both.
Investment metrics
- 1% rule
- 0.99% ✗
- Cap rate
- 8.04%
- Cash-on-cash
- 6.26%
- DSCR
- 1.28
- GRM
- 8.5
CMA / ARV
- ARV (median comp)
- $188,612
- List price
- $145,000
- Delta
- -17.82%
- Verdict
- UNDERPRICED
- Comps
- 20 within 1.0 mi
Show comp detail 12 sales within ~0.75 mi
| Address | Dist | Beds/Ba | Sqft | Sold | Price | $/sf | Match |
|---|---|---|---|---|---|---|---|
| 4650 Cerise Ave | 0.13mi | 3/2.0 | 1,144 (-6%) | 8mo | $178,000 | $156 | 78 |
| 4718 Lancelot Dr | 0.36mi | 3/2.0 | 1,144 (-6%) | 4mo | $167,000 | $146 | 70 |
| 4790 Gawain Dr | 0.48mi | 3/2.0 | 1,144 (-6%) | 1mo | $165,000 | $144 | 67 |
| 4651 Lurline St | 0.55mi | 3/2.0 | 1,224 (+1%) | 11mo | $158,000 | $129 | 64 |
| 4734 Galahad Dr | 0.40mi | 3/1.0 | 1,332 (+9%) | 5mo | $105,000 | $79 | 57 |
| 10118 Springwood St | 0.73mi | 3/2.0 | 1,228 (+1%) | 12mo | $167,000 | $136 | 54 |
| 4835 Evangeline Dr | 0.25mi | 3/1.0 | 1,050 (-14%) | 14mo | $135,000 | $129 | 50 |
| 4736 Crowder Blvd | 0.57mi | 3/2.0 | 1,343 (+10%) | 12mo | $157,000 | $117 | 46 |
| 4818 Sandalwood St | 0.61mi | 4/2.0 (+1) | 1,297 (+7%) | 12mo | $170,000 | $131 | 46 |
| 4659 Dodt Ave | 0.70mi | 3/2.0 | 1,072 (-12%) | 2mo | $54,700 | $51 | 46 |
| 4560 Laine Ave | 0.68mi | 2/1.0 (-1) | 1,079 (-11%) | 10mo | $113,000 | $105 | 32 |
| 4429 Laine Ave | 0.68mi | 3/1.0 | 1,035 (-15%) | 13mo | $40,000 | $39 | 28 |
Match score weights: distance 35% · size 25% · config 20% · recency 20%. Top-matched comps best support the ARV.
Projected returns pro-forma
-3.0% appreciation · 3.0% rent growth · sell at horizon
- IRR
- -9.6%
- Equity multiple
- 0.65×
- Total profit
- $-14,235
- Equity at exit
- $21,620
- IRR
- -0.2%
- Equity multiple
- 0.99×
- Total profit
- $-442
- Equity at exit
- $12,537
Cash invested: $40,600 (down + closing). Projections, not guarantees.
Landlord ↔ Tenant lean methodology
- Overall (STATE)
- 90 Strongly Landlord-Friendly
- State Louisiana
- 90 Strongly Landlord-Friendly · R+12
- County
- — inherits STATE
- City
- — inherits STATE
ZIP-level market 70127
- Home prices YoY
- -29.2%
- Active inventory
- 128
- Price-to-rent
- 8.5×
Monthly cashflow live
- Estimated rent
- $1,429 high interval (Pro) →
- Mortgage (P&I)
- −$760
- Tax from tax record
- −$96 /mo · $1,157/yr
- Insurance
- −$60
- Flood insurance flood zone
- −$66 /mo · $798/yr
- HOA
- −$0
- Vacancy / Maint / Mgmt
- −$300
- Net cashflow
- $145
Break-even live
UW: 25.0% down · 7.5% · 30yr · 1.5% tax · 5.0% vac · 8.0% maint · 8.0% mgmt
Financing live
Cash to close
- Down payment
- $36,250
- Closing costs
- $4,350
- Reserves months
- —
- Total cash needed
- —
Loan-product check · same deal, 3 products live
Conventional
25% down · 7.5% · 30yr
- Down + closing
- —
- Monthly P&I
- —
- Monthly cashflow
- —
- DSCR
- —
- Eligible?
- —
Personal DTI + credit; lowest rate.
DSCR
20% down · 8.5% · 30yr
- Down + closing
- —
- Monthly P&I
- —
- Monthly cashflow
- —
- DSCR
- —
- Eligible?
- —
No personal income docs; deal must DSCR.
Hard money
10% down · 12.0% · 12mo
- Down + closing
- —
- Monthly P&I
- —
- Monthly cashflow
- —
- DSCR
- —
- Eligible?
- —
Short-term bridge; refi at stabilization.
Rent comps 25 comps
| Address | Beds | Baths | Sqft | Rent | $/sqft | DOM | Units | Dist |
|---|---|---|---|---|---|---|---|---|
| 5131 Bundy Rd New Orleans, LA | 1.0–3.0 | 1.0–2.0 | 1000 | $1,314 | $1.31 | 2d | 21 | 0.51mi |
| 4574 Dodt Ave Unit A New Orleans, LA | 2.0 | 1.0 | 831 | $1,050 | $1.26 | 23d | 1 | 0.70mi |
| 4761 Eastview Dr New Orleans, LA | 3.0 | 1.0 | 864 | $1,550 | $1.79 | 21d | 1 | 0.75mi |
| 4923 Eastview Dr New Orleans, LA | 3.0 | 2.0 | 912 | $1,400 | $1.54 | 23d | 1 | 0.81mi |
| 4828 Eastview Dr New Orleans, LA | 4.0 | 2.0 | 1260 | $1,675 | $1.33 | 23d | 1 | 0.81mi |
| 4901 Bonita Dr New Orleans, LA | 2.0 | 1.0 | 900 | $1,100 | $1.22 | 23d | 1 | 0.90mi |
| 4808 Viola St New Orleans, LA | 3.0 | 2.0 | 1130 | $1,500 | $1.33 | 23d | 1 | 1.01mi |
| 4880 Viola St New Orleans, LA | 3.0 | 2.0 | 1150 | $1,595 | $1.39 | 23d | 1 | 1.03mi |
| 9020 Bunker Hill Rd New Orleans, LA | 3.0 | 1.5 | 1400 | $1,400 | $1.00 | 23d | 1 | 1.07mi |
| 9022 Bunker Hill Rd New Orleans, LA | 3.0 | 1.5 | 1400 | $1,400 | $1.00 | 23d | 1 | 1.07mi |
| 9040 Bunker Hill Rd New Orleans, LA | 3.0 | 1.5 | 1400 | $1,450 | $1.04 | 16d | 1 | 1.07mi |
| 9042 Bunker Hill Rd New Orleans, LA | 3.0 | 1.5 | 1400 | $1,450 | $1.04 | 16d | 1 | 1.08mi |
| 6881 Parc Brittany Blvd New Orleans, LA | 1.0–2.0 | 1.0–2.0 | 741 | $1,055 | $1.42 | 2d | 31 | 1.14mi |
| 7019 Crowder Blvd Unit 126 New Orleans, LA | 2.0 | 1.5 | 952 | $982 | $1.03 | 23d | 1 | 1.18mi |
| 4701 Rosemont Pl New Orleans, LA | 3.0 | 1.0 | 843 | $1,450 | $1.72 | 23d | 1 | 1.19mi |
| 7502 Chef Menteur Hwy New Orleans, LA | 3.0 | 1.0 | 1000 | $1,500 | $1.50 | 23d | 1 | 1.26mi |
| 7019 Huntington Park Dr New Orleans, LA | 2.0 | 1.5 | 952 | $986 | $1.04 | 23d | 1 | 1.28mi |
| 7019 Huntington Park Dr Unit 21 New Orleans, LA | 2.0 | 1.5 | 952 | $982 | $1.03 | 23d | 1 | 1.28mi |
| 4745 Tulip St New Orleans, LA | 3.0 | 1.0 | 1125 | $1,750 | $1.56 | 20d | 1 | 1.33mi |
| 4941 Pecan St Unit 1 New Orleans, LA | 2.0 | 1.0 | 1000 | $1,200 | $1.20 | 23d | 1 | 1.39mi |
| 6835 Mayo Blvd Unit C New Orleans, LA | 2.0 | 1.5 | 840 | $1,195 | $1.42 | 23d | 1 | 1.41mi |
| 4452 Plum Orchard Ave New Orleans, LA | 2.0 | 1.0 | 1100 | $1,250 | $1.14 | 3d | 1 | 1.44mi |
| 8802 Morrison Rd New Orleans, LA | 2.0 | 1.0 | 1071 | $1,275 | $1.19 | 23d | 1 | 1.45mi |
| 9002 Morrison Rd New Orleans, LA | 2.0 | 1.5 | 1050 | $1,150 | $1.10 | 20d | 1 | 1.45mi |
| 7225 Chef Menteur Hwy New Orleans, LA | 1.0–2.0 | 1.0–2.0 | 739 | $994 | $1.35 | 2d | 10 | 1.49mi |
Listing history 24 events
-
2026-06-18days on market $145,000 Active 140 DOM
-
2026-06-17pricedays on market $145,000 Active 139 DOM
-
2026-06-16days on market $155,000 Active 138 DOM
-
2026-06-15days on market $155,000 Active 137 DOM
-
2026-06-13days on market $155,000 Active 135 DOM
-
2026-06-10days on market $155,000 Active 132 DOM
-
2026-06-09days on market $155,000 Active 131 DOM
-
2026-06-08days on market $155,000 Active 130 DOM
-
2026-06-07days on market $155,000 Active 129 DOM
-
2026-06-05days on market $155,000 Active 126 DOM
-
2026-06-03days on market $155,000 Active 125 DOM
-
2026-06-02days on market $155,000 Active 124 DOM
-
2026-06-01days on market $155,000 Active 123 DOM
-
2026-05-31days on market $155,000 Active 122 DOM
-
2026-01-29$155,000 Active 1108-char remark
Show marketing remark (1104 chars)
Fantastic opportunity to expand your rental portfolio (section 8 approved property with tenant in place) OR make this charming home your own! *THIS HOME QUALIFIES FOR UP TO 100% FINANCING WITH NO PMI, AND UP TO $6000 IN GRANT FUNDS ASSITANCE through preferred lender program* Precious 3-sided brick home in New Orleans East, nestled on a large lot with ample off-street parking! Fabulous, covered patio, and paved sidewalk entry. This home features tile flooring throughout. Open floor plan living/dining room opens to galley kitchen and laundry room. Large primary bedroom with walk-in closet and ensuite with single vanity and tub/shower combo. Spacious guest bedrooms with large closets. Guest bathroom features single vanity and tub/shower combo. Fantastic, all brick rear patio perfect for entertaining. Large rear yard, fully fenced with chain link fencing. Convenient location with easy access to Chef Menteur Hwy, I-10, restaurants and shopping. No flood insurance required - but current policy of $843/yr can be assumed. Currently tenant occupied at $1500/month. A MUST SEE! Make it yours today!
-
2026-01-29$155,000 Active 1104-char remark
Show marketing remark (1104 chars)
Fantastic opportunity to expand your rental portfolio (section 8 approved property with tenant in place) OR make this charming home your own! *THIS HOME QUALIFIES FOR UP TO 100% FINANCING WITH NO PMI, AND UP TO $6000 IN GRANT FUNDS ASSITANCE through preferred lender program* Precious 3-sided brick home in New Orleans East, nestled on a large lot with ample off-street parking! Fabulous, covered patio, and paved sidewalk entry. This home features tile flooring throughout. Open floor plan living/dining room opens to galley kitchen and laundry room. Large primary bedroom with walk-in closet and ensuite with single vanity and tub/shower combo. Spacious guest bedrooms with large closets. Guest bathroom features single vanity and tub/shower combo. Fantastic, all brick rear patio perfect for entertaining. Large rear yard, fully fenced with chain link fencing. Convenient location with easy access to Chef Menteur Hwy, I-10, restaurants and shopping. No flood insurance required - but current policy of $843/yr can be assumed. Currently tenant occupied at $1500/month. A MUST SEE! Make it yours today!
-
2026-01-05historical $1,500
-
2025-12-16$1,500
-
2024-11-17historical $1,500
-
2024-10-08$1,500
-
2010-02-26soldstatus $30,000
-
2009-06-30$39,900
-
2009-06-30$39,900
-
1993-03-31soldstatus $61,000
ⓘ Source: listings_history table (triggers on properties + properties_extension) + one-shot
backfill from property_details.listing_events for pre-trigger history.
Tax reassessment forecast LA · Resets to sale price
- Current annual tax
- $1,157 · $96/mo
- Projected year-2 tax
- $1,157 · $96/mo
- Expected delta
- $0/yr ($0/mo · 0.0%)
ⓘ Screening estimate from a state-policy table — verify with the county assessor before closing.
Climate risk First Street
- Flood 8/10 Severe FEMA zone X (shaded) · 60% chance over 30 yrs
- Wildfire 1/10 Low
- Heat 10/10 Extreme 7 d/yr ≥107°F today · 22 d/yr by 30 yrs out
- Wind 10/10 Extreme 99% chance of damaging wind over 30 yrs
- Air quality 3/10 Moderate 3 unhealthy d/yr today · 3 by 30 yrs out
Nearby sold comps map
Loading sold comps map…
Walkable amenities ~0.75 mi
Loading nearby amenities…
Taxation est. · year 1
- Rental income
- $17,149
- − Mortgage interest
- −$8,122
- − Property taxes
- −$1,157
- − Insurance
- −$1,522
- − Repairs & maintenance
- −$1,372
- − Management
- −$1,372
- − Depreciation
- −$4,218
- Taxable loss
- −$615
- Est. tax savings @ 24.0%
- +$148
- After-tax cash flow
- $1,891/yr
For passive investors: Depreciation is non-cash, so a rental often shows a tax loss while cash-flowing — sheltering income. Rental losses are passive: they offset passive income freely, and up to $25,000/yr can offset ordinary (W-2) income if you actively participate and your MAGI is under $100k (phasing out to $0 by $150k); unused losses carry forward. On sale, claimed depreciation is recaptured at up to 25%, and gains may owe capital-gains tax (a 1031 exchange can defer both). Figures are a year-1 estimate at your 24.0% rate — not tax advice; consult a CPA.
Schools (NCES district)
- District
- Orleans Parish
- NCES district ID
- 2201170
- Math proficiency
- 11% ▼ -52.00%
- Reading proficiency
- 27% ▼ -46.00%
- Median HH income
- $37,011
- Composite
- 15.78/100
- National rank
- #9271
- State rank
- #69 of 98 in LA
Livability — New Orleans
- Score
- 81/100
- State rank
- #3
- US rank
- #1383
Category grades
Schools grade is shown separately in the Schools card above.
Census & demographics
- Census place
- New Orleans, LA
- County
- Orleans Parish · 338,817 people
- City population
- 338,817
- Metro
- New Orleans-Metairie, LA
- Population (ZIP)
- 23,107
- Household income
- $40,765
- Rent vs Own
- Severe rent burden
- 2030.0
Population outlook (Orleans County) Hauer SSP2
- Today (2025)
- 513,025 people
- By 2030
- 575,781 · +12.2%
- By 2040
- 700,174 · +36.5%
- By 2050
- 826,541 · +61.1%
- By 2075
- 1,123,374 · +119.0%
- By 2100
- 1,355,609 · +164.2%
Race, ethnicity, and origin ACS 2023
- Neighborhood character
- Predominantly Black (91%)
- Race & ethnicity
- Black 91% Hispanic / Latino 4% Two or more races 4% White 2%
- Common ancestry
- Lithuanian 1% Hispanic 1%
- Foreign-born
- 3% · Canada, Vietnam
- Languages at home
- 96% English-only · Spanish 2%
Political lean MEDSL · Orleans
- 2024 margin
- Solid D (+67.0) · D 82.2% · R 15.2% · Other 2.7%
- 2008→2024 swing
- +6.7pp toward D · 2008: 60.3pp · 2024: 67.0pp
- All cycles
- 2024: D+67.0 2020: D+68.2 2016: D+66.2 2012: D+62.5 2008: D+60.3
Not yet ingested
- Civics
- —
Market trends
- HPI YoY
- ▼ -72.43%
- Current HPI
- 175.4465
- Rent YoY
- —
- Metro
- New Orleans-Metairie, LA
- State GDP YoY
- ▲ 3.29%
- F500 in state
- 10
Industry mix (Fortune 500 HQ in LA)
| Industry | F500 HQs | Revenue |
|---|---|---|
| Telecommunications | 2 | $23B |
|
||
| Utilities | 1 | $12B |
|
||
| Wholesale / Distribution | 1 | $5B |
|
||
| Advertising | 1 | $2B |
|
||
Price history
+154.1% since first listed10 events — show timeline
- 2026-01-29 Listed $155,000 AcadianaMLS
- 2026-01-29 Listed $155,000 GSREIN
- 2026-01-05 Rental Removed $1,500 BUILDIUM
- 2025-12-16 Listed for Rent $1,500 BUILDIUM
- 2024-11-17 Rental Removed $1,500 BUILDIUM
- 2024-10-08 Listed for Rent $1,500 BUILDIUM
- 2010-02-26 Sold (MLS) $30,000 GSREIN
- 2009-06-30 Listed $39,900 AcadianaMLS
- 2009-06-30 Listed $39,900 GSREIN
- 1993-03-31 Sold (Public Records) $61,000 Public Records
Property tax history
-1.6%/yrLatest (2026): $1,157 · +1.1% YoY. Source: county tax records.
Cash-flow waterfall
monthlySold comps — $/sqft
last 12 mo · ≤1 miLoading sold comps…