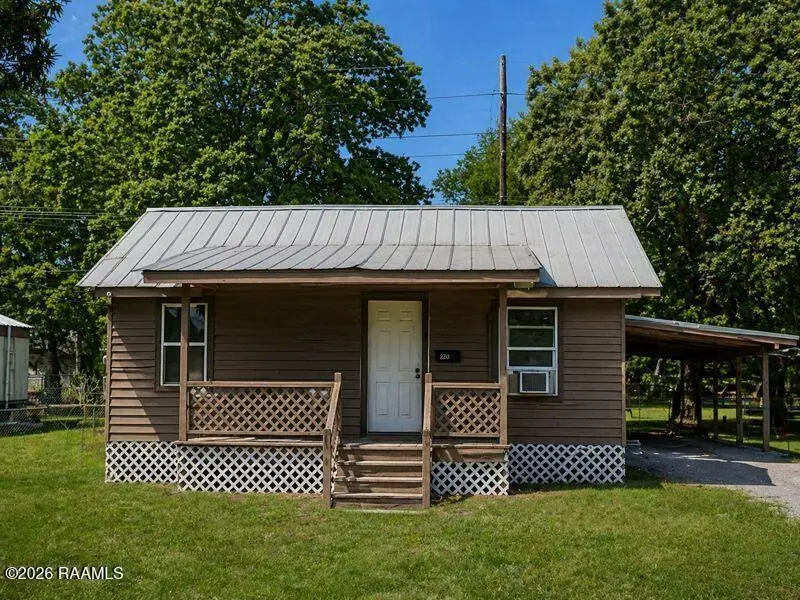
220 S Leonard St · Abbeville, LA
Flood risk 9/10 · Severe
- FEMA flood zone
- X (shaded)
- Chance of flooding over 30 yrs
- 0.99%
- Est. flood insurance / yr
- $507 – $1,088
Fire risk 3/10 · Minor
- Est. fire insurance / yr
- $1,269 – $2,357
Heat risk 10/10 · Severe
- Hot days now (above 108°F)
- 7 days/yr
- Hot days in 30 yrs
- 22 days/yr
Wind risk 9/10 · Severe
- Chance of severe wind over 30 yrs
- 99.0%
Air-quality risk 1/10 · Minimal
- Unhealthy air days now
- 0 days/yr
- Unhealthy air days in 30 yrs
- 0 days/yr
Risk factors via First Street. Map © Google.
Why this score? — see what drove the B- grade
The composite is a weighted blend of 9 inputs, each scored 0–100. Each bar is that input's sub-score; the figure is the points it added to the 100-point composite (weight × sub-score).
- Cash flow +30.0/30.0
- DSCR +10.0/10.0
- 1% rule +7.5/10.0
- ARV discount +7.5/15.0
- Schools +3.9/10.0
- Livability +3.4/5.0
- Rent growth +2.5/5.0
- Condition / age +2.5/5.0
- Appreciation +0.0/10.0
$90,000
🖨 Deal sheet 📄 Offer letter ✓ Due diligence
Listing remarks MLS
This 4-bedroom, 1 1/2 -bath home with over 1500 square feet is located near Mouton Park. This property is located in Flood zone X and does not require flood insurance. As an investment property, this home rented for $800 per month. A perfect addition to your real estate portfolio. Call for your showing today! Owner/Agent.
Key facts
- Tenant occupied
- Solid opportunity
- Rental income
Tags
Property features AI
Exterior
- Parking: Attached carport; 1 covered parking space; Total 1 parking space
- Utilities: Public sewer; City electric
- Home design: Single-family residence
- Construction: Wood siding/frame construction
- Exterior features: Chain link and wood fencing; Metal roof; City street frontage
Interior
- Flooring: Laminate flooring; Tile flooring; Wood laminate flooring
- Bathrooms: 1 full bathroom; 1 half bathroom
- Heating & cooling: Window unit cooling; Has heating (other type)
- Interior features: Built-in features
Neighborhood map
What this means for you Summary
Snapshot
- This is a 4-bed/1.5-bath single-family listed at $90k.
Deal economics
- At list price, monthly cash flow is $290 ($3k/yr) — positive.
- The deal already cash-flows at list — no discount required.
- Meets the 1% rule at list price ($1k rent vs $90k).
- Recommended offer: $87k (3.0% below list) — sets the bar for market timing.
Location & tenants
- Location reads 68/100 on livability (#94 in LA) — a middle-class / working-renter tenant base. Strengths: cost of living A+, housing A+, health & safety A+; Watch: crime F, amenities F, commute F.
- Vermilion Parish (town): math 40% / reading 53% proficiency, ranked #15 of 98 in LA (top 15%) — families likely to look elsewhere, expect single-tenant / working-renter base with shorter leases.
- Zoned schools: James A. Herod Elementary School (math 14% / reading 29%, grade F, #434 of 646 statewide, top 68%, 340 students, 90% FRL); Abbeville High School (math 12% / reading 32%, grade F, #171 of 265 statewide, top 66%, 607 students, 81% FRL) — zoned schools average 85% FRL vs 53% district-wide (32 pts higher); higher-poverty schools than district average — tighter screening recommended.
- Zoned-school proficiency averages 22% at this address vs 46% district-wide (-25 pts) — the specific schools serving this property underperform the Vermilion Parish average; the district grade overstates school quality for this exact location.
- Market conditions: 180 active listings in the ZIP; 2 comparable units currently listed for rent nearby; 228 units permitted in Vermilion Parish in 2024 (0 in 5+ unit buildings).
Forward outlook
- Local home prices are declining (-3.0%/yr); year-one equity from $622 of loan paydown is wiped out by about $3k of value loss. Plan a longer hold.
- Vermilion County population projected at +10% by 2050 — modest demand growth; plan on rents tracking national, not racing it.
- At projected returns (-3.0% appreciation + 3.0% rent growth), your $25k cash investment doubles in ~9 years — after that, you're playing with house money.
Negotiation context
- It's been on market 48 days — a 3% lower offer ($87k) is reasonable based on typical stale-listing flexibility.
- 6 sale attempts since 11y ago with the ask held roughly flat each time — persistent listings suggest the price (not the market) is what's stuck; bring a comps-based counter.
- Current owner paid $50k; list at $90k implies a 80% gain — meaningful room to come down on a strong offer.
Risks & watch-outs
- Watch-outs: flood insurance adds $66/mo.
- Climate carrying-cost: severe flood risk; severe wind risk, 99% chance of damaging wind over 30y; extreme-heat days projected 7→22/yr by 2055 (HVAC capex compounding) — expect insurance premiums to compound above CPI over the hold.
Questions for the listing agent
- It's been on market 48 days. Have you received any prior offers? Is the seller open to a 3% concession, seller financing, or rate buy-down credit?
- What's the actual annual flood-insurance premium (NFIP or private), and is the property in a SFHA with mandatory coverage?
- Is there a deadline driving the sale (1031 exchange, divorce, estate, relocation)? That informs how much negotiation room exists.
- Schools are B-rated — typically a magnet for longer-tenancy family renters. What's the average tenant stay here, and is there a school-zone premium baked into asking?
- Crime grade is F in this area — have there been break-ins, vandalism, or insurance claims at this property in the last 3 years? What carrier currently insures it and at what premium?
- What's the average days-on-market for RENTAL listings here right now (not sales)? A rising rental-DOM trend means longer vacancies and softer asking-rent achievability than the comps imply.
- What's the recent tenant-quality profile in this submarket — average credit score on applications, eviction rate, late-payment / NSF rate, and stable-employment percentage? A property-management company in the area should have these aggregated.
- How much new for-sale + rental construction is in the pipeline within 1–3 miles? Heavy new supply typically softens prices + rents 12–24 months out; constrained supply supports both.
Investment metrics
- 1% rule
- 1.25% ✓
- Cap rate
- 11.04%
- Cash-on-cash
- 16.96%
- DSCR
- 1.75
- GRM
- 6.7
CMA / ARV
- ARV (median comp)
- $56,721
- List price
- $90,000
- Delta
- 58.67%
- Verdict
- OVERPRICED
- Comps
- 20 within 1.0 mi
Show comp detail 5 sales within ~0.75 mi
| Address | Dist | Beds/Ba | Sqft | Sold | Price | $/sf | Match |
|---|---|---|---|---|---|---|---|
| 105 Donald Frederick Blvd | 0.22mi | 3/2.0 (-1) | 1,478 (-6%) | 8mo | $142,500 | $96 | 65 |
| 1722 Michael St | 0.33mi | 3/1.0 (-1) | 1,507 (-5%) | 9mo | $135,000 | $90 | 62 |
| 208 S Guegnon St | 0.52mi | 3/2.0 (-1) | 1,632 (+3%) | 5mo | $174,000 | $107 | 59 |
| 1901 Prairie Ave | 0.44mi | 3/2.0 (-1) | 1,509 (-4%) | 21mo | $99,900 | $66 | 48 |
| 506 S East St | 0.70mi | 3/2.0 (-1) | 1,650 (+4%) | 22mo | $118,000 | $72 | 35 |
Match score weights: distance 35% · size 25% · config 20% · recency 20%. Top-matched comps best support the ARV.
Projected returns pro-forma
-3.0% appreciation · 3.0% rent growth · sell at horizon
- IRR
- 4.0%
- Equity multiple
- 1.15×
- Total profit
- $3,862
- Equity at exit
- $13,419
- IRR
- 13.5%
- Equity multiple
- 2.08×
- Total profit
- $27,119
- Equity at exit
- $7,782
Cash invested: $25,200 (down + closing). Projections, not guarantees.
Landlord ↔ Tenant lean methodology
- Overall (STATE)
- 90 Strongly Landlord-Friendly
- State Louisiana
- 90 Strongly Landlord-Friendly · R+12
- County
- — inherits STATE
- City
- — inherits STATE
ZIP-level market 70510
- Active inventory
- 180
- Price-to-rent
- 6.7×
Monthly cashflow live
- Estimated rent
- $1,122 medium interval (Pro) →
- Mortgage (P&I)
- −$472
- Tax from tax record
- −$21 /mo · $247/yr
- Insurance
- −$38
- Flood insurance flood zone
- −$66 /mo · $798/yr
- HOA
- −$0
- Vacancy / Maint / Mgmt
- −$236
- Net cashflow
- $290
Break-even live
UW: 25.0% down · 7.5% · 30yr · 1.5% tax · 5.0% vac · 8.0% maint · 8.0% mgmt
Financing live
Cash to close
- Down payment
- $22,500
- Closing costs
- $2,700
- Reserves months
- —
- Total cash needed
- —
Loan-product check · same deal, 3 products live
Conventional
25% down · 7.5% · 30yr
- Down + closing
- —
- Monthly P&I
- —
- Monthly cashflow
- —
- DSCR
- —
- Eligible?
- —
Personal DTI + credit; lowest rate.
DSCR
20% down · 8.5% · 30yr
- Down + closing
- —
- Monthly P&I
- —
- Monthly cashflow
- —
- DSCR
- —
- Eligible?
- —
No personal income docs; deal must DSCR.
Hard money
10% down · 12.0% · 12mo
- Down + closing
- —
- Monthly P&I
- —
- Monthly cashflow
- —
- DSCR
- —
- Eligible?
- —
Short-term bridge; refi at stabilization.
Rent comps 2 comps
| Address | Beds | Baths | Sqft | Rent | $/sqft | DOM | Units | Dist |
|---|---|---|---|---|---|---|---|---|
| 407 Nugier St Abbeville, LA | 4.0 | 2.0 | 1374 | $695 | $0.51 | 43d | 1 | 0.95mi |
| 417 Marcia Ave Abbeville, LA | 3.0 | 2.0 | 2000 | $1,700 | $0.85 | 21d | 1 | 1.17mi |
Listing history 29 events
-
2026-06-18days on market $90,000 Active 48 DOM
-
2026-06-17days on market $90,000 Active 47 DOM
-
2026-06-16days on market $90,000 Active 46 DOM
-
2026-06-15days on market $90,000 Active 45 DOM
-
2026-06-14days on market $90,000 Active 43 DOM
-
2026-06-13days on market $90,000 Active 42 DOM
-
2026-06-10days on market $90,000 Active 40 DOM
-
2026-06-09days on market $90,000 Active 39 DOM
-
2026-06-08days on market $90,000 Active 38 DOM
-
2026-06-07days on market $90,000 Active 37 DOM
-
2026-06-03days on market $90,000 Active 33 DOM
-
2026-06-02days on market $90,000 Active 32 DOM
-
2026-06-01days on market $90,000 Active 31 DOM
-
2026-05-31days on market $90,000 Active 30 DOM
-
2026-05-30days on market $90,000 Active 29 DOM
-
2026-05-01$90,000 Active 641-char remark
-
2024-03-21$75,000 Active
-
2023-04-12soldstatus $50,000 Sold
Show marketing remark (325 chars)
This 4-bedroom, 1 1/2 -bath home with over 1500 square feet is located near Mouton Park. This property is located in Flood zone X and does not require flood insurance. As an investment property, this home rented for $800 per month. A perfect addition to your real estate portfolio. Call for your showing today! Owner/Agent.
-
2023-03-09status Pending
Show marketing remark (325 chars)
This 4-bedroom, 1 1/2 -bath home with over 1500 square feet is located near Mouton Park. This property is located in Flood zone X and does not require flood insurance. As an investment property, this home rented for $800 per month. A perfect addition to your real estate portfolio. Call for your showing today! Owner/Agent.
-
2023-03-05price $54,900
Show marketing remark (325 chars)
This 4-bedroom, 1 1/2 -bath home with over 1500 square feet is located near Mouton Park. This property is located in Flood zone X and does not require flood insurance. As an investment property, this home rented for $800 per month. A perfect addition to your real estate portfolio. Call for your showing today! Owner/Agent.
-
2023-02-13price $59,900
Show marketing remark (325 chars)
This 4-bedroom, 1 1/2 -bath home with over 1500 square feet is located near Mouton Park. This property is located in Flood zone X and does not require flood insurance. As an investment property, this home rented for $800 per month. A perfect addition to your real estate portfolio. Call for your showing today! Owner/Agent.
-
2023-01-19price $62,000
Show marketing remark (325 chars)
This 4-bedroom, 1 1/2 -bath home with over 1500 square feet is located near Mouton Park. This property is located in Flood zone X and does not require flood insurance. As an investment property, this home rented for $800 per month. A perfect addition to your real estate portfolio. Call for your showing today! Owner/Agent.
-
2022-12-08price $69,000
Show marketing remark (325 chars)
This 4-bedroom, 1 1/2 -bath home with over 1500 square feet is located near Mouton Park. This property is located in Flood zone X and does not require flood insurance. As an investment property, this home rented for $800 per month. A perfect addition to your real estate portfolio. Call for your showing today! Owner/Agent.
-
2022-11-11$75,000 Active
Show marketing remark (325 chars)
This 4-bedroom, 1 1/2 -bath home with over 1500 square feet is located near Mouton Park. This property is located in Flood zone X and does not require flood insurance. As an investment property, this home rented for $800 per month. A perfect addition to your real estate portfolio. Call for your showing today! Owner/Agent.
-
2016-12-05soldstatus $27,500
-
2016-10-17$29,000
-
2016-03-01soldstatus $12,900
-
2015-12-14$12,900
-
2015-07-17$16,600
ⓘ Source: listings_history table (triggers on properties + properties_extension) + one-shot
backfill from property_details.listing_events for pre-trigger history.
Tax reassessment forecast LA · Resets to sale price
- Current annual tax
- $247 · $21/mo
- Projected year-2 tax
- $495 · $41/mo
- Expected delta
- +$248/yr (+$21/mo · 100.5%)
ⓘ Screening estimate from a state-policy table — verify with the county assessor before closing.
Climate risk First Street
- Flood 9/10 Extreme FEMA zone X (shaded) · 99% chance over 30 yrs
- Wildfire 3/10 Moderate
- Heat 10/10 Extreme 7 d/yr ≥108°F today · 22 d/yr by 30 yrs out
- Wind 9/10 Extreme 99% chance of damaging wind over 30 yrs
- Air quality 1/10 Low 0 unhealthy d/yr today · 0 by 30 yrs out
Nearby sold comps map
Loading sold comps map…
Walkable amenities ~0.75 mi
Loading nearby amenities…
Taxation est. · year 1
- Rental income
- $13,460
- − Mortgage interest
- −$5,041
- − Property taxes
- −$247
- − Insurance
- −$1,248
- − Repairs & maintenance
- −$1,077
- − Management
- −$1,077
- − Depreciation
- −$2,618
- Taxable income
- $2,152
- Est. tax owed @ 24.0%
- −$517
- After-tax cash flow
- $2,959/yr
For passive investors: Depreciation is non-cash, so a rental often shows a tax loss while cash-flowing — sheltering income. Rental losses are passive: they offset passive income freely, and up to $25,000/yr can offset ordinary (W-2) income if you actively participate and your MAGI is under $100k (phasing out to $0 by $150k); unused losses carry forward. On sale, claimed depreciation is recaptured at up to 25%, and gains may owe capital-gains tax (a 1031 exchange can defer both). Figures are a year-1 estimate at your 24.0% rate — not tax advice; consult a CPA.
Schools (NCES district)
- District
- Vermilion Parish
- NCES district ID
- 2201800
- Math proficiency
- 40% ▼ -38.00%
- Reading proficiency
- 53% ▼ -32.00%
- Median HH income
- $45,115
- Composite
- 39.37/100
- National rank
- #3974
- State rank
- #15 of 98 in LA
Livability — Abbeville
- Score
- 68/100
- State rank
- #94
- US rank
- #9800
Category grades
Schools grade is shown separately in the Schools card above.
Census & demographics
- Census place
- Abbeville, LA
- Population (ZIP)
- 23,909
Population outlook (Vermilion County) Hauer SSP2
- Today (2025)
- 64,095 people
- By 2030
- 65,915 · +2.8%
- By 2040
- 68,985 · +7.6%
- By 2050
- 70,804 · +10.5%
- By 2075
- 73,897 · +15.3%
- By 2100
- 71,793 · +12.0%
Race, ethnicity, and origin ACS 2023
- Neighborhood character
- Majority White (65%)
- Race & ethnicity
- White 65% Black 24% Two or more races 4% Hispanic / Latino 4% Asian 4%
- Common ancestry
- Lithuanian 15% Italian 1%
- Foreign-born
- 5% · Vietnam, Canada
- Languages at home
- 87% English-only · French/Haitian/Cajun 6% Vietnamese 3% Spanish 2%
Political lean MEDSL · Vermilion
- 2024 margin
- Solid R (+63.8) · D 17.6% · R 81.4% · Other 1.1%
- 2008→2024 swing
- -16.3pp toward R · 2008: -47.5pp · 2024: -63.8pp
- All cycles
- 2024: R+63.8 2020: R+61.9 2016: R+59.6 2012: R+52.8 2008: R+47.5
Not yet ingested
- Civics
- —
Market trends
- HPI YoY
- ▼ -70.44%
- Current HPI
- 97.6131
- Rent YoY
- —
- Metro
- —
- State GDP YoY
- ▲ 3.29%
- F500 in state
- 10
Industry mix (Fortune 500 HQ in LA)
| Industry | F500 HQs | Revenue |
|---|---|---|
| Telecommunications | 2 | $23B |
|
||
| Utilities | 1 | $12B |
|
||
| Wholesale / Distribution | 1 | $5B |
|
||
| Advertising | 1 | $2B |
|
||
Price history
+442.2% since first listed14 events — show timeline
- 2026-05-01 Listed $90,000 AcadianaMLS
- 2024-03-21 Listed $75,000 AcadianaMLS
- 2023-04-12 Sold (MLS) $50,000 AcadianaMLS
- 2023-03-09 Pending — AcadianaMLS
- 2023-03-05 Price Changed $54,900 AcadianaMLS
- 2023-02-13 Price Changed $59,900 AcadianaMLS
- 2023-01-19 Price Changed $62,000 AcadianaMLS
- 2022-12-08 Price Changed $69,000 AcadianaMLS
- 2022-11-11 Listed $75,000 AcadianaMLS
- 2016-12-05 Sold (MLS) $27,500 AcadianaMLS
- 2016-10-17 Listed $29,000 AcadianaMLS
- 2016-03-01 Sold (MLS) $12,900 AcadianaMLS
- 2015-12-14 Listed $12,900 AcadianaMLS
- 2015-07-17 Listed $16,600 AcadianaMLS
Property tax history
+1.6%/yrLatest (2025): $247 · -0.3% YoY. Source: county tax records.
Cash-flow waterfall
monthlySold comps — $/sqft
last 12 mo · ≤1 miLoading sold comps…