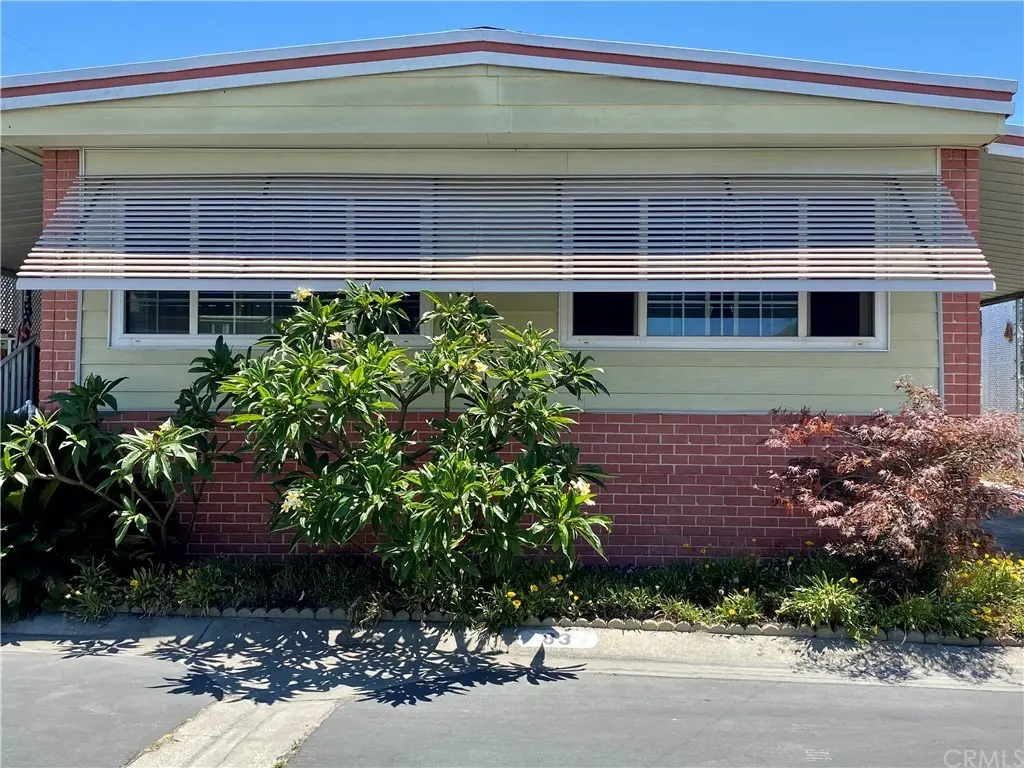
11250 Beach Blvd #83 · Stanton, CA
Flood risk 1/10 · Minimal
- FEMA flood zone
- X (shaded)
- Chance of flooding over 30 yrs
- 0.0%
- Est. flood insurance / yr
- $507 – $1,088
Fire risk 1/10 · Minimal
- Est. fire insurance / yr
- $659 – $1,223
Heat risk 5/10 · Moderate
- Hot days now (above 89°F)
- 7 days/yr
- Hot days in 30 yrs
- 23 days/yr
Wind risk 1/10 · Minimal
- Chance of severe wind over 30 yrs
- —
Air-quality risk 5/10 · Moderate
- Unhealthy air days now
- 7 days/yr
- Unhealthy air days in 30 yrs
- 8 days/yr
Risk factors via First Street. Map © Google.
Why this score? — see what drove the B grade
The composite is a weighted blend of 9 inputs, each scored 0–100. Each bar is that input's sub-score; the figure is the points it added to the 100-point composite (weight × sub-score).
- Cash flow +30.0/30.0
- 1% rule +10.0/10.0
- DSCR +10.0/10.0
- ARV discount +8.6/15.0
- Schools +4.5/10.0
- Livability +3.2/5.0
- Rent growth +3.1/5.0
- Condition / age +2.5/5.0
- Appreciation +0.0/10.0
$135,000
🖨 Deal sheet 📄 Offer letter ✓ Due diligence
Listing remarks
Plaza Pines Senior Mobile Home Park, Residents MUST BE 55 YEARS OR OLDER. This Community Is One of Orange County's Affordable Senior Parks. Professionally Maintained With On Site Manager. This Community Is Quiet and Located Close To Shopping, Entertainment and Medical facilities. For sale Is A 2 Bedroom 1 3/4 Bath Home. The Home Has Large Bright Front Windows facing West. Living Room Is Large With Laminate Flooring And Is Open To The Dining Room. A Stone Kitchen Island, Stone Kitchen Counters and Stainless Sink. Bonus Room/Den With Sliding Door Leading To Large Covered Porch Area. Two Large Bedrooms With Walk-In Closets. Master Bedroom Has En-Suite Bathroom . ..
Key facts
- On site manager
- Close to shopping
- Quiet community
Tags
Neighborhood map
What this means for you Summary
Snapshot
- This is a 2-bed/2.0-bath manufactured listed at $135k.
Deal economics
- At list price, monthly cash flow is $2k ($18k/yr) — positive.
- The deal already cash-flows at list — no discount required.
- Meets the 1% rule at list price ($3k rent vs $135k).
- Cap rate 20.0% vs local median 2.5% in Stanton — top-decile yield for the area; either an underpriced asset or a hidden risk that comps aren't pricing in. Stress-test before assuming the spread holds.
Location & tenants
- Location reads 63/100 on livability (#468 in CA) — a middle-class / working-renter tenant base. Strengths: commute A+; Watch: schools C-, amenities D, health & safety D.
- Garden Grove Unified (suburban): math 38% / reading 65% proficiency, ranked #132 of 517 in CA (top 26%) — acceptable for families but not a draw, mixed tenant base, ~2y average lease; 60% free/reduced lunch — lower-income household profile, screen leases tightly.
- Market conditions: Rents rising (+2.3%/yr); 48 active listings in the ZIP; 40 comparable units currently listed for rent nearby; rentals leasing fast (median 3d on market — plan ~1-2 weeks tenant-placement turnaround); solid renter incomes; 6,974 units permitted in Orange County in 2024 (3,839 in 5+ unit buildings).
- This rent runs 44% of the median local income ($86k/yr) — at the standard rent-burdened threshold; future hikes will face affordability resistance.
Forward outlook
- Local home prices are declining (-3.0%/yr); year-one equity from $933 of loan paydown is wiped out by about $4k of value loss. Plan a longer hold.
- Orange County population projected at +14% by 2050 — modest demand growth; plan on rents tracking national, not racing it.
- At projected returns (-3.0% appreciation + 2.3% rent growth), your $38k cash investment doubles in ~3 years — after that, you're playing with house money.
Negotiation context
- Only 6 days on market — expect competitive offers; lowballing is unlikely to land.
- 8 sale attempts since 7y ago; this cycle's ask has dropped $14k (9%) from the opening price — seller is motivated, your offer sets the floor, not the list.
Risks & watch-outs
- Climate carrying-cost: extreme-heat days projected 7→23/yr by 2055 (HVAC capex compounding) — expect insurance premiums to compound above CPI over the hold.
Questions for the listing agent
- Built in 1971 — when were the roof, HVAC, electrical panel, plumbing, and water heater last replaced?
- Is there a deadline driving the sale (1031 exchange, divorce, estate, relocation)? That informs how much negotiation room exists.
- Crime grade is D in this area — have there been break-ins, vandalism, or insurance claims at this property in the last 3 years? What carrier currently insures it and at what premium?
- What's the average days-on-market for RENTAL listings here right now (not sales)? A rising rental-DOM trend means longer vacancies and softer asking-rent achievability than the comps imply.
- What's the recent tenant-quality profile in this submarket — average credit score on applications, eviction rate, late-payment / NSF rate, and stable-employment percentage? A property-management company in the area should have these aggregated.
- How much new for-sale + rental construction is in the pipeline within 1–3 miles? Heavy new supply typically softens prices + rents 12–24 months out; constrained supply supports both.
Investment metrics
- 1% rule
- 2.32% ✓
- Cap rate
- 19.97%
- Cash-on-cash
- 48.86%
- DSCR
- 3.17
- GRM
- 3.6
CMA / ARV
- ARV (median comp)
- $138,419
- List price
- $135,000
- Delta
- -2.47%
- Verdict
- FAIR
- Comps
- 20 within 1.0 mi
Show comp detail 12 sales within ~0.75 mi
| Address | Dist | Beds/Ba | Sqft | Sold | Price | $/sf | Match |
|---|---|---|---|---|---|---|---|
| 11250 Beach Blvd #122 | 0.00mi | 2/2.0 | 1,440 (0%) | 13mo | $149,900 | $104 | 89 |
| 11250 Beach Blvd #11 | 0.01mi | 2/2.0 | 1,440 (0%) | 17mo | $140,000 | $97 | 85 |
| 11250 Beach Blvd #2 | 0.03mi | 2/2.0 | 1,536 (+7%) | 6mo | $125,000 | $81 | 82 |
| 11250 Beach Blvd #108 | 0.02mi | 2/2.0 | 1,536 (+7%) | 10mo | $150,000 | $98 | 80 |
| 11250 Beach Blvd #119 | 0.01mi | 2/2.0 | 1,536 (+7%) | 12mo | $120,000 | $78 | 79 |
| 11250 Beach Blvd Blvd #23 | 0.00mi | 2/2.0 | 1,344 (-7%) | 20mo | $183,000 | $136 | 72 |
| 11250 Beach Blvd #73 | 0.00mi | 2/2.0 | 1,248 (-13%) | 20mo | $193,000 | $155 | 61 |
| 8681 Katella Ave #898 | 0.58mi | 3/2.0 (+1) | 1,440 (0%) | 9mo | $230,000 | $160 | 61 |
| 10800 Dale Ave #125 | 0.55mi | 3/2.0 (+1) | 1,440 (0%) | 11mo | $222,500 | $155 | 60 |
| 8681 Katella Ave #865 | 0.58mi | 3/2.0 (+1) | 1,440 (0%) | 20mo | $285,000 | $198 | 51 |
| 10800 Dale Ave #705 | 0.55mi | 3/2.0 (+1) | 1,248 (-13%) | 5mo | $197,500 | $158 | 43 |
| 10800 Dale Ave #131 | 0.55mi | 3/2.0 (+1) | 1,296 (-10%) | 15mo | $259,000 | $200 | 40 |
Match score weights: distance 35% · size 25% · config 20% · recency 20%. Top-matched comps best support the ARV.
Projected returns pro-forma
-3.0% appreciation · 2.33% rent growth · sell at horizon
- IRR
- 45.7%
- Equity multiple
- 2.96×
- Total profit
- $74,101
- Equity at exit
- $20,129
- IRR
- 51.2%
- Equity multiple
- 5.83×
- Total profit
- $182,457
- Equity at exit
- $11,672
Cash invested: $37,800 (down + closing). Projections, not guarantees.
Landlord ↔ Tenant lean methodology
- Overall (STATE)
- 18 Strongly Tenant-Friendly
- State California
- 18 Strongly Tenant-Friendly · D+13
- County
- — inherits STATE
- City
- — inherits STATE
ZIP-level market 90680
- Rents YoY
- 2.3%
- Active inventory
- 48
- Price-to-rent
- 3.6×
Monthly cashflow live
- Estimated rent
- $3,129 high interval (Pro) →
- Mortgage (P&I)
- −$708
- Tax est. 1.5%
- −$169 /mo · $2,025/yr
- Insurance
- −$56
- HOA
- −$0
- Vacancy / Maint / Mgmt
- −$657
- Net cashflow
- $1,539
Break-even live
UW: 25.0% down · 7.5% · 30yr · 1.5% tax · 5.0% vac · 8.0% maint · 8.0% mgmt
Financing live
Cash to close
- Down payment
- $33,750
- Closing costs
- $4,050
- Reserves months
- —
- Total cash needed
- —
Loan-product check · same deal, 3 products live
Conventional
25% down · 7.5% · 30yr
- Down + closing
- —
- Monthly P&I
- —
- Monthly cashflow
- —
- DSCR
- —
- Eligible?
- —
Personal DTI + credit; lowest rate.
DSCR
20% down · 8.5% · 30yr
- Down + closing
- —
- Monthly P&I
- —
- Monthly cashflow
- —
- DSCR
- —
- Eligible?
- —
No personal income docs; deal must DSCR.
Hard money
10% down · 12.0% · 12mo
- Down + closing
- —
- Monthly P&I
- —
- Monthly cashflow
- —
- DSCR
- —
- Eligible?
- —
Short-term bridge; refi at stabilization.
Rent comps 40 comps
| Address | Beds | Baths | Sqft | Rent | $/sqft | DOM | Units | Dist |
|---|---|---|---|---|---|---|---|---|
| 11250 Dale St Garden Grove, CA | 1.0–2.0 | 1.0–2.0 | 848 | $2,710 | $3.20 | 2d | 9 | 0.40mi |
| 7684 Ruthann Ave Stanton, CA | 3.0 | 2.0 | 1000 | $3,650 | $3.65 | 3d | 1 | 0.48mi |
| 8052 Fillmore Dr Apt 3 Stanton, CA | 2.0 | 1.5 | 1000 | $2,250 | $2.25 | 2d | 1 | 0.65mi |
| 7545 Katella Ave Stanton, CA | 1.0–2.0 | 1.0 | 900 | $3,053 | $3.39 | 1d | 7 | 0.74mi |
| 8300 Chapman Ave Stanton, CA | 1.0–2.0 | 1.0 | 860 | $2,545 | $2.96 | 1d | 9 | 0.80mi |
| 7765 Beechwood Way Stanton, CA | 3.0 | 1.5 | 1232 | $3,750 | $3.04 | 1d | 1 | 0.84mi |
| 11893 Macduff St Garden Grove, CA | 3.0 | 2.0 | 1200 | $3,100 | $2.58 | 24d | 1 | 0.84mi |
| 12101 Dale Ave #80 Stanton, CA | 3.0 | 2.0 | 1493 | $1,500 | $1.00 | 7d | 1 | 0.87mi |
| 10743 Magnolia Ave #101 Anaheim, CA | 2.0 | 2.0 | 913 | $2,500 | $2.74 | 1d | 1 | 0.90mi |
| 10600 Western Ave Stanton, CA | 2.0 | 1.0–2.0 | 915 | $2,475 | $2.70 | 1d | 2 | 0.90mi |
| 9014 Stacie Ln #28 Anaheim, CA | 3.0 | 2.0 | 1347 | $3,095 | $2.30 | 1d | 1 | 0.94mi |
| 12221 Beach Blvd Garden Grove, CA | 1.0–2.0 | 1.0–2.0 | 900 | $2,825 | $3.14 | 15d | 6 | 0.96mi |
| 33 Bigsby Dr Stanton, CA | 3.0 | 3.5 | 1625 | $3,950 | $2.43 | 43d | 1 | 0.97mi |
| 35 Bigsby Dr Stanton, CA | 3.0 | 3.0 | 1355 | $4,000 | $2.95 | 24d | 1 | 0.97mi |
| 3 Bigsby Dr Stanton, CA | 3.0 | 3.0 | 1355 | $3,950 | $2.92 | 17d | 1 | 0.97mi |
| 8853 Stardust Ln Anaheim, CA | 3.0 | 1.5 | 1126 | $3,875 | $3.44 | 3d | 1 | 0.97mi |
| 8882 W Cerritos Ave Anaheim, CA | 2.0 | 1.0 | 980 | $2,495 | $2.55 | 1d | 1 | 1.05mi |
| 9313 Marchand Ave Garden Grove, CA | 3.0 | 3.0 | 1200 | $4,500 | $3.75 | 5d | 1 | 1.07mi |
| 10321 Courtright Rd Stanton, CA | 3.0 | 2.0 | 1202 | $3,700 | $3.08 | 22d | 1 | 1.08mi |
| 10361 Iona Way Stanton, CA | 3.0 | 1.5 | 1149 | $3,500 | $3.05 | 1d | 1 | 1.08mi |
| 12345 Beach Blvd Stanton, CA | 2.0 | 1.0–2.0 | 765 | $3,675 | $4.80 | 2d | 35 | 1.11mi |
| 12312 Louise St Garden Grove, CA | 3.0 | 2.0 | 1300 | $3,500 | $2.69 | 24d | 1 | 1.13mi |
| 12381 Arrowhead St Stanton, CA | 1.0–2.0 | 1.0 | 1000 | $2,568 | $2.57 | 20d | 1 | 1.14mi |
| 10250 Masterson Ave Stanton, CA | 3.0 | 2.0 | 1590 | $3,750 | $2.36 | 1d | 1 | 1.16mi |
| 8155 Carmel Dr Stanton, CA | 3.0 | 2.0 | 1148 | $3,500 | $3.05 | 43d | 1 | 1.17mi |
| 1235 Sharon Cir Unit 1231 F2 Anaheim, CA | 2.0 | 2.0 | 910 | $2,495 | $2.74 | 15d | 1 | 1.23mi |
| 2828 W Ball Rd Anaheim, CA | 2.0 | 1.0–2.0 | 880 | $2,760 | $3.14 | 1d | 3 | 1.23mi |
| 2828 W Ball Rd Unit N-36 Anaheim, CA | 2.0 | 2.0 | 880 | $2,795 | $3.18 | 17d | 1 | 1.24mi |
| 2828 W Ball Rd Unit G-11 Anaheim, CA | 2.0 | 2.0 | 880 | $2,850 | $3.24 | 17d | 1 | 1.24mi |
| 2828 W Ball Rd Unit D-10 Anaheim, CA | 2.0 | 2.0 | 880 | $2,805 | $3.19 | 17d | 1 | 1.24mi |
| 2880 W Ball Rd Anaheim, CA | 1.0–2.0 | 1.0 | 894 | $2,850 | $3.19 | 1d | 5 | 1.25mi |
| 10511 Lexington St Unit C Stanton, CA | 2.0 | 1.5 | 900 | $2,300 | $2.56 | 1d | 1 | 1.25mi |
| 2771 W Ball Rd Anaheim, CA | 2.0 | 1.5 | 900 | $2,350 | $2.61 | 1d | 1 | 1.33mi |
| 11466 Pinckney Way Cypress, CA | 3.0 | 2.5 | 1800 | $3,900 | $2.17 | 13d | 1 | 1.35mi |
| 11466 Pinckney Way Cypress, CA | 3.0 | 2.5 | 1799 | $3,900 | $2.17 | 3d | 1 | 1.35mi |
| 2648 W Ball Rd Anaheim, CA | 1.0–2.0 | 1.0–2.0 | 843 | $2,600 | $3.08 | 1d | 1 | 1.36mi |
| 7802 Samura Pl Garden Grove, CA | 1.0–2.0 | 1.0 | 869 | $2,465 | $2.84 | 2d | 4 | 1.37mi |
| 3208 W Ravenswood Dr Anaheim, CA | 3.0 | 2.0 | 1636 | $4,000 | $2.44 | 12d | 1 | 1.37mi |
| 7051 Cerritos Ave Stanton, CA | 2.0 | 1.0 | 1000 | $2,545 | $2.54 | 1d | 1 | 1.40mi |
| 12621 Adelle St Garden Grove, CA | 2.0 | 2.0 | 900 | $2,650 | $2.94 | 19d | 1 | 1.44mi |
Listing history 30 events
-
2026-06-18days on market $135,000 Active 6 DOM
-
2026-06-17days on market $135,000 Active 5 DOM
-
2026-06-16days on market $135,000 Active 4 DOM
-
2026-06-15days on market $135,000 Active 3 DOM
-
2026-06-13statusdays on market $135,000 Active 1 DOM
-
2026-05-14historical
-
2026-03-31price $135,000
-
2026-02-13price $144,900
-
2026-01-14$148,500 Active
-
2025-12-17historical
-
2025-09-15status Active
-
2025-08-29historical Active Under Contract
-
2025-08-10$152,000 Active
-
2025-07-31historical
-
2025-07-13price $152,000
-
2025-06-01price $154,900
-
2025-01-14$159,999 Active
-
2024-11-18historical
-
2024-06-15price $165,000
-
2024-06-13status Active
-
2024-06-08historical Active Under Contract
-
2024-05-13$169,900 Active
-
2022-08-25soldstatus $128,000 Closed Sale
-
2022-08-19status Pending Sale
-
2022-07-18historical Active Under Contract
-
2022-07-10$128,000 Active
-
2022-07-06historical $128,000
-
2020-01-15historical
-
2019-08-08price $95,000
-
2019-07-15$85,000 Active
ⓘ Source: listings_history table (triggers on properties + properties_extension) + one-shot
backfill from property_details.listing_events for pre-trigger history.
Climate risk First Street
- Flood 1/10 Low FEMA zone X (shaded) · 0% chance over 30 yrs
- Wildfire 1/10 Low
- Heat 5/10 Major 7 d/yr ≥89°F today · 23 d/yr by 30 yrs out
- Wind 1/10 Low
- Air quality 5/10 Major 7 unhealthy d/yr today · 8 by 30 yrs out
Nearby sold comps map
Loading sold comps map…
Walkable amenities ~0.75 mi
Loading nearby amenities…
Taxation est. · year 1
- Rental income
- $37,550
- − Mortgage interest
- −$7,562
- − Property taxes
- −$2,025
- − Insurance
- −$675
- − Repairs & maintenance
- −$3,004
- − Management
- −$3,004
- − Depreciation
- −$3,927
- Taxable income
- $17,353
- Est. tax owed @ 24.0%
- −$4,165
- After-tax cash flow
- $14,304/yr
For passive investors: Depreciation is non-cash, so a rental often shows a tax loss while cash-flowing — sheltering income. Rental losses are passive: they offset passive income freely, and up to $25,000/yr can offset ordinary (W-2) income if you actively participate and your MAGI is under $100k (phasing out to $0 by $150k); unused losses carry forward. On sale, claimed depreciation is recaptured at up to 25%, and gains may owe capital-gains tax (a 1031 exchange can defer both). Figures are a year-1 estimate at your 24.0% rate — not tax advice; consult a CPA.
Schools (NCES district)
- District
- Garden Grove Unified
- NCES district ID
- 0614880
- Math proficiency
- 38% ▼ -14.00%
- Reading proficiency
- 65% ▲ 4.00%
- Median HH income
- $60,089
- Composite
- 44.89/100
- National rank
- #2715
- State rank
- #132 of 517 in CA
Livability — Stanton
- Score
- 63/100
- State rank
- #468
- US rank
- #15945
Category grades
Schools grade is shown separately in the Schools card above.
Census & demographics
- Census place
- Stanton, CA
- County
- Orange County · 3,096,323 people
- City population
- 31,991
- Metro
- Los Angeles-Long Beach-Anaheim, CA
- Population (ZIP)
- 31,991
- Household income
- $85,592
- Rent vs Own
- Severe rent burden
- 1745.0
Population outlook (Orange County) Hauer SSP2
- Today (2025)
- 3,477,456 people
- By 2030
- 3,613,117 · +3.9%
- By 2040
- 3,835,945 · +10.3%
- By 2050
- 3,968,736 · +14.1%
- By 2075
- 4,097,053 · +17.8%
- By 2100
- 3,903,633 · +12.3%
Race, ethnicity, and origin ACS 2023
- Neighborhood character
- Diverse neighborhood (Simpson 0.64)
- Race & ethnicity
- Hispanic / Latino 50% Asian 27% White 17% Two or more races 12% Black 2% Native American 1%
- Hispanic origin (detail)
- Mexican 42%
- Common ancestry
- Italian 1% Iranian 0%
- Foreign-born
- 42% · Canada, Vietnam, South Korea
- Languages at home
- 35% English-only · Spanish 39% Vietnamese 17% Tagalog/Filipino 2%
Political lean MEDSL · Orange
- 2024 margin
- Toss-up / Even · D 49.7% · R 47.1% · Other 3.2%
- 2008→2024 swing
- +5.2pp toward D · 2008: -2.6pp · 2024: 2.6pp
- All cycles
- 2024: D+2.6 2020: D+9.0 2016: D+7.7 2012: R+8.3 2008: R+2.6
Not yet ingested
- Civics
- —
Market trends
- HPI YoY
- ▼ -529.54%
- Current HPI
- 447.9557
- Rent YoY
- ▲ 2.33%
- Metro
- Los Angeles-Long Beach-Anaheim, CA
- State GDP YoY
- ▲ 3.21%
- F500 in state
- 116
Industry mix (Fortune 500 HQ in CA)
| Industry | F500 HQs | Revenue |
|---|---|---|
| Technology | 27 | $1,492B |
|
||
| Financial Services | 3 | $174B |
|
||
| Retail | 3 | $44B |
|
||
| Insurance | 3 | $26B |
|
||
| Media / Entertainment | 2 | $115B |
|
||
| Pharmaceuticals / Biotech | 2 | $62B |
|
||
Price history
+58.8% since first listed25 events — show timeline
- 2026-05-14 Listing Removed — CRMLS
- 2026-03-31 Price Changed $135,000 CRMLS
- 2026-02-13 Price Changed $144,900 CRMLS
- 2026-01-14 Listed $148,500 CRMLS
- 2025-12-17 Listing Removed — CRMLS
- 2025-09-15 Relisted — CRMLS
- 2025-08-29 Contingent — CRMLS
- 2025-08-10 Listed $152,000 CRMLS
- 2025-07-31 Listing Removed — CRMLS
- 2025-07-13 Price Changed $152,000 CRMLS
- 2025-06-01 Price Changed $154,900 CRMLS
- 2025-01-14 Listed $159,999 CRMLS
- 2024-11-18 Listing Removed — CRMLS
- 2024-06-15 Price Changed $165,000 CRMLS
- 2024-06-13 Relisted — CRMLS
- 2024-06-08 Contingent — CRMLS
- 2024-05-13 Listed $169,900 CRMLS
- 2022-08-25 Sold (MLS) $128,000 CRMLS
- 2022-08-19 Pending — CRMLS
- 2022-07-18 Contingent — CRMLS
- 2022-07-10 Listed $128,000 CRMLS
- 2022-07-06 Coming Soon $128,000 CRMLS
- 2020-01-15 Listing Removed — CRMLS
- 2019-08-08 Price Changed $95,000 CRMLS
- 2019-07-15 Listed $85,000 CRMLS
Property tax history
-0.7%/yrLatest (2025): $113 · +0.4% YoY. Source: county tax records.
Cash-flow waterfall
monthlySold comps — $/sqft
last 12 mo · ≤1 miLoading sold comps…