75 S Policy St #51 · Methuen Town, MA
Flood risk 1/10 · Minimal
- FEMA flood zone
- X (unshaded)
- Chance of flooding over 30 yrs
- 0.0%
- Est. flood insurance / yr
- $507 – $1,088
Fire risk 1/10 · Minimal
- Est. fire insurance / yr
- $507 – $941
Heat risk 5/10 · Moderate
- Hot days now (above 96°F)
- 7 days/yr
- Hot days in 30 yrs
- 15 days/yr
Wind risk 6/10 · Moderate
- Chance of severe wind over 30 yrs
- 27.0%
Air-quality risk 2/10 · Minimal
- Unhealthy air days now
- 2 days/yr
- Unhealthy air days in 30 yrs
- 2 days/yr
Risk factors via First Street. Map © Google.
Why this score? — see what drove the B+ grade
The composite is a weighted blend of 9 inputs, each scored 0–100. Each bar is that input's sub-score; the figure is the points it added to the 100-point composite (weight × sub-score).
- Cash flow +30.0/30.0
- ARV discount +15.0/15.0
- 1% rule +10.0/10.0
- DSCR +10.0/10.0
- Schools +4.6/10.0
- Livability +3.7/5.0
- Rent growth +3.2/5.0
- Condition / age +2.5/5.0
- Appreciation +0.0/10.0
$99,000
🖨 Deal sheet 📄 Offer letter ✓ Due diligence
Listing remarks MLS
Well maintained - vinyl sided mobile home with 2 baths and 2 large bedrooms. Washer and dryer hook-ups, new kitchen with island, all new windows, beamed ceiling, lots of closets, double width. Fenced in yard with storage shed, offers plenty of privacy. Pressure treated deck and 12x14 screened porch. Parking for 2-3 cars. Nice home.
Key facts
- One-level living
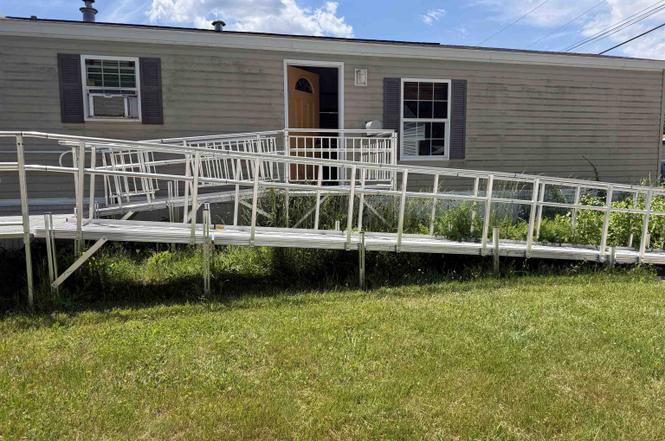
- Handicap ramp
- Built 2014
Tags
Property features AI
Finance
- Other: Mobile make/model: 2014 Titam Pinnacle; Unit/Lot number 51; Mobile serial number available
- HOA & community: Monthly park/association fee of $400
Exterior
- Parking: Paved driveway
- Utilities: Public water; Public sewer; Circuit breaker electrical service; Cable internet available
- Home design: Manuf/Mobile home; Located in Policy Lane Mobile Home Park (park-approved)
- Construction: Built in 2014; Aluminum and vinyl siding; Asphalt shingle roof
- Exterior features: Level lot; Near shopping; Paved driveway; Paved road frontage
Interior
- Bathrooms: One full bathroom
- Heating & cooling: Propane heating; Forced air heating
- Interior features: Four total rooms
Neighborhood map
What this means for you Summary
Snapshot
- This is a 2-bed/1.0-bath manufactured listed at $99k.
Deal economics
- At list price, monthly cash flow is $1k ($12k/yr) — positive.
- The deal already cash-flows at list — no discount required.
- Meets the 1% rule at list price ($3k rent vs $99k).
- Cap rate 18.7% vs local median 2.9% in Methuen Town — top-decile yield for the area; either an underpriced asset or a hidden risk that comps aren't pricing in. Stress-test before assuming the spread holds.
Location & tenants
- Location reads 73/100 on livability (#108 in MA) — a middle-class / working-renter tenant base. Strengths: housing A+, crime A, employment A; Watch: schools D+, commute D+, amenities F.
- Salem School District (suburban): math 47% / reading 56% proficiency, ranked #28 of 98 in NH (top 29%) — acceptable for families but not a draw, mixed tenant base, ~2y average lease; only 14% free/reduced lunch — higher-income household profile.
- Market conditions: Rents rising (+2.6%/yr); 20 comparable units currently listed for rent nearby; rentals leasing fast (median 5d on market — plan ~1-2 weeks tenant-placement turnaround); high-income renter base; 1,276 units permitted in Rockingham County in 2024 (593 in 5+ unit buildings).
Forward outlook
- Local home prices are declining (-3.0%/yr); year-one equity from $684 of loan paydown is wiped out by about $3k of value loss. Plan a longer hold.
- At projected returns (-3.0% appreciation + 2.6% rent growth), your $28k cash investment doubles in ~3 years — after that, you're playing with house money.
Negotiation context
- Only 1 days on market — expect competitive offers; lowballing is unlikely to land.
- 4 sale attempts since 29y ago with the ask held roughly flat each time — persistent listings suggest the price (not the market) is what's stuck; bring a comps-based counter.
- Current owner paid $35k; list at $99k implies a 183% gain — meaningful room to come down on a strong offer.
Risks & watch-outs
- Climate carrying-cost: major wind risk, 27% chance of damaging wind over 30y; extreme-heat days projected 7→15/yr by 2055 (HVAC capex compounding) — expect insurance premiums to compound above CPI over the hold.
Questions for the listing agent
- What does the HOA fee cover, when was the last increase, and are there any pending special assessments or reserve-fund shortfalls?
- Is there a deadline driving the sale (1031 exchange, divorce, estate, relocation)? That informs how much negotiation room exists.
- Schools are D-rated, which usually means shorter tenancies and higher turnover. Who's the typical renter profile here, and what's been the actual vacancy rate?
- What's the average days-on-market for RENTAL listings here right now (not sales)? A rising rental-DOM trend means longer vacancies and softer asking-rent achievability than the comps imply.
- What's the recent tenant-quality profile in this submarket — average credit score on applications, eviction rate, late-payment / NSF rate, and stable-employment percentage? A property-management company in the area should have these aggregated.
- How much new for-sale + rental construction is in the pipeline within 1–3 miles? Heavy new supply typically softens prices + rents 12–24 months out; constrained supply supports both.
Investment metrics
- 1% rule
- 2.71% ✓
- Cap rate
- 18.70%
- Cash-on-cash
- 44.29%
- DSCR
- 2.97
- GRM
- 3.1
CMA / ARV
- ARV (on-the-fly)
- $196,560
- Comps found
- 12
Show comp detail 12 sales within ~0.75 mi
| Address | Dist | Beds/Ba | Sqft | Sold | Price | $/sf | Match |
|---|---|---|---|---|---|---|---|
| 75 South Policy St #48 | 0.00mi | 2/1.0 | 840 (0%) | 6mo | $139,900 | $167 | 95 |
| 75 S Polcy St #45 | 0.00mi | 2/1.0 | 744 (-11%) | 3mo | $135,000 | $181 | 79 |
| 75 S Policy St #36 | 0.00mi | 2/2.0 | 896 (+7%) | 9mo | $225,000 | $251 | 77 |
| 75 S Policy St #62 | 0.00mi | 2/1.0 | 960 (+14%) | 20mo | $165,000 | $172 | 59 |
| 4 Trailerhome Dr | 0.54mi | 2/1.0 | 924 (+10%) | 1mo | $242,000 | $262 | 58 |
| 29 Lowell Rd #37 | 0.43mi | 2/1.5 | 924 (+10%) | 4mo | $240,000 | $260 | 58 |
| 10 Princess Dr | 0.72mi | 2/1.0 | 840 (0%) | 18mo | $179,900 | $214 | 51 |
| 29 Lowell Rd #17 | 0.43mi | 2/2.0 | 924 (+10%) | 10mo | $269,000 | $291 | 51 |
| 3 Friendship Dr | 0.64mi | 2/1.0 | 924 (+10%) | 7mo | $175,000 | $189 | 47 |
| 7 Friendship Dr | 0.61mi | 2/1.0 | 770 (-8%) | 14mo | $85,000 | $110 | 45 |
| 60 Brookwood Dr | 0.74mi | 2/1.0 | 728 (-13%) | 6mo | $170,000 | $234 | 38 |
| 61 Daisy Rd | 0.64mi | 2/2.0 | 924 (+10%) | 21mo | $219,000 | $237 | 32 |
Match score weights: distance 35% · size 25% · config 20% · recency 20%. Top-matched comps best support the ARV.
Projected returns pro-forma
-3.0% appreciation · 2.64% rent growth · sell at horizon
- IRR
- 40.9%
- Equity multiple
- 2.75×
- Total profit
- $48,452
- Equity at exit
- $14,761
- IRR
- 47.0%
- Equity multiple
- 5.45×
- Total profit
- $123,352
- Equity at exit
- $8,560
Cash invested: $27,720 (down + closing). Projections, not guarantees.
Landlord ↔ Tenant lean methodology
- Overall (STATE)
- 20 Strongly Tenant-Friendly
- State Massachusetts
- 20 Strongly Tenant-Friendly · D+15
- County
- — inherits STATE
- City
- — inherits STATE
ZIP-level market 03079
- Rents YoY
- 2.6%
- Price-to-rent
- 3.1×
Monthly cashflow live
- Estimated rent
- $2,679 high interval (Pro) →
- Mortgage (P&I)
- −$519
- Tax from tax record
- −$133 /mo · $1,591/yr
- Insurance
- −$41
- HOA
- −$400
- Vacancy / Maint / Mgmt
- −$563
- Net cashflow
- $1,023
Break-even live
UW: 25.0% down · 7.5% · 30yr · 1.5% tax · 5.0% vac · 8.0% maint · 8.0% mgmt
Financing live
Cash to close
- Down payment
- $24,750
- Closing costs
- $2,970
- Reserves months
- —
- Total cash needed
- —
Loan-product check · same deal, 3 products live
Conventional
25% down · 7.5% · 30yr
- Down + closing
- —
- Monthly P&I
- —
- Monthly cashflow
- —
- DSCR
- —
- Eligible?
- —
Personal DTI + credit; lowest rate.
DSCR
20% down · 8.5% · 30yr
- Down + closing
- —
- Monthly P&I
- —
- Monthly cashflow
- —
- DSCR
- —
- Eligible?
- —
No personal income docs; deal must DSCR.
Hard money
10% down · 12.0% · 12mo
- Down + closing
- —
- Monthly P&I
- —
- Monthly cashflow
- —
- DSCR
- —
- Eligible?
- —
Short-term bridge; refi at stabilization.
Rent comps 20 comps
| Address | Beds | Baths | Sqft | Rent | $/sqft | DOM | Units | Dist |
|---|---|---|---|---|---|---|---|---|
| 103 S Policy St Unit 10 Salem, NH | 2.0 | 1.0 | 775 | $2,100 | $2.71 | 14d | 1 | 0.23mi |
| 103 S Policy St Unit 4 Salem, NH | 1.0 | 1.0 | 650 | $2,000 | $3.08 | 14d | 1 | 0.23mi |
| 3 Artisan Dr Salem, NH | 2.0 | 1.0–2.0 | 920 | $4,401 | $4.78 | 1d | 43 | 0.30mi |
| 4 Tuscan Blvd Salem, NH | 2.0 | 1.0–2.0 | 739 | $3,390 | $4.58 | 1d | 18 | 0.40mi |
| 15 Artisan Dr Salem, NH | 2.0 | 1.0–2.0 | 910 | $3,873 | $4.26 | 1d | 35 | 0.41mi |
| 18 Artisan Dr Salem, NH | 1.0 | 1.0 | 857 | $3,200 | $3.73 | 1d | 1 | 0.44mi |
| 800 Central St Salem, NH | 2.0 | 1.0–2.0 | 776 | $2,825 | $3.64 | 1d | 14 | 0.49mi |
| 22 Via Toscana Salem, NH | 2.0 | 1.0–2.0 | 846 | $4,598 | $5.43 | 1d | 61 | 0.59mi |
| 11 Lancelot Ct #7 Salem, NH | 2.0 | 1.0 | 676 | $1,850 | $2.74 | 4d | 1 | 0.76mi |
| 8 Lancelot Ct #13 Salem, NH | 2.0 | 1.0 | 914 | $1,990 | $2.18 | 24d | 1 | 0.77mi |
| 3 Lancelot Ct Salem, NH | 2.0 | 1.0 | 736 | $1,800 | $2.45 | 43d | 1 | 0.85mi |
| 1 Lancelot Ct #2 Salem, NH | 2.0 | 1.0 | 728 | $1,950 | $2.68 | 24d | 1 | 0.85mi |
| 117 Cluff Crossing Rd Salem, NH | 2.0 | 1.0 | 980 | $2,250 | $2.30 | 43d | 1 | 0.90mi |
| 4 Brook Rd #5 Salem, NH | 2.0 | 1.0 | 891 | $2,400 | $2.69 | 43d | 1 | 1.02mi |
| 9 Tiffany Rd #1 Salem, NH | 1.0 | 1.0 | 780 | $1,850 | $2.37 | 5d | 1 | 1.03mi |
| 9 Tiffany Rd #1 Salem, NH | 1.0 | 1.0 | 780 | $1,850 | $2.37 | 24d | 1 | 1.03mi |
| 14 Tiffany Rd #2 Salem, NH | 1.0 | 1.0 | 777 | $1,695 | $2.18 | 10d | 1 | 1.06mi |
| 14 Tiffany Rd Salem, NH | 1.0 | 1.0 | 777 | $1,712 | $2.20 | 5d | 2 | 1.06mi |
| 8 Braemoor Woods Rd Salem, NH | 2.0 | 1.0 | 950 | $1,854 | $1.95 | 1d | 1 | 1.15mi |
| 205 Main St Salem, NH | 2.0 | 1.0 | 850 | $2,262 | $2.66 | 1d | 2 | 1.30mi |
HOA detail
- Monthly dues
- $400 · $4,800/yr
Listing history 2 events
-
2026-06-18remarks 679-char remark
-
2026-06-18$99,000 Active 1 DOM
ⓘ Source: listings_history table (triggers on properties + properties_extension) + one-shot
backfill from property_details.listing_events for pre-trigger history.
Tax reassessment forecast MA · Partial reset (capped growth)
- Current annual tax
- $1,591 · $133/mo
- Projected year-2 tax
- $1,591 · $133/mo
- Expected delta
- $0/yr ($0/mo · 0.0%)
ⓘ Screening estimate from a state-policy table — verify with the county assessor before closing.
Climate risk First Street
- Flood 1/10 Low FEMA zone X (unshaded) · 0% chance over 30 yrs
- Wildfire 1/10 Low
- Heat 5/10 Major 7 d/yr ≥96°F today · 15 d/yr by 30 yrs out
- Wind 6/10 Major 27% chance of damaging wind over 30 yrs
- Air quality 2/10 Low 2 unhealthy d/yr today · 2 by 30 yrs out
Nearby sold comps map
Loading sold comps map…
Walkable amenities ~0.75 mi
Loading nearby amenities…
Taxation est. · year 1
- Rental income
- $32,145
- − Mortgage interest
- −$5,546
- − Property taxes
- −$1,591
- − Insurance
- −$495
- − Repairs & maintenance
- −$2,572
- − Management
- −$2,572
- − HOA
- −$4,800
- − Depreciation
- −$2,880
- Taxable income
- $11,690
- Est. tax owed @ 24.0%
- −$2,806
- After-tax cash flow
- $9,473/yr
For passive investors: Depreciation is non-cash, so a rental often shows a tax loss while cash-flowing — sheltering income. Rental losses are passive: they offset passive income freely, and up to $25,000/yr can offset ordinary (W-2) income if you actively participate and your MAGI is under $100k (phasing out to $0 by $150k); unused losses carry forward. On sale, claimed depreciation is recaptured at up to 25%, and gains may owe capital-gains tax (a 1031 exchange can defer both). Figures are a year-1 estimate at your 24.0% rate — not tax advice; consult a CPA.
Schools (NCES district)
- District
- Salem School District
- NCES district ID
- 3306060
- Math proficiency
- 47% ▼ -4.00%
- Reading proficiency
- 56% ▼ -2.00%
- Median HH income
- $75,648
- Composite
- 46.45/100
- National rank
- #2446
- State rank
- #28 of 98 in NH
Livability — Methuen Town
- Score
- 73/100
- State rank
- #108
- US rank
- #5537
Category grades
Schools grade is shown separately in the Schools card above.
Census & demographics
- County
- Rockingham County
- City population
- 53,015
- Metro
- Boston-Cambridge-Newton, MA-NH
- Population (ZIP)
- 30,964
- Household income
- $110,490
- Rent vs Own
- Severe rent burden
- 702.0
Population outlook (Rockingham County) Hauer SSP2
- Today (2025)
- 316,118 people
- By 2030
- 320,929 · +1.5%
- By 2040
- 323,358 · +2.3%
- By 2050
- 314,977 · -0.4%
- By 2075
- 297,686 · -5.8%
- By 2100
- 256,363 · -18.9%
Race, ethnicity, and origin ACS 2023
- Neighborhood character
- Predominantly White (82%)
- Race & ethnicity
- White 82% Hispanic / Latino 9% Two or more races 4% Asian 4%
- Hispanic origin (detail)
- Puerto Rican 2% Dominican 4%
- Common ancestry
- Lithuanian 9% Romanian 4% Russian 4%
- Foreign-born
- 11% · Canada, Vietnam, South Korea
- Languages at home
- 88% English-only · Spanish 6% Other Asian/Pacific 2% Other Indo-European 1%
Political lean MEDSL · Rockingham
- 2024 margin
- Toss-up / Even · D 48.3% · R 50.8%
- 2008→2024 swing
- -3.5pp toward R · 2008: 1.1pp · 2024: -2.4pp
- All cycles
- 2024: R+2.4 2020: D+2.1 2016: R+5.8 2012: R+4.5 2008: D+1.1
Not yet ingested
- Civics
- —
Market trends
- HPI YoY
- ▼ -265.55%
- Current HPI
- 311.547
- Rent YoY
- ▲ 2.64%
- Metro
- Boston-Cambridge-Newton, MA-NH
- State GDP YoY
- ▲ 2.28%
- F500 in state
- 38
Industry mix (Fortune 500 HQ in MA)
| Industry | F500 HQs | Revenue |
|---|---|---|
| Technology | 3 | $17B |
|
||
| Insurance | 2 | $84B |
|
||
| Retail | 2 | $76B |
|
||
| Life Sciences | 1 | $43B |
|
||
| Energy Technology | 1 | $31B |
|
||
| Aerospace / Defense | 1 | $18B |
|
||
Price history
+230.0% since first listed8 events — show timeline
- 2026-06-18 Listed $99,000 PrimeMLS
- 2013-03-18 Sold (MLS) $35,000 PrimeMLS
- 2013-03-18 Sold (MLS) $35,000 MLS PIN
- 2013-02-20 Listing Removed — MLS PIN
- 2012-11-20 Listed $39,900 PrimeMLS
- 2012-11-20 Listed $39,900 MLS PIN
- 1998-09-11 Sold (MLS) $27,000 PrimeMLS
- 1997-11-25 Listed $29,999 PrimeMLS
Property tax history
+1.3%/yrLatest (2025): $1,591 · +3.2% YoY. Source: county tax records.
Cash-flow waterfall
monthlySold comps — $/sqft
last 12 mo · ≤1 miLoading sold comps…