 🏗️ New Construction
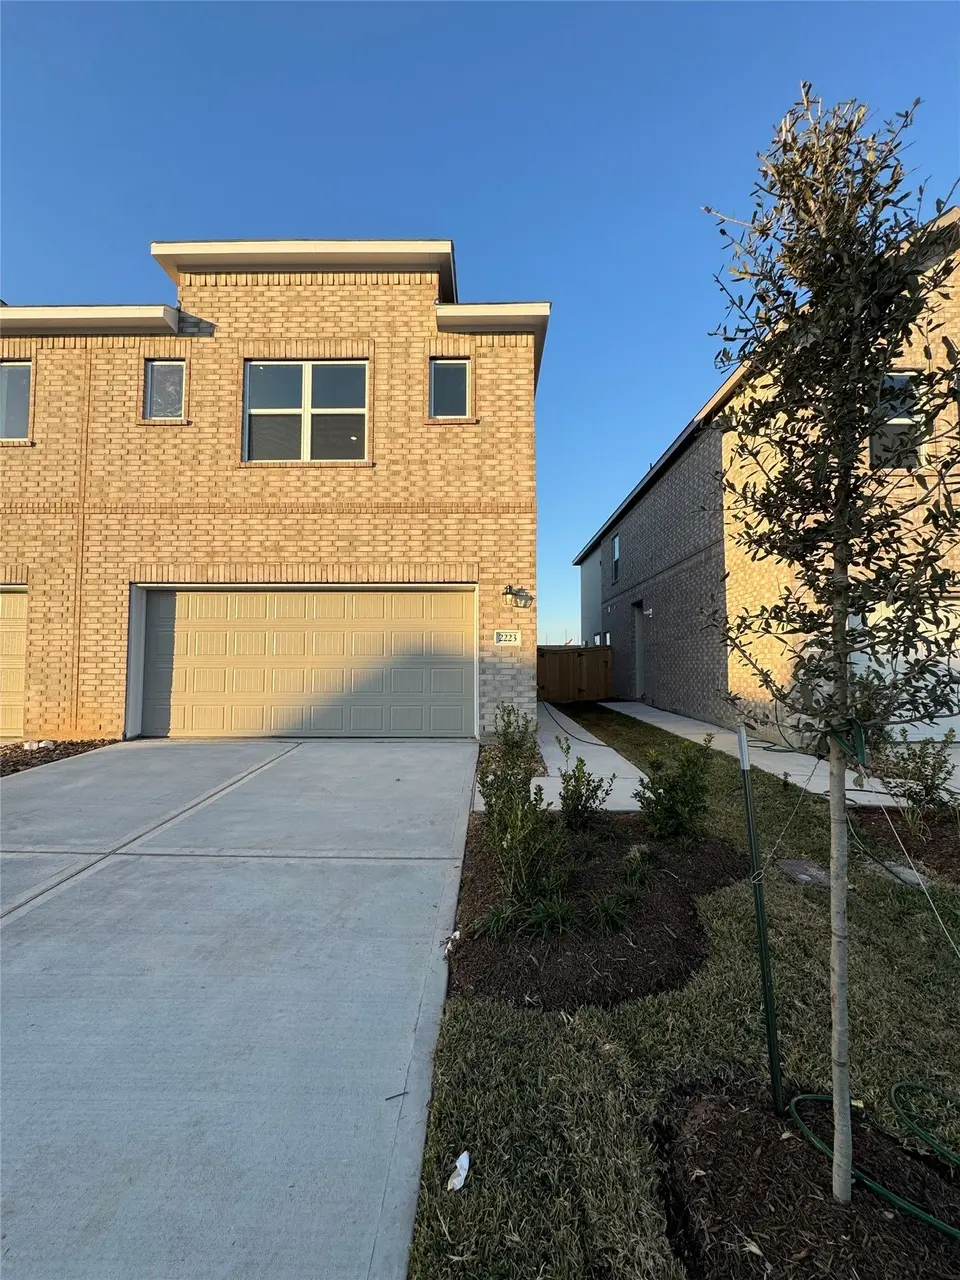
2151 Salinas Dr · Iowa Colony, TX
Flood risk No data
- FEMA flood zone
- —
- Chance of flooding over 30 yrs
- —
- Est. flood insurance / yr
- —
Fire risk No data
- Est. fire insurance / yr
- —
Heat risk No data
- Hot days now (above threshold)
- —
- Hot days in 30 yrs
- —
Wind risk No data
- Chance of severe wind over 30 yrs
- —
Air-quality risk No data
- Unhealthy air days now
- —
- Unhealthy air days in 30 yrs
- —
Risk factors via First Street. Map © Google.
Why this score? — see what drove the C- grade
The composite is a weighted blend of 9 inputs, each scored 0–100. Each bar is that input's sub-score; the figure is the points it added to the 100-point composite (weight × sub-score).
- Cash flow +18.5/30.0
- ARV discount +7.5/15.0
- DSCR +5.8/10.0
- Condition / age +4.8/5.0
- 1% rule +4.3/10.0
- Schools +3.9/10.0
- Livability +3.2/5.0
- Rent growth +2.6/5.0
- Appreciation +0.0/10.0
$287,990
🖨 Deal sheet 📄 Offer letter ✓ Due diligence
Listing remarks
NEW! Lennar Texas Villas "Cowboy" Plan with Brick Elevation "F" in Sierra Vista! This new two-story townhome offers ample space to live and grow. An inviting open-concept layout on the first floor simplifies everyday transitions between a modern kitchen and inviting Great Room. On the second floor, a versatile loft provides a convenient shared living space easily accessible from two bedrooms and a luxe owner’s suite with dual walk-in closets.
Key facts
- Dual walk-in closets
- Inviting great room
- Modern kitchen
Tags
Property features AI
Finance
- HOA & community: Sierra Vista HOA; Annual association fee (includes internet)
Exterior
- Parking: Attached garage
- Security: Security system
- Utilities: Has heating and cooling
- Home design: Residential property; Two-story home; Under construction (new construction - 2026); Slab foundation
- Construction: Brick and cement siding exterior; Built in 2026
- Exterior features: Security system; Composition roof
Interior
- Kitchen: Kitchen on the first floor
- Bedrooms: Primary bedroom on the second floor (approx. 13 x 15); Two additional second-floor bedrooms (approx. 10 x 11 and 10 x 10)
- Bathrooms: Two full bathrooms; One half bathroom
- Heating & cooling: Central heating (gas); Central electric air conditioning
- Interior features: Game room on the second floor; Family room on the first floor
Neighborhood map
What this means for you Summary
Snapshot
- This is a 3-bed/2.5-bath townhouse listed at $288k. Condition is rated excellent.
Deal economics
- At list price, monthly cash flow is $272 ($3k/yr) — positive.
- The deal already cash-flows at list — no discount required.
- To meet the 1% rule (rent ≥ 1% of price), the offer needs to be $266k (7.6% below list).
- Recommended offer: $266k (7.6% below list) — sets the bar for 1% rule.
- Cap rate 7.4% vs local median 4.2% in Iowa Colony — top-decile yield for the area; either an underpriced asset or a hidden risk that comps aren't pricing in. Stress-test before assuming the spread holds.
Location & tenants
- Location reads 64/100 on livability (#757 in TX) — a middle-class / working-renter tenant base. Strengths: crime A+, employment A+, cost of living A+; Watch: amenities F, commute F, health & safety F.
- Alvin ISD (suburban): math 39% / reading 48% proficiency, ranked #255 of 826 in TX (top 31%) — families likely to look elsewhere, expect single-tenant / working-renter base with shorter leases.
- Zoned schools: Iowa Colony H S (792 students, 56% FRL).
- Market conditions: Rents flat; 1139 active listings in the ZIP; 21 comparable units currently listed for rent nearby; rentals at typical pace (median 17d on market — plan ~3-4 weeks tenant-placement turnaround); high-income renter base; 3,960 units permitted in Brazoria County in 2024 (593 in 5+ unit buildings).
Forward outlook
- Local home prices are declining (-3.0%/yr); year-one equity from $2k of loan paydown is wiped out by about $9k of value loss. Plan a longer hold.
- Brazoria County population projected at +44% by 2050 — long-run rental-demand tailwind backs the buy-and-hold thesis.
Negotiation context
- Only 8 days on market — expect competitive offers; lowballing is unlikely to land.
Questions for the listing agent
- What does the HOA fee cover, when was the last increase, and are there any pending special assessments or reserve-fund shortfalls?
- Is there a deadline driving the sale (1031 exchange, divorce, estate, relocation)? That informs how much negotiation room exists.
- Schools are F-rated, which usually means shorter tenancies and higher turnover. Who's the typical renter profile here, and what's been the actual vacancy rate?
- What's the average days-on-market for RENTAL listings here right now (not sales)? A rising rental-DOM trend means longer vacancies and softer asking-rent achievability than the comps imply.
- What's the recent tenant-quality profile in this submarket — average credit score on applications, eviction rate, late-payment / NSF rate, and stable-employment percentage? A property-management company in the area should have these aggregated.
- How much new for-sale + rental construction is in the pipeline within 1–3 miles? Heavy new supply typically softens prices + rents 12–24 months out; constrained supply supports both.
Investment metrics
- 1% rule
- 0.93% ✗
- Cap rate
- 7.43%
- Cash-on-cash
- 4.06%
- DSCR
- 1.18
- GRM
- 9.0
CMA / ARV
- ARV (median comp)
- $287,490
- List price
- $287,990
- Delta
- 0.17%
- Verdict
- FAIR
- Comps
- 20 within 1.0 mi
Show comp detail 12 sales within ~0.75 mi
| Address | Dist | Beds/Ba | Sqft | Sold | Price | $/sf | Match |
|---|---|---|---|---|---|---|---|
| 2160 Salinas Dr | 0.03mi | 3/2.5 | 1,782 (+0%) | 1mo | $286,990 | $161 | 98 |
| 2171 Salinas Dr | 0.02mi | 3/2.5 | 1,778 (0%) | 2mo | $287,990 | $162 | 97 |
| 2167 Salinas Dr | 0.05mi | 3/2.5 | 1,728 (-3%) | 0mo | $280,990 | $163 | 93 |
| 2172 Salinas Dr | 0.04mi | 4/2.5 (+1) | 1,780 (+0%) | 1mo | $294,990 | $166 | 92 |
| 2203 Salinas Dr | 0.03mi | 4/2.5 (+1) | 1,782 (+0%) | 1mo | $295,990 | $166 | 92 |
| 2163 Salinas Dr | 0.01mi | 3/2.5 | 1,718 (-3%) | 2mo | $280,990 | $164 | 92 |
| 2214 Salinas Dr | 0.06mi | 4/2.5 (+1) | 1,777 (-0%) | 1mo | $299,991 | $169 | 92 |
| 2227 Salinas Dr | 0.06mi | 4/2.5 (+1) | 1,782 (+0%) | 0mo | $298,990 | $168 | 92 |
| 2207 Salinas Dr | 0.04mi | 4/2.5 (+1) | 1,782 (+0%) | 2mo | $295,990 | $166 | 92 |
| 2176 Salinas Dr | 0.04mi | 3/2.5 | 1,715 (-4%) | 1mo | $279,990 | $163 | 91 |
| 2782 Mariposa Creek Dr | 0.74mi | 3/2.5 | 1,686 (-5%) | 2mo | $229,000 | $136 | 56 |
| 2766 Mariposa Creek Dr #3 | 0.72mi | 3/2.5 | 1,661 (-7%) | 2mo | $229,000 | $138 | 54 |
Match score weights: distance 35% · size 25% · config 20% · recency 20%. Top-matched comps best support the ARV.
Projected returns pro-forma
-3.0% appreciation · 0.44% rent growth · sell at horizon
- IRR
- -12.7%
- Equity multiple
- 0.55×
- Total profit
- $-35,998
- Equity at exit
- $42,866
- IRR
- -7.8%
- Equity multiple
- 0.56×
- Total profit
- $-35,323
- Equity at exit
- $24,857
Cash invested: $80,497 (down + closing). Projections, not guarantees.
Landlord ↔ Tenant lean methodology
- Overall (STATE)
- 87 Strongly Landlord-Friendly
- State Texas
- 87 Strongly Landlord-Friendly · R+5
- County
- — inherits STATE
- City
- — inherits STATE
ZIP-level market 77583
- Rents YoY
- 0.4%
- Active inventory
- 1139
- Price-to-rent
- 9.0×
Monthly cashflow live
- Estimated rent
- $2,662 high interval (Pro) →
- Mortgage (P&I)
- −$1,508
- Tax from tax record
- −$70 /mo · $845/yr
- Insurance
- −$120
- HOA
- −$133
- Vacancy / Maint / Mgmt
- −$559
- Net cashflow
- $272
Break-even live
UW: 25.0% down · 7.5% · 30yr · 1.5% tax · 5.0% vac · 8.0% maint · 8.0% mgmt
Financing live
Cash to close
- Down payment
- $71,872
- Closing costs
- $8,625
- Reserves months
- —
- Total cash needed
- —
Loan-product check · same deal, 3 products live
Conventional
25% down · 7.5% · 30yr
- Down + closing
- —
- Monthly P&I
- —
- Monthly cashflow
- —
- DSCR
- —
- Eligible?
- —
Personal DTI + credit; lowest rate.
DSCR
20% down · 8.5% · 30yr
- Down + closing
- —
- Monthly P&I
- —
- Monthly cashflow
- —
- DSCR
- —
- Eligible?
- —
No personal income docs; deal must DSCR.
Hard money
10% down · 12.0% · 12mo
- Down + closing
- —
- Monthly P&I
- —
- Monthly cashflow
- —
- DSCR
- —
- Eligible?
- —
Short-term bridge; refi at stabilization.
Rent comps 21 comps
| Address | Beds | Baths | Sqft | Rent | $/sqft | DOM | Units | Dist |
|---|---|---|---|---|---|---|---|---|
| 10211 Alpine Lake Ln Rosharon, TX | 3.0–4.0 | 2.0–2.5 | 1731 | $2,700 | $1.56 | 1d | 6 | 0.16mi |
| 10211 Alpine Lake Ln Rosharon, TX | 3.0–4.0 | 2.0–2.5 | 1731 | $2,469 | $1.43 | 43d | 7 | 0.16mi |
| 2314 Red Slate Dr Rosharon, TX | 4.0 | 4.0 | 2531 | $2,850 | $1.13 | 43d | 1 | 0.21mi |
| 1816 Corsica Creek Ln Rosharon, TX | 3.0–4.0 | 2.0–2.5 | 1653 | $2,306 | $1.40 | 1d | 21 | 0.33mi |
| 10313 Malta Trace Dr Rosharon, TX | 4.0 | 2.0 | 1802 | $2,545 | $1.41 | 43d | 1 | 0.42mi |
| 9518 Peridot Green Dr Rosharon, TX | 4.0 | 2.0 | 1593 | $1,886 | $1.18 | 22d | 1 | 0.50mi |
| 9423 Grand Spark Dr Rosharon, TX | 3.0 | 3.0 | 1999 | $2,600 | $1.30 | 43d | 1 | 0.80mi |
| 10610 Cascade Creek Dr Rosharon, TX | 3.0 | 2.0 | 1548 | $2,700 | $1.74 | 43d | 1 | 1.04mi |
| 10622 Cascade Creek Dr Rosharon, TX | 4.0 | 2.0 | 1780 | $2,775 | $1.56 | 43d | 1 | 1.07mi |
| 1403 Cascade Hills Dr Rosharon, TX | 4.0 | 3.0 | 2067 | $3,450 | $1.67 | 7d | 1 | 1.08mi |
| 10630 Cascade Creek Dr Rosharon, TX | 3.0 | 2.5 | 1940 | $2,875 | $1.48 | 3d | 1 | 1.08mi |
| 10507 Moon Valley Ln Rosharon, TX | 3.0 | 2.0 | 1548 | $2,650 | $1.71 | 1d | 1 | 1.11mi |
| 10502 Moon Valley Ln Rosharon, TX | 3.0 | 2.0 | 1615 | $2,725 | $1.69 | 1d | 1 | 1.14mi |
| 1123 Diamond Drape Dr Rosharon, TX | 4.0 | 2.0 | 1844 | $2,000 | $1.08 | 12d | 1 | 1.15mi |
| 1234 Scarlet Creek Dr Rosharon, TX | 3.0 | 2.0 | 1548 | $2,650 | $1.71 | 1d | 1 | 1.17mi |
| 9901 Kilkenny St Iowa Colony, TX | 3.0–4.0 | 2.5 | 1735 | $2,275 | $1.31 | 4d | 1 | 1.19mi |
| 10538 Wildflower View Dr Rosharon, TX | 3.0 | 2.0 | 1522 | $2,775 | $1.82 | 1d | 1 | 1.22mi |
| 2510 Green Jasper Dr Rosharon, TX | 3.0 | 2.0 | 1561 | $2,375 | $1.52 | 43d | 1 | 1.22mi |
| 10602 Wildflower View Dr Rosharon, TX | 4.0 | 2.0 | 1596 | $2,850 | $1.79 | 20d | 1 | 1.23mi |
| 10714 Cliffs View Dr Iowa Colony, TX | 4.0 | 3.5 | 2070 | $2,700 | $1.30 | 43d | 1 | 1.27mi |
| 2523 Topaz Hill Ln Rosharon, TX | 3.0–4.0 | 2.0–2.5 | 1857 | $2,425 | $1.31 | 17d | 1 | 1.46mi |
HOA detail
- Monthly dues
- $133 · $1,596/yr
Listing history 4 events
-
2026-05-14status Pending 474-char remark
-
2026-05-14price $287,990 474-char remark
-
2026-05-12price $245,240 474-char remark
-
2026-05-06$249,340 Active 474-char remark
ⓘ Source: listings_history table (triggers on properties + properties_extension) + one-shot
backfill from property_details.listing_events for pre-trigger history.
Tax reassessment forecast TX · Resets to sale price
- Current annual tax
- $845 · $70/mo
- Projected year-2 tax
- $5,270 · $439/mo
- Expected delta
- +$4,425/yr (+$369/mo · 523.8%)
ⓘ Screening estimate from a state-policy table — verify with the county assessor before closing.
Nearby sold comps map
Loading sold comps map…
Walkable amenities ~0.75 mi
Loading nearby amenities…
Taxation est. · year 1
- Rental income
- $31,943
- − Mortgage interest
- −$16,104
- − Property taxes
- −$845
- − Insurance
- −$1,437
- − Repairs & maintenance
- −$2,555
- − Management
- −$2,555
- − HOA
- −$1,596
- − Depreciation
- −$8,363
- Taxable loss
- −$1,514
- Est. tax savings @ 24.0%
- +$363
- After-tax cash flow
- $3,628/yr
For passive investors: Depreciation is non-cash, so a rental often shows a tax loss while cash-flowing — sheltering income. Rental losses are passive: they offset passive income freely, and up to $25,000/yr can offset ordinary (W-2) income if you actively participate and your MAGI is under $100k (phasing out to $0 by $150k); unused losses carry forward. On sale, claimed depreciation is recaptured at up to 25%, and gains may owe capital-gains tax (a 1031 exchange can defer both). Figures are a year-1 estimate at your 24.0% rate — not tax advice; consult a CPA.
Condition & rehab AI · 10 photos
This new two-story townhome in Sierra Vista offers ample space and a modern layout. The exterior and interior are in excellent condition, with minimal maintenance required. A fresh coat of paint and landscaping improvements could further enhance its appeal.
Value-add opportunities
- Resale Painting the exterior brick — A fresh coat of paint can enhance the curb appeal and make the home look more inviting to potential buyers.
- Both Landscaping improvements — Enhancing the landscaping can improve the overall appearance and increase the home's value for both resale and rental.
Renovation cost estimate screening
Value-add ROI direction
- Resale Painting the exterior brick — A fresh coat of paint can enhance the curb appeal and make the home look more inviting to potential buyers. ↑
- Both Landscaping improvements — Enhancing the landscaping can improve the overall appearance and increase the home's value for both resale and rental. ↑
ⓘ Cost ranges are severity-bucket heuristics (US national rule-of-thumb). Get contractor quotes + a written scope before underwriting a rehab budget.
Schools (NCES district)
- District
- Alvin ISD
- NCES district ID
- 4808090
- Math proficiency
- 39% ▼ -11.00%
- Reading proficiency
- 48% ▬ 0.00%
- Median HH income
- $66,740
- Composite
- 38.96/100
- National rank
- #4080
- State rank
- #255 of 826 in TX
Livability — Iowa Colony
- Score
- 64/100
- State rank
- #757
- US rank
- #13904
Category grades
Schools grade is shown separately in the Schools card above.
Census & demographics
- County
- Brazoria County · 374,982 people
- City population
- 52,747
- Metro
- Houston-The Woodlands-Sugar Land, TX
- Population (ZIP)
- 52,747
- Household income
- $119,287
- Rent vs Own
- Severe rent burden
- 251.0
Population outlook (Brazoria County) Hauer SSP2
- Today (2025)
- 420,414 people
- By 2030
- 457,585 · +8.8%
- By 2040
- 532,232 · +26.6%
- By 2050
- 605,399 · +44.0%
- By 2075
- 779,358 · +85.4%
- By 2100
- 883,759 · +110.2%
Race, ethnicity, and origin ACS 2023
- Neighborhood character
- Highly diverse neighborhood (Simpson 0.70)
- Race & ethnicity
- Hispanic / Latino 38% Black 34% White 20% Two or more races 18% Asian 5%
- Hispanic origin (detail)
- Mexican 31% Puerto Rican 2%
- Common ancestry
- Lithuanian 1% Slovak 1% Romanian 1%
- Foreign-born
- 16% · Canada, Vietnam, China
- Languages at home
- 64% English-only · Spanish 28% Other Asian/Pacific 2% Vietnamese 1%
Political lean MEDSL · Brazoria
- 2024 margin
- R (+19.7) · D 39.5% · R 59.2% · Other 1.3%
- 2008→2024 swing
- +9.9pp toward D · 2008: -29.6pp · 2024: -19.7pp
- All cycles
- 2024: R+19.7 2020: R+18.2 2016: R+24.6 2012: R+34.2 2008: R+29.6
Not yet ingested
- Civics
- —
Market trends
- HPI YoY
- ▼ -120.19%
- Current HPI
- 198.6559
- Rent YoY
- ▲ 0.44%
- Metro
- Houston-The Woodlands-Sugar Land, TX
- State GDP YoY
- ▲ 3.95%
- F500 in state
- 110
Industry mix (Fortune 500 HQ in TX)
| Industry | F500 HQs | Revenue |
|---|---|---|
| Energy | 16 | $1,198B |
|
||
| Technology | 5 | $198B |
|
||
| Engineering / Construction | 4 | $72B |
|
||
| Energy Services | 3 | $60B |
|
||
| Utilities | 3 | $41B |
|
||
| Healthcare | 2 | $330B |
|
||
Price history
+15.5% since first listed4 events — show timeline
- 2026-05-14 Pending — HARMLS
- 2026-05-14 Price Changed $287,990 HARMLS
- 2026-05-12 Price Changed $245,240 HARMLS
- 2026-05-06 Listed $249,340 HARMLS
Cash-flow waterfall
monthlySold comps — $/sqft
last 12 mo · ≤1 miLoading sold comps…