5826 Scotland St · Indianapolis city (balance), IN
Flood risk 1/10 · Minimal
- FEMA flood zone
- X (unshaded)
- Chance of flooding over 30 yrs
- 0.0%
- Est. flood insurance / yr
- $507 – $1,088
Fire risk 1/10 · Minimal
- Est. fire insurance / yr
- $717 – $1,331
Heat risk 3/10 · Minor
- Hot days now (above 100°F)
- 7 days/yr
- Hot days in 30 yrs
- 20 days/yr
Wind risk 2/10 · Minimal
- Chance of severe wind over 30 yrs
- 0.0%
Air-quality risk 4/10 · Minor
- Unhealthy air days now
- 4 days/yr
- Unhealthy air days in 30 yrs
- 5 days/yr
Risk factors via First Street. Map © Google.
Why this score? — see what drove the D- grade
The composite is a weighted blend of 9 inputs, each scored 0–100. Each bar is that input's sub-score; the figure is the points it added to the 100-point composite (weight × sub-score).
- Cash flow +12.0/30.0
- Schools +6.3/10.0
- Rent growth +4.4/5.0
- DSCR +3.5/10.0
- 1% rule +3.0/10.0
- ARV discount +2.9/15.0
- Livability +2.5/5.0
- Condition / age +2.5/5.0
- Appreciation +0.0/10.0
$299,900
🖨 Deal sheet (PDF) 📄 Offer letter ✓ Due diligence
Listing remarks MLS
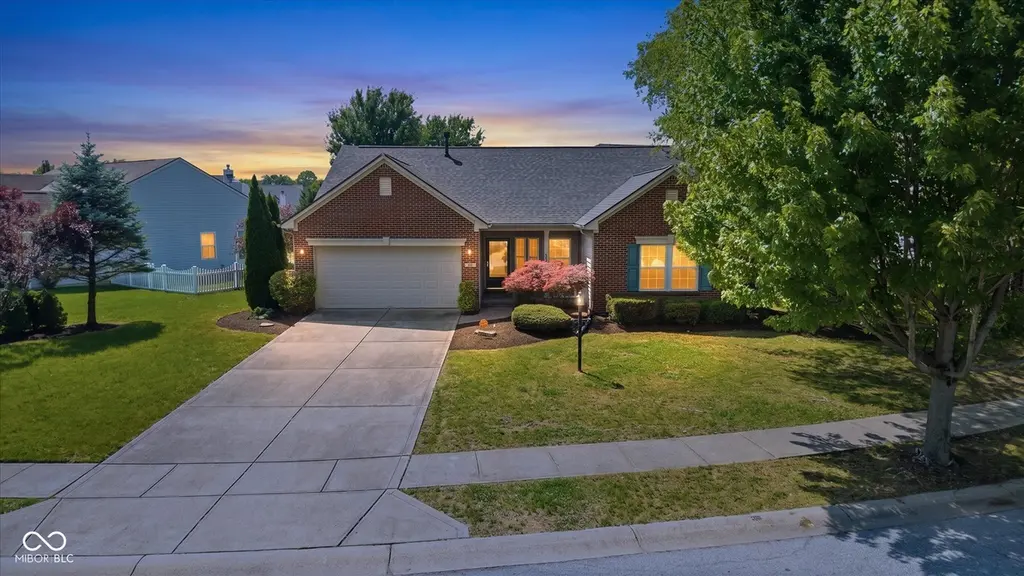
Exciting contemporary 1620 Sq Ft ranch waiting for you. Soaring ceilings throughout. New vinyl plank flooring in 2019 in the Entry, GR, Kit, & DR . Covered brick inlaid front porch w/room for a small table. The Entry welcomes you into the 20x13 GR. Open floor plan between the GR, Dr, Kit, and Office. The GR features a floor to ceiling brick faced gas fireplace & skylights. Cathedral ceiling over the GR, DR, & Kit. DR can be used formally or informally. Kit microwave, refrigerator, R/O, & dishwasher all stay. 13x11 Office w/double door entry and access to MBR. MBR suite w/ cathedral ceiling & 8x5 W-I-C. MBR BA w/2 sink vanity & huge shower w/built-in seats. 9' ceilings in other rooms/areas. W & D stay. 18 x 14 Deck. Accenting landscaping.
Key facts
- Covered front porch
- Brick inlay
- Bonus flex rm
Tags
Property features AI
Finance
- Other: Radon mitigation system installed
- HOA & community: Homeowners association with semi-annual fee (approximately $200); HOA provides entrance/common area maintenance, insurance, park/playground, management, snow removal, tennis courts, basketball court, pool, and trails; HOA governed by covenants and restrictions
Exterior
- Parking: Attached garage (2 car, approximately 400 sq ft)
- Security: Security system; Smoke alarms
- Utilities: Public water; Municipal sewer connected; Natural gas connected; Cable available
- Home design: Single-family residence; One story
- Construction: Brick and vinyl siding exterior; Slab foundation
- Exterior features: Covered patio/porch; Deck; Sidewalks; Mature trees
Interior
- Kitchen: Electric oven; Microwave with hood; Dishwasher; Garbage disposal; Refrigerator; Breakfast bar; Pantry
- Bedrooms: Three bedrooms on the main level; Primary bedroom with walk-in closet
- Flooring: Luxury vinyl plank in kitchen, great room, and dining room
- Bathrooms: Two full bathrooms; Primary bathroom with double sinks, full shower stall, and suite layout
- Heating & cooling: Forced air heating (natural gas); Central air conditioning
- Interior features: Attic access; Breakfast bar; Cathedral vaulted ceilings; High ceilings; Pantry; Smart thermostat; Walk-in closets; Painted woodwork
- Laundry & utility: Washer and dryer included; Laundry closet; Gas water heater
Neighborhood map
What this means for you Summary
Snapshot
- This is a 3-bed/2.0-bath single-family listed at $300k.
Deal economics
- At list price, monthly cash flow is $-73 ($-875/yr) — negative.
- To cash-flow at today's rent, offer at most $287k (4.3% below list).
- To meet the 1% rule (rent ≥ 1% of price), the offer needs to be $239k (20.2% below list).
- Recommended offer: $239k (20.2% below list) — sets the bar for 1% rule.
- Cap rate 6.0% vs local median 4.4% in Indianapolis city (balance) — top-decile yield for the area; either an underpriced asset or a hidden risk that comps aren't pricing in. Stress-test before assuming the spread holds.
Location & tenants
- Location reads: area grade D — affects rentability + tenant quality, not the cash-flow math above.
- Brownsburg Community School Corporation (suburban): math 72% / reading 72% proficiency, ranked #2 of 301 in IN (top 1%) — strong family-tenant draw, lease renewals of 3-5y typical; only 17% free/reduced lunch — higher-income household profile.
- Zoned schools: Brownsburg High School (math 61% / reading 83%, grade B+, #12 of 369 statewide, top 4%, 3,177 students, 33% FRL) — zoned schools average 33% FRL vs 17% district-wide (16 pts higher); higher-poverty schools than district average — tighter screening recommended.
- Market conditions: Rents rising fast (+7.6%/yr); 66 active listings in the ZIP; 2 comparable units currently listed for rent nearby; solid renter incomes; 1,294 units permitted in Hendricks County in 2024 (18 in 5+ unit buildings).
- This rent runs 35% of the median local income ($83k/yr) — at the standard rent-burdened threshold; future hikes will face affordability resistance.
Forward outlook
- Local home prices are declining (-3.0%/yr); year-one equity from $2k of loan paydown is wiped out by about $9k of value loss. Plan a longer hold.
- Hendricks County population projected at +35% by 2050 — long-run rental-demand tailwind backs the buy-and-hold thesis.
Negotiation context
- Only 3 days on market — expect competitive offers; lowballing is unlikely to land.
- 2 sale attempts since 6y ago with the ask held roughly flat each time — persistent listings suggest the price (not the market) is what's stuck; bring a comps-based counter.
- Current owner paid $217k; 38% above their basis — modest negotiation headroom, anchor on the comps not their cost.
Questions for the listing agent
- What do current leases actually rent for vs. the listed asking? Can we see a recent rent roll and the last 12 months of T-12 income?
- What does the HOA fee cover, when was the last increase, and are there any pending special assessments or reserve-fund shortfalls?
- Is there a deadline driving the sale (1031 exchange, divorce, estate, relocation)? That informs how much negotiation room exists.
- The area grade is low — what's the realistic commute time and amenity access for the typical tenant pool here? Any planned neighborhood developments (good or bad) we should know about?
- What's the average days-on-market for RENTAL listings here right now (not sales)? A rising rental-DOM trend means longer vacancies and softer asking-rent achievability than the comps imply.
- What's the recent tenant-quality profile in this submarket — average credit score on applications, eviction rate, late-payment / NSF rate, and stable-employment percentage? A property-management company in the area should have these aggregated.
- How much new for-sale + rental construction is in the pipeline within 1–3 miles? Heavy new supply typically softens prices + rents 12–24 months out; constrained supply supports both.
Investment metrics
- 1% rule
- 0.80% ✗
- Cap rate
- 6.00%
- Cash-on-cash
- -1.04%
- DSCR
- 0.95
- GRM
- 10.4
CMA / ARV
- ARV (on-the-fly)
- $272,160
- Comps found
- 12
Show comp detail 12 sales within ~0.75 mi
| Address | Dist | Beds/Ba | Sqft | Sold | Price | $/sf | Match |
|---|---|---|---|---|---|---|---|
| 5809 Scotland St | 0.04mi | 4/2.0 (+1) | 1,656 (+2%) | 12mo | $315,000 | $190 | 80 |
| 10585 Windward Dr | 0.18mi | 4/2.0 (+1) | 1,656 (+2%) | 10mo | $335,000 | $202 | 75 |
| 5890 Jamestown Square Ln | 0.19mi | 3/2.0 | 1,693 (+4%) | 17mo | $277,500 | $164 | 69 |
| 5919 Jamestown Square Ln | 0.23mi | 3/2.0 | 1,630 (+1%) | 23mo | $299,900 | $184 | 69 |
| 5788 Independence Ave | 0.22mi | 3/2.0 | 1,704 (+5%) | 18mo | $285,000 | $167 | 66 |
| 5849 Jamestown Square Ln | 0.21mi | 3/2.0 | 1,816 (+12%) | 14mo | $305,000 | $168 | 58 |
| 10436 Kings Gap Way | 0.58mi | 3/2.0 | 1,782 (+10%) | 2mo | $290,000 | $163 | 55 |
| 10056 Clear Creek Cir | 0.70mi | 3/2.0 | 1,762 (+9%) | 2mo | $275,000 | $156 | 51 |
| 10275 Memorial Knoll Dr | 0.71mi | 3/2.0 | 1,770 (+9%) | 1mo | $294,000 | $166 | 51 |
| 6261 Lakeland Ln | 0.44mi | 4/2.0 (+1) | 1,832 (+13%) | 9mo | $325,000 | $177 | 45 |
| 5525 Wythe Ln | 0.32mi | 3/2.0 | 1,854 (+14%) | 21mo | $313,000 | $169 | 44 |
| 10112 Split Rock Way | 0.68mi | 3/2.0 | 1,858 (+15%) | 6mo | $290,000 | $156 | 39 |
Match score weights: distance 35% · size 25% · config 20% · recency 20%. Top-matched comps best support the ARV.
Projected returns pro-forma
-3.0% appreciation · 7.56% rent growth · sell at horizon
- IRR
- -13.3%
- Equity multiple
- 0.50×
- Total profit
- $-41,782
- Equity at exit
- $44,716
- IRR
- 1.3%
- Equity multiple
- 1.11×
- Total profit
- $9,324
- Equity at exit
- $25,930
Cash invested: $83,972 (down + closing). Projections, not guarantees.
Landlord ↔ Tenant lean methodology
- Overall (STATE)
- 90 Strongly Landlord-Friendly
- State Indiana
- 90 Strongly Landlord-Friendly · R+11
- County
- — inherits STATE
- City
- — inherits STATE
ZIP-level market 46234
- Home prices YoY
- -33.0%
- Rents YoY
- 7.6%
- Active inventory
- 66
- Price-to-rent
- 10.4×
Monthly cashflow live
- Estimated rent
- $2,394 medium interval (Pro) →
- Mortgage (P&I)
- −$1,573
- Tax from tax record
- −$234 /mo · $2,804/yr
- Insurance
- −$125
- HOA
- −$33
- Vacancy / Maint / Mgmt
- −$503
- Net cashflow
- $-73
Break-even live
Sensitivity live
| Price | -10% $97 | -5% $12 | +0% $-73 | +5% $-158 | +10% $-243 |
|---|---|---|---|---|---|
| Rent | -10% $-262 | -5% $-167 | +0% $-73 | +5% $22 | +10% $116 |
| Rate | -1.0pp $78 | -0.5pp $3 | base $-73 | +0.5pp $-151 | +1.0pp $-230 |
UW: 25.0% down · 7.5% · 30yr · 1.5% tax · 5.0% vac · 8.0% maint · 8.0% mgmt
Financing live
Cash to close
- Down payment
- $74,975
- Closing costs
- $8,997
- Reserves months
- —
- Total cash needed
- —
Loan-product check · same deal, 3 products live
Conventional
25% down · 7.5% · 30yr
- Down + closing
- —
- Monthly P&I
- —
- Monthly cashflow
- —
- DSCR
- —
- Eligible?
- —
Personal DTI + credit; lowest rate.
DSCR
20% down · 8.5% · 30yr
- Down + closing
- —
- Monthly P&I
- —
- Monthly cashflow
- —
- DSCR
- —
- Eligible?
- —
No personal income docs; deal must DSCR.
Hard money
10% down · 12.0% · 12mo
- Down + closing
- —
- Monthly P&I
- —
- Monthly cashflow
- —
- DSCR
- —
- Eligible?
- —
Short-term bridge; refi at stabilization.
Rent comps 2 comps
| Address | Beds | Baths | Sqft | Rent | $/sqft | DOM | Units | Dist |
|---|---|---|---|---|---|---|---|---|
| 5548 James Blair Dr Indianapolis, IN | 3.0 | 2.0 | 1572 | $2,000 | $1.27 | 25d | 1 | 0.25mi |
| 10309 Gateway Dr Indianapolis, IN | 2.0 | 2.0 | 1260 | $2,295 | $1.82 | 45d | 1 | 0.38mi |
HOA detail
- Monthly dues
- $33 · $396/yr
- Likely covers
- gaslandscaping
Listing history 4 events
-
2026-06-16status $299,900 Pending 3 DOM
-
2026-06-15days on market $299,900 Active 3 DOM
-
2026-06-13remarks 691-char remark
-
2026-06-13$299,900 Active 1 DOM
ⓘ Source: listings_history table (triggers on properties + properties_extension) + one-shot
backfill from property_details.listing_events for pre-trigger history.
Tax reassessment forecast IN · Partial reset (capped growth)
- Current annual tax
- $2,804 · $234/mo
- Projected year-2 tax
- $2,804 · $234/mo
- Expected delta
- $0/yr ($0/mo · 0.0%)
ⓘ Screening estimate from a state-policy table — verify with the county assessor before closing.
Climate risk First Street
- Flood 1/10 Low FEMA zone X (unshaded) · 0% chance over 30 yrs
- Wildfire 1/10 Low
- Heat 3/10 Moderate 7 d/yr ≥100°F today · 20 d/yr by 30 yrs out
- Wind 2/10 Low 0% chance of damaging wind over 30 yrs
- Air quality 4/10 Moderate 4 unhealthy d/yr today · 5 by 30 yrs out
Nearby sold comps map
Loading sold comps map…
Walkable amenities ~0.75 mi
Loading nearby amenities…
Taxation est. · year 1
- Rental income
- $28,730
- − Mortgage interest
- −$16,799
- − Property taxes
- −$2,804
- − Insurance
- −$1,500
- − Repairs & maintenance
- −$2,298
- − Management
- −$2,298
- − HOA
- −$396
- − Depreciation
- −$8,724
- Taxable loss
- −$6,089
- Est. tax savings @ 24.0%
- +$1,461
- After-tax cash flow
- $586/yr
For passive investors: Depreciation is non-cash, so a rental often shows a tax loss while cash-flowing — sheltering income. Rental losses are passive: they offset passive income freely, and up to $25,000/yr can offset ordinary (W-2) income if you actively participate and your MAGI is under $100k (phasing out to $0 by $150k); unused losses carry forward. On sale, claimed depreciation is recaptured at up to 25%, and gains may owe capital-gains tax (a 1031 exchange can defer both). Figures are a year-1 estimate at your 24.0% rate — not tax advice; consult a CPA.
Schools (NCES district)
- District
- Brownsburg Community School Corporation
- NCES district ID
- 1801020
- Math proficiency
- 72% ▼ -5.00%
- Reading proficiency
- 72% ▼ -4.00%
- Median HH income
- $75,304
- Composite
- 63.45/100
- National rank
- #616
- State rank
- #2 of 301 in IN
Livability — Indianapolis city (balance)
No livability data for this city. (Only ~50 U.S. cities are tracked.)
Census & demographics
- County
- Marion County · 998,460 people
- City population
- 881,119
- Metro
- Indianapolis-Carmel-Anderson, IN
- Population (ZIP)
- 28,300
- Household income
- $83,190
- Rent vs Own
- Severe rent burden
- 764.0
Population outlook (Hendricks County) Hauer SSP2
- Today (2025)
- 187,418 people
- By 2030
- 201,494 · +7.5%
- By 2040
- 228,487 · +21.9%
- By 2050
- 253,068 · +35.0%
- By 2075
- 308,920 · +64.8%
- By 2100
- 336,510 · +79.6%
Race, ethnicity, and origin ACS 2023
- Neighborhood character
- Diverse neighborhood (Simpson 0.56)
- Race & ethnicity
- White 63% Black 19% Hispanic / Latino 10% Two or more races 7% Asian 4%
- Hispanic origin (detail)
- Mexican 6%
- Common ancestry
- Italian 2% Romanian 2% Iranian 2%
- Foreign-born
- 11% · Canada, China, United Kingdom
- Languages at home
- 82% English-only · Spanish 8% Other Indo-European 3% French/Haitian/Cajun 3%
Political lean MEDSL · Hendricks
- 2024 margin
- Strong R (+21.5) · D 38.4% · R 59.9% · Other 1.7%
- 2008→2024 swing
- +1.9pp toward D · 2008: -23.4pp · 2024: -21.5pp
- All cycles
- 2024: R+21.5 2020: R+23.9 2016: R+34.2 2012: R+34.9 2008: R+23.4
Not yet ingested
- Civics
- —
Market trends
- HPI YoY
- ▼ -106.23%
- Current HPI
- 215.5854
- Rent YoY
- ▲ 7.56%
- Metro
- Indianapolis-Carmel-Anderson, IN
- State GDP YoY
- ▲ 2.90%
- F500 in state
- 18
Industry mix (Fortune 500 HQ in IN)
| Industry | F500 HQs | Revenue |
|---|---|---|
| Industrial Machinery | 2 | $37B |
|
||
| Healthcare | 1 | $177B |
|
||
| Pharmaceuticals | 1 | $45B |
|
||
| Metals / Steel | 1 | $18B |
|
||
| Agriculture | 1 | $17B |
|
||
| Packaging | 1 | $12B |
|
||
Price history
+38.3% since first listed5 events — show timeline
- 2026-06-12 Listed $299,900 MIBOR as Distributed by MLS Grid
- 2020-11-30 Sold (MLS) $216,900 MIBOR as Distributed by MLS Grid
- 2020-11-24 Pending — MIBOR as Distributed by MLS Grid
- 2020-10-26 Pending — MIBOR as Distributed by MLS Grid
- 2020-10-22 Listed $216,900 MIBOR as Distributed by MLS Grid
Property tax history
+7.4%/yrLatest (2025): $2,804 · +18.2% YoY. Source: county tax records.
Cash-flow waterfall
monthlySold comps — $/sqft
last 12 mo · ≤1 miLoading sold comps…