 🏗️ New Construction
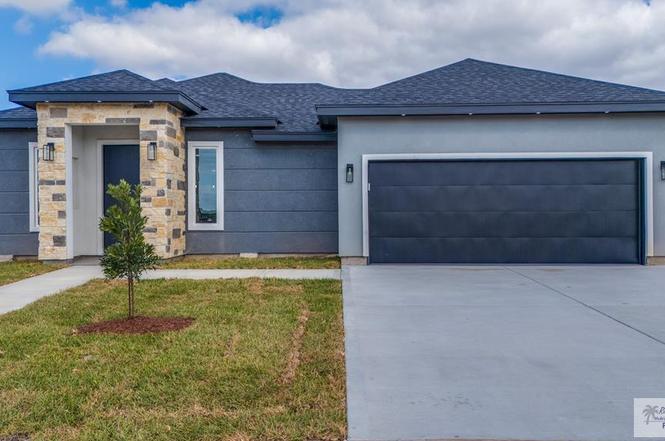
7150 Lake Tahoe · Brownsville, TX
Flood risk No data
- FEMA flood zone
- —
- Chance of flooding over 30 yrs
- —
- Est. flood insurance / yr
- —
Fire risk No data
- Est. fire insurance / yr
- —
Heat risk No data
- Hot days now (above threshold)
- —
- Hot days in 30 yrs
- —
Wind risk No data
- Chance of severe wind over 30 yrs
- —
Air-quality risk No data
- Unhealthy air days now
- —
- Unhealthy air days in 30 yrs
- —
Risk factors via First Street. Map © Google.
Why this score? — see what drove the D grade
The composite is a weighted blend of 9 inputs, each scored 0–100. Each bar is that input's sub-score; the figure is the points it added to the 100-point composite (weight × sub-score).
- Cash flow +12.4/30.0
- ARV discount +7.5/15.0
- Rent growth +5.0/5.0
- Condition / age +4.8/5.0
- Livability +4.0/5.0
- DSCR +3.7/10.0
- 1% rule +3.5/10.0
- Schools +3.3/10.0
- Appreciation +0.0/10.0
$319,000
🖨 Deal sheet (PDF) 📄 Offer letter ✓ Due diligence
Listing remarks
Brand New Home, Features 4 bedrooms 3.5 Bathrooms, corner Lot, experience indoor-outdoor living with a stunning interior courtyard. lot of storage.
Key facts
- Corner lot
- 6,387 sq ft lot
- Built 2026
Tags
Neighborhood map
What this means for you Summary
Snapshot
- This is a 4-bed/3.5-bath single-family listed at $319k. Condition is rated excellent.
Deal economics
- At list price, monthly cash flow is $-52 ($-621/yr) — negative.
- To cash-flow at today's rent, offer at most $304k (4.6% below list).
- To meet the 1% rule (rent ≥ 1% of price), the offer needs to be $266k (16.5% below list).
- Recommended offer: $266k (16.5% below list) — sets the bar for 1% rule.
- Cap rate 6.1% vs local median 5.0% in Brownsville — meaningfully above typical; check what's discounted (condition, days-on-market, listing class) to confirm the premium yield is real.
Location & tenants
- Location reads 79/100 on livability (#62 in TX, #2,311 nationally) — a middle-class / working-renter tenant base. Strengths: commute A+, cost of living A+, housing A+; Watch: amenities D, crime D-, employment F.
- Los Fresnos CISD (suburban): math 34% / reading 44% proficiency, ranked #444 of 826 in TX (top 54%) — families likely to look elsewhere, expect single-tenant / working-renter base with shorter leases.
- Zoned schools: Los Fresnos El (math 37% / reading 47%, grade F, #1,335 of 4,322 statewide, top 33%, 561 students, 76% FRL); Resaca Middle (math 29% / reading 44%, grade F, #786 of 1,662 statewide, top 48%, 857 students, 77% FRL); Los Fresnos H S (math 41% / reading 55%, grade D, #571 of 1,632 statewide, top 36%, 3,272 students, 82% FRL) — zoned schools average 78% FRL vs 43% district-wide (35 pts higher); higher-poverty schools than district average — tighter screening recommended.
- Market conditions: Rents rising fast (+11.4%/yr); 348 active listings in the ZIP; 4 comparable units currently listed for rent nearby; rentals at typical pace (median 23d on market — plan ~3-4 weeks tenant-placement turnaround); 2,326 units permitted in Cameron County in 2024 (503 in 5+ unit buildings).
- At $2,663/mo this rent would consume 64% of the median local household income ($50k/yr) (locally 1800% of renters already pay >50% of income on rent) — very limited rent-growth headroom before tenants either downsize or default.
Forward outlook
- Local home prices are declining (-3.0%/yr); year-one equity from $2k of loan paydown is wiped out by about $9k of value loss. Plan a longer hold.
- Cameron County population projected at +3% by 2050 — modest demand growth; plan on rents tracking national, not racing it.
Negotiation context
- It's been on market 29 days — a 2% lower offer ($314k) is reasonable based on typical stale-listing flexibility.
Questions for the listing agent
- What do current leases actually rent for vs. the listed asking? Can we see a recent rent roll and the last 12 months of T-12 income?
- Is there a deadline driving the sale (1031 exchange, divorce, estate, relocation)? That informs how much negotiation room exists.
- Crime grade is D in this area — have there been break-ins, vandalism, or insurance claims at this property in the last 3 years? What carrier currently insures it and at what premium?
- The area grade is low — what's the realistic commute time and amenity access for the typical tenant pool here? Any planned neighborhood developments (good or bad) we should know about?
- What's the average days-on-market for RENTAL listings here right now (not sales)? A rising rental-DOM trend means longer vacancies and softer asking-rent achievability than the comps imply.
- What's the recent tenant-quality profile in this submarket — average credit score on applications, eviction rate, late-payment / NSF rate, and stable-employment percentage? A property-management company in the area should have these aggregated.
- How much new for-sale + rental construction is in the pipeline within 1–3 miles? Heavy new supply typically softens prices + rents 12–24 months out; constrained supply supports both.
Investment metrics
- 1% rule
- 0.85% ✗
- Cap rate
- 6.09%
- Cash-on-cash
- -0.71%
- DSCR
- 0.97
- GRM
- 9.8
CMA / ARV
- ARV (on-the-fly)
- $311,928
- Comps found
- 12
Show comp detail 12 sales within ~0.75 mi
| Address | Dist | Beds/Ba | Sqft | Sold | Price | $/sf | Match |
|---|---|---|---|---|---|---|---|
| 7121 Lake Tahoe | 0.08mi | 4/2.5 | 1,927 (+1%) | 20mo | $316,000 | $164 | 74 |
| 7246 Lake Shasta | 0.05mi | 4/3.5 | 2,027 (+7%) | 18mo | $329,000 | $162 | 72 |
| 7417 Lake Havasu | 0.13mi | 4/3.5 | 2,090 (+10%) | 13mo | $329,900 | $158 | 67 |
| 8830 Wentz Lk | 0.42mi | 3/2.5 (-1) | 1,847 (-3%) | 0mo | $305,000 | $165 | 66 |
| 8879 Wentz Lk | 0.45mi | 3/2.5 (-1) | 1,917 (+1%) | 6mo | $309,000 | $161 | 63 |
| 7122 Lake Tahoe | 0.08mi | 3/2.5 (-1) | 1,750 (-8%) | 13mo | $289,000 | $165 | 63 |
| 8648 Verbena Ln | 0.09mi | 3/2.5 (-1) | 1,796 (-6%) | 18mo | $275,000 | $153 | 62 |
| 7026 Lake Almanor Dr | 0.08mi | 3/2.5 (-1) | 1,757 (-8%) | 15mo | $305,900 | $174 | 62 |
| 8723 Ashford | 0.38mi | 3/2.5 (-1) | 1,815 (-5%) | 8mo | $289,000 | $159 | 59 |
| 7423 Converse Lk | 0.26mi | 4/3.0 | 2,148 (+13%) | 10mo | $365,000 | $170 | 56 |
| 8827 Wentz Lk | 0.41mi | 3/2.5 (-1) | 2,066 (+9%) | 9mo | $336,000 | $163 | 50 |
| 8867 Wentz Lk | 0.48mi | 3/2.5 (-1) | 1,835 (-4%) | 18mo | $320,000 | $174 | 47 |
Match score weights: distance 35% · size 25% · config 20% · recency 20%. Top-matched comps best support the ARV.
Projected returns pro-forma
-3.0% appreciation · 8.0% rent growth · sell at horizon
- IRR
- -12.0%
- Equity multiple
- 0.55×
- Total profit
- $-39,729
- Equity at exit
- $46,509
- IRR
- 3.3%
- Equity multiple
- 1.29×
- Total profit
- $25,379
- Equity at exit
- $26,970
Cash invested: $87,340 (down + closing). Projections, not guarantees.
Landlord ↔ Tenant lean methodology
- Overall (STATE)
- 87 Strongly Landlord-Friendly
- State Texas
- 87 Strongly Landlord-Friendly · R+5
- County
- — inherits STATE
- City
- — inherits STATE
ZIP-level market 78520
- Home prices YoY
- -19.8%
- Rents YoY
- 11.4%
- Active inventory
- 348
- Price-to-rent
- 10.0×
Monthly cashflow live
- Estimated rent
- $2,663 medium interval (Pro) →
- Mortgage (P&I)
- −$1,636
- Tax est. 1.5%
- −$390 /mo · $4,679/yr
- Insurance
- −$130
- HOA
- −$0
- Vacancy / Maint / Mgmt
- −$559
- Net cashflow
- $-52
Break-even live
Sensitivity live
| Price | -10% $164 | -5% $56 | +0% $-52 | +5% $-160 | +10% $-267 |
|---|---|---|---|---|---|
| Rent | -10% $-262 | -5% $-157 | +0% $-52 | +5% $53 | +10% $159 |
| Rate | -1.0pp $105 | -0.5pp $28 | base $-52 | +0.5pp $-133 | +1.0pp $-215 |
UW: 25.0% down · 7.5% · 30yr · 1.5% tax · 5.0% vac · 8.0% maint · 8.0% mgmt
Financing live
Cash to close
- Down payment
- $77,982
- Closing costs
- $9,358
- Reserves months
- —
- Total cash needed
- —
Loan-product check · same deal, 3 products live
Conventional
25% down · 7.5% · 30yr
- Down + closing
- —
- Monthly P&I
- —
- Monthly cashflow
- —
- DSCR
- —
- Eligible?
- —
Personal DTI + credit; lowest rate.
DSCR
20% down · 8.5% · 30yr
- Down + closing
- —
- Monthly P&I
- —
- Monthly cashflow
- —
- DSCR
- —
- Eligible?
- —
No personal income docs; deal must DSCR.
Hard money
10% down · 12.0% · 12mo
- Down + closing
- —
- Monthly P&I
- —
- Monthly cashflow
- —
- DSCR
- —
- Eligible?
- —
Short-term bridge; refi at stabilization.
Rent comps 4 comps
| Address | Beds | Baths | Sqft | Rent | $/sqft | DOM | Units | Dist |
|---|---|---|---|---|---|---|---|---|
| 7425 Lake Havasu Brownsville, TX | 3.0 | 2.0 | 1786 | $2,700 | $1.51 | 23d | 1 | 0.08mi |
| 7425 Lake Havasu Brownsville, TX | 3.0 | 2.0 | 1786 | $2,700 | $1.51 | 15d | 1 | 0.08mi |
| 7072 Lago Vista Blvd Brownsville, TX | 3.0 | 3.0 | 2473 | $3,200 | $1.29 | 23d | 1 | 0.55mi |
| 7180 Dominica Dr Brownsville, TX | 4.0 | 4.0 | 2287 | $3,400 | $1.49 | 23d | 1 | 0.76mi |
Listing history 3 events
-
2026-04-03status Pending
-
2026-03-02price $319,000
-
2026-03-02$329,000 Active
ⓘ Source: listings_history table (triggers on properties + properties_extension) + one-shot
backfill from property_details.listing_events for pre-trigger history.
Nearby sold comps map
Loading sold comps map…
Walkable amenities ~0.75 mi
Loading nearby amenities…
Taxation est. · year 1
- Rental income
- $31,958
- − Mortgage interest
- −$17,473
- − Property taxes
- −$4,679
- − Insurance
- −$1,560
- − Repairs & maintenance
- −$2,557
- − Management
- −$2,557
- − Depreciation
- −$9,074
- Taxable loss
- −$5,941
- Est. tax savings @ 24.0%
- +$1,426
- After-tax cash flow
- $805/yr
For passive investors: Depreciation is non-cash, so a rental often shows a tax loss while cash-flowing — sheltering income. Rental losses are passive: they offset passive income freely, and up to $25,000/yr can offset ordinary (W-2) income if you actively participate and your MAGI is under $100k (phasing out to $0 by $150k); unused losses carry forward. On sale, claimed depreciation is recaptured at up to 25%, and gains may owe capital-gains tax (a 1031 exchange can defer both). Figures are a year-1 estimate at your 24.0% rate — not tax advice; consult a CPA.
Condition & rehab AI · 13 photos
This brand new home is move-in ready with modern finishes and a fresh exterior. It offers excellent curb appeal and is ideal for both resale and rental markets.
Value-add opportunities
- Both Painting the exterior — Enhances curb appeal and value
- Both Landscaping the front yard — Improves curb appeal and rental appeal
- Both Adding a smart home system — Enhances convenience and value
- Both Upgrading the kitchen appliances — Modernizes the space and adds value
Renovation cost estimate screening
Value-add ROI direction
- Both Painting the exterior — Enhances curb appeal and value ↑
- Both Landscaping the front yard — Improves curb appeal and rental appeal ↑
- Both Adding a smart home system — Enhances convenience and value ↑
- Both Upgrading the kitchen appliances — Modernizes the space and adds value ↑
ⓘ Cost ranges are severity-bucket heuristics (US national rule-of-thumb). Get contractor quotes + a written scope before underwriting a rehab budget.
Schools (NCES district)
- District
- Los Fresnos CISD
- NCES district ID
- 4828290
- Math proficiency
- 34% ▼ -30.00%
- Reading proficiency
- 44% ▼ -10.00%
- Median HH income
- $42,586
- Composite
- 32.92/100
- National rank
- #5601
- State rank
- #444 of 826 in TX
Livability — Brownsville
- Score
- 79/100
- State rank
- #62
- US rank
- #2311
Category grades
Schools grade is shown separately in the Schools card above.
Census & demographics
- County
- Cameron County · 310,734 people
- City population
- 212,132
- Metro
- Brownsville-Harlingen, TX
- Population (ZIP)
- 64,740
- Household income
- $50,116
- Rent vs Own
- Severe rent burden
- 1800.0
Population outlook (Cameron County) Hauer SSP2
- Today (2025)
- 441,603 people
- By 2030
- 448,113 · +1.5%
- By 2040
- 456,385 · +3.3%
- By 2050
- 456,294 · +3.3%
- By 2075
- 423,851 · -4.0%
- By 2100
- 342,787 · -22.4%
Race, ethnicity, and origin ACS 2023
- Neighborhood character
- Predominantly Hispanic (93%)
- Race & ethnicity
- Hispanic / Latino 93% Two or more races 44% White 6%
- Hispanic origin (detail)
- Mexican 88%
- Foreign-born
- 26% · Canada
- Languages at home
- 18% English-only · Spanish 82%
Political lean MEDSL · Cameron
- 2024 margin
- Lean R (+5.8) · D 46.7% · R 52.5%
- 2008→2024 swing
- -34.6pp toward R · 2008: 28.8pp · 2024: -5.8pp
- All cycles
- 2024: R+5.8 2020: D+13.2 2016: D+32.5 2012: D+32.4 2008: D+28.8
Not yet ingested
- Civics
- —
Market trends
- HPI YoY
- ▼ -52.91%
- Current HPI
- 214.4335
- Rent YoY
- ▲ 11.41%
- Metro
- Brownsville-Harlingen, TX
- State GDP YoY
- ▲ 3.95%
- F500 in state
- 110
Industry mix (Fortune 500 HQ in TX)
| Industry | F500 HQs | Revenue |
|---|---|---|
| Energy | 16 | $1,198B |
|
||
| Technology | 5 | $198B |
|
||
| Engineering / Construction | 4 | $72B |
|
||
| Energy Services | 3 | $60B |
|
||
| Utilities | 3 | $41B |
|
||
| Healthcare | 2 | $330B |
|
||
Price history
-3.0% since first listed3 events — show timeline
- 2026-04-03 Pending — RGVMLS
- 2026-03-02 Price Changed $319,000 RGVMLS
- 2026-03-02 Listed $329,000 RGVMLS
Cash-flow waterfall
monthlySold comps — $/sqft
last 12 mo · ≤1 miLoading sold comps…