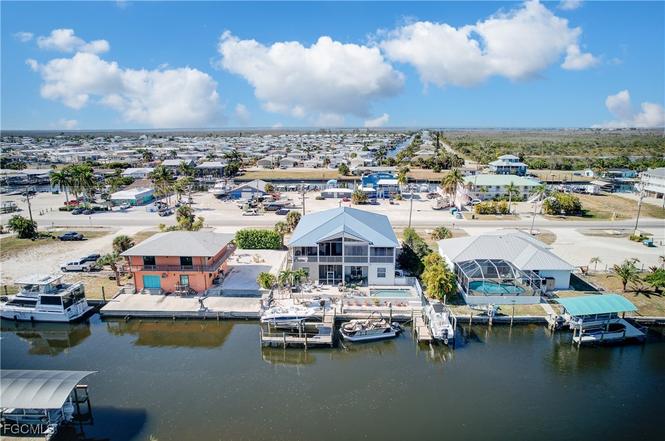
3184 Stringfellow Rd · St. James City, FL
Flood risk 8/10 · Major
- FEMA flood zone
- AE
- Chance of flooding over 30 yrs
- 0.97%
- Est. flood insurance / yr
- $1,737 – $8,500
Fire risk 3/10 · Minor
- Est. fire insurance / yr
- $947 – $1,759
Heat risk 10/10 · Severe
- Hot days now (above 107°F)
- 7 days/yr
- Hot days in 30 yrs
- 27 days/yr
Wind risk 10/10 · Severe
- Chance of severe wind over 30 yrs
- 99.0%
Air-quality risk 2/10 · Minimal
- Unhealthy air days now
- 1 days/yr
- Unhealthy air days in 30 yrs
- 2 days/yr
Risk factors via First Street. Map © Google.
Why this score? — see what drove the C grade
The composite is a weighted blend of 9 inputs, each scored 0–100. Each bar is that input's sub-score; the figure is the points it added to the 100-point composite (weight × sub-score).
- Cash flow +23.9/30.0
- DSCR +7.7/10.0
- ARV discount +7.5/15.0
- 1% rule +5.8/10.0
- Schools +4.1/10.0
- Rent growth +2.5/5.0
- Livability +2.5/5.0
- Condition / age +2.5/5.0
- Appreciation +0.0/10.0
$409,500
🖨 Deal sheet 📄 Offer letter ✓ Due diligence
Listing remarks
Welcome to your beautiful GULF ACCESS home with Private GUEST SUITE! Slide open the glass doors & enjoy the breezes and sunsets of the GULF! The main home makes a grand statement with vaulted ceiling, an abundance of windows and natural light. New Stainless appliances in the CHEFS Kitchen. The master suite offers sliding glass doors to the screened lanai, a large walk in shower and a walk in closet. An expansive screened lanai offers room for relaxing, dining and entertaining . The private attached two car garage includes plenty of room for bicycles, golf carts and more. The lower guest suite has a private entrance with kitchen and full bath. This piece of paradise sits on the can
Key facts
- Boat lift
- Canal with boat dock
- Gulf access
Tags
Property features AI
Finance
- Financial info: Pets allowed
- HOA & community: Community has 4 units; Boat facilities; Non-gated community; No association fee indicated
Exterior
- Parking: Attached 2-car garage; Driveway; Paved parking; Garage door opener
- Security: Smoke detectors; Security/high impact doors
- Utilities: Public water; Septic tank sewer; Cable not available
- Home design: 2 stories; Entry level: 1; West-facing; Has view; Waterfront with canal access to the Gulf; East exposure
- Construction: Built with block, concrete, stucco and vinyl siding; Metal roof
- Exterior features: Security/high impact doors; Room for pool; Storage; Water feature; Balcony; Lanai; Porch; Screened porch; Apartment (separate structure); Smoke detector(s)
Interior
- Kitchen: Dryer; Dishwasher; Electric cooktop; Freezer; Microwave; Range; Refrigerator; Self-cleaning oven
- Bedrooms: Multiple primary suites
- Flooring: Laminate; Tile
- Bathrooms: 3 full bathrooms; Separate shower
- Heating & cooling: Central heating (electric); Central air conditioning (electric)
- Interior features: Impact glass windows; Wheelchair access; Breakfast bar; Separate/formal dining room; Kitchen island; Living/dining room; Multiple primary suites; Pantry; Shower only with separate shower; Vaulted ceilings; Unfurnished
- Laundry & utility: Washer; Dryer; Laundry inside
Neighborhood map
What this means for you Summary
Snapshot
- This is a 3-bed/3.0-bath condo listed at $410k.
Deal economics
- At list price, monthly cash flow is $365 ($4k/yr) — positive.
- The deal already cash-flows at list — no discount required.
- Meets the 1% rule at list price ($4k rent vs $410k).
- Recommended offer: $360k (12.0% below list) — sets the bar for market timing.
- Cap rate 8.6% vs local median 4.9% in St. James City — top-decile yield for the area; either an underpriced asset or a hidden risk that comps aren't pricing in. Stress-test before assuming the spread holds.
Location & tenants
- Location reads: area grade C — affects rentability + tenant quality, not the cash-flow math above.
- Lee (suburban): math 47% / reading 50% proficiency, ranked #42 of 73 in FL (top 58%) — families likely to look elsewhere, expect single-tenant / working-renter base with shorter leases.
- Market conditions: 287 active listings in the ZIP; 5 comparable units currently listed for rent nearby; rentals at typical pace (median 24d on market — plan ~3-4 weeks tenant-placement turnaround); 15,411 units permitted in Lee County in 2024 (4,686 in 5+ unit buildings).
Forward outlook
- Local home prices are declining (-3.0%/yr); year-one equity from $3k of loan paydown is wiped out by about $12k of value loss. Plan a longer hold.
- Lee County population projected at +44% by 2050 — long-run rental-demand tailwind backs the buy-and-hold thesis.
Negotiation context
- It's been on market 162 days — a 12% lower offer ($360k) is reasonable based on typical stale-listing flexibility.
- 5 sale attempts since 8y ago; this cycle's ask has dropped $240k (37%) from the opening price — seller is motivated, your offer sets the floor, not the list.
- Current owner paid $317k; 29% above their basis — modest negotiation headroom, anchor on the comps not their cost.
Risks & watch-outs
- Watch-outs: flood insurance adds $427/mo.
- Climate carrying-cost: in FEMA flood zone AE (mandatory federal flood insurance); severe wind risk, 99% chance of damaging wind over 30y; extreme-heat days projected 7→27/yr by 2055 (HVAC capex compounding) — expect insurance premiums to compound above CPI over the hold.
Questions for the listing agent
- It's been on market 162 days. Have you received any prior offers? Is the seller open to a 12% concession, seller financing, or rate buy-down credit?
- What's the actual annual flood-insurance premium (NFIP or private), and is the property in a SFHA with mandatory coverage?
- Any open or pending special assessments — roof, HVAC, plumbing, elevator, façade? What's the per-unit balance and payoff schedule, and is the seller paying it off at close or rolling it to the buyer?
- Why hasn't it sold? Are there any deal-killer items the seller is aware of (foundation, flood, title, zoning, code violations)?
- Is there a deadline driving the sale (1031 exchange, divorce, estate, relocation)? That informs how much negotiation room exists.
- What's the average days-on-market for RENTAL listings here right now (not sales)? A rising rental-DOM trend means longer vacancies and softer asking-rent achievability than the comps imply.
- What's the recent tenant-quality profile in this submarket — average credit score on applications, eviction rate, late-payment / NSF rate, and stable-employment percentage? A property-management company in the area should have these aggregated.
- How much new apartment / multifamily construction is in the pipeline within 1–3 miles? Heavy new supply (>2% of stock underway) typically softens rents 12–24 months out; light construction supports rent growth.
Investment metrics
- 1% rule
- 1.08% ✓
- Cap rate
- 8.61%
- Cash-on-cash
- 8.29%
- DSCR
- 1.37
- GRM
- 7.7
CMA / ARV
No comps found within radius.
Projected returns pro-forma
-3.0% appreciation · 3.0% rent growth · sell at horizon
- IRR
- -10.2%
- Equity multiple
- 0.63×
- Total profit
- $-42,856
- Equity at exit
- $61,058
- IRR
- -0.8%
- Equity multiple
- 0.94×
- Total profit
- $-6,377
- Equity at exit
- $35,406
Cash invested: $114,660 (down + closing). Projections, not guarantees.
Landlord ↔ Tenant lean methodology
- Overall (STATE)
- 87 Strongly Landlord-Friendly
- State Florida
- 87 Strongly Landlord-Friendly · R+3
- County
- — inherits STATE
- City
- — inherits STATE
ZIP-level market 33956
- Home prices YoY
- -16.3%
- Active inventory
- 287
- Price-to-rent
- 7.7×
Monthly cashflow live
- Estimated rent
- $4,413 high interval (Pro) →
- Mortgage (P&I)
- −$2,147
- Tax from tax record
- −$377 /mo · $4,521/yr
- Insurance
- −$171
- Flood insurance flood zone
- −$427 /mo · $5,118/yr
- HOA
- −$0
- Vacancy / Maint / Mgmt
- −$927
- Net cashflow
- $365
Break-even live
UW: 25.0% down · 7.5% · 30yr · 1.5% tax · 5.0% vac · 8.0% maint · 8.0% mgmt
Financing live
Cash to close
- Down payment
- $102,375
- Closing costs
- $12,285
- Reserves months
- —
- Total cash needed
- —
Loan-product check · same deal, 3 products live
Conventional
25% down · 7.5% · 30yr
- Down + closing
- —
- Monthly P&I
- —
- Monthly cashflow
- —
- DSCR
- —
- Eligible?
- —
Personal DTI + credit; lowest rate.
DSCR
20% down · 8.5% · 30yr
- Down + closing
- —
- Monthly P&I
- —
- Monthly cashflow
- —
- DSCR
- —
- Eligible?
- —
No personal income docs; deal must DSCR.
Hard money
10% down · 12.0% · 12mo
- Down + closing
- —
- Monthly P&I
- —
- Monthly cashflow
- —
- DSCR
- —
- Eligible?
- —
Short-term bridge; refi at stabilization.
Rent comps 5 comps
| Address | Beds | Baths | Sqft | Rent | $/sqft | DOM | Units | Dist |
|---|---|---|---|---|---|---|---|---|
| 2951 York Rd Saint James City, FL | 2.0 | 2.0 | 1444 | $5,500 | $3.81 | 23d | 1 | 0.22mi |
| 3103 Harpoon Ln Saint James City, FL | 2.0 | 2.0 | 1094 | $3,000 | $2.74 | 23d | 1 | 0.34mi |
| 4011 Galt Island Ave Saint James City, FL | 3.0 | 2.0 | 1836 | $5,000 | $2.72 | 23d | 1 | 0.55mi |
| 3864 Royal Palm Dr Saint James City, FL | 2.0 | 1.0 | 960 | $1,650 | $1.72 | 23d | 1 | 0.60mi |
| 3811 Emerald Ave Saint James City, FL | 3.0 | 2.5 | 1500 | $5,500 | $3.67 | 23d | 1 | 0.91mi |
HOA detail condo
- Monthly dues
- $0 · $0/yr
- Assessments
- None detected in remarks — confirm with the listing agent.
Listing history 20 events
-
2026-05-03status Pending
-
2026-04-29price $409,500
-
2026-03-20price $489,500
-
2026-02-21price $575,900
-
2026-01-31price $625,000
-
2025-11-21$649,800 Active
-
2022-03-10status Pending
-
2022-03-10historical
-
2022-02-04$749,990 Active
-
2022-01-31historical
-
2022-01-13$784,900 Active
-
2020-06-26soldstatus $317,000
-
2019-03-01historical
-
2019-02-16price $310,000
-
2019-01-04$339,900 Active
-
2018-07-10historical
-
2018-06-26price $359,900
-
2018-05-04$369,500 Active
-
2016-03-15soldstatus $350,000
-
2004-08-02soldstatus $329,000
ⓘ Source: listings_history table (triggers on properties + properties_extension) + one-shot
backfill from property_details.listing_events for pre-trigger history.
Tax reassessment forecast FL · Resets to sale price
- Current annual tax
- $4,521 · $377/mo
- Projected year-2 tax
- $4,521 · $377/mo
- Expected delta
- $0/yr ($0/mo · 0.0%)
ⓘ Screening estimate from a state-policy table — verify with the county assessor before closing.
Climate risk First Street
- Flood 8/10 Severe FEMA zone AE · 97% chance over 30 yrs
- Wildfire 3/10 Moderate
- Heat 10/10 Extreme 7 d/yr ≥107°F today · 27 d/yr by 30 yrs out
- Wind 10/10 Extreme 99% chance of damaging wind over 30 yrs
- Air quality 2/10 Low 1 unhealthy d/yr today · 2 by 30 yrs out
Nearby sold comps map
Loading sold comps map…
Walkable amenities ~0.75 mi
Loading nearby amenities…
Taxation est. · year 1
- Rental income
- $52,959
- − Mortgage interest
- −$22,938
- − Property taxes
- −$4,521
- − Insurance
- −$7,166
- − Repairs & maintenance
- −$4,237
- − Management
- −$4,237
- − Depreciation
- −$11,913
- Taxable loss
- −$2,052
- Est. tax savings @ 24.0%
- +$493
- After-tax cash flow
- $4,874/yr
For passive investors: Depreciation is non-cash, so a rental often shows a tax loss while cash-flowing — sheltering income. Rental losses are passive: they offset passive income freely, and up to $25,000/yr can offset ordinary (W-2) income if you actively participate and your MAGI is under $100k (phasing out to $0 by $150k); unused losses carry forward. On sale, claimed depreciation is recaptured at up to 25%, and gains may owe capital-gains tax (a 1031 exchange can defer both). Figures are a year-1 estimate at your 24.0% rate — not tax advice; consult a CPA.
Schools (NCES district)
- District
- Lee
- NCES district ID
- 1201080
- Math proficiency
- 47% ▼ -11.00%
- Reading proficiency
- 50% ▼ -4.00%
- Median HH income
- $49,518
- Composite
- 41.49/100
- National rank
- #3458
- State rank
- #42 of 73 in FL
Livability — St. James City
No livability data for this city. (Only ~50 U.S. cities are tracked.)
Census & demographics
- Census place
- St. James City, FL
- Population (ZIP)
- 3,846
Population outlook (Lee County) Hauer SSP2
- Today (2025)
- 871,946 people
- By 2030
- 955,468 · +9.6%
- By 2040
- 1,113,587 · +27.7%
- By 2050
- 1,256,891 · +44.1%
- By 2075
- 1,560,270 · +78.9%
- By 2100
- 1,726,848 · +98.0%
Race, ethnicity, and origin ACS 2023
- Neighborhood character
- Predominantly White (94%)
- Race & ethnicity
- White 94% Two or more races 3% Pacific Islander 2% Hispanic / Latino 1%
- Common ancestry
- Romanian 6% Slovak 4% Iranian 3%
- Foreign-born
- 5% · Canada
- Languages at home
- 95% English-only · French/Haitian/Cajun 2% German/W. Germanic 2% Russian/Polish/Slavic 1%
Political lean MEDSL · Lee
- 2024 margin
- Strong R (+28.4) · D 35.5% · R 63.9%
- 2008→2024 swing
- -18.0pp toward R · 2008: -10.4pp · 2024: -28.4pp
- All cycles
- 2024: R+28.4 2020: R+19.2 2016: R+20.4 2012: R+16.6 2008: R+10.4
Not yet ingested
- Civics
- —
Market trends
- HPI YoY
- ▼ -58.47%
- Current HPI
- 300.1416
- Rent YoY
- —
- Metro
- —
- State GDP YoY
- ▲ 3.28%
- F500 in state
- 36
Industry mix (Fortune 500 HQ in FL)
| Industry | F500 HQs | Revenue |
|---|---|---|
| Industrial Technology | 2 | $29B |
|
||
| Insurance | 2 | $17B |
|
||
| Retail | 1 | $60B |
|
||
| Technology Distribution | 1 | $58B |
|
||
| Homebuilding | 1 | $35B |
|
||
| Technology Manufacturing | 1 | $35B |
|
||
Price history
+24.5% since first listed20 events — show timeline
- 2026-05-03 Pending — FORTMLS
- 2026-04-29 Price Changed $409,500 FORTMLS
- 2026-03-20 Price Changed $489,500 FORTMLS
- 2026-02-21 Price Changed $575,900 FORTMLS
- 2026-01-31 Price Changed $625,000 FORTMLS
- 2025-11-21 Listed $649,800 FORTMLS
- 2022-03-10 Pending — FORTMLS
- 2022-03-10 Listing Removed — FORTMLS
- 2022-02-04 Listed $749,990 FORTMLS
- 2022-01-31 Listing Removed — Stellar MLS as Distributed by MLS Grid
- 2022-01-13 Listed $784,900 Stellar MLS as Distributed by MLS Grid
- 2020-06-26 Sold (Public Records) $317,000 Public Records
- 2019-03-01 Listing Removed — FORTMLS
- 2019-02-16 Price Changed $310,000 FORTMLS
- 2019-01-04 Listed $339,900 FORTMLS
- 2018-07-10 Listing Removed — FORTMLS
- 2018-06-26 Price Changed $359,900 FORTMLS
- 2018-05-04 Listed $369,500 FORTMLS
- 2016-03-15 Sold (Public Records) $350,000 Public Records
- 2004-08-02 Sold (MLS) $329,000 FORTMLS
Property tax history
+4.8%/yrLatest (2025): $4,521 · +3.9% YoY. Source: county tax records.
Cash-flow waterfall
monthlySold comps — $/sqft
last 12 mo · ≤1 miLoading sold comps…