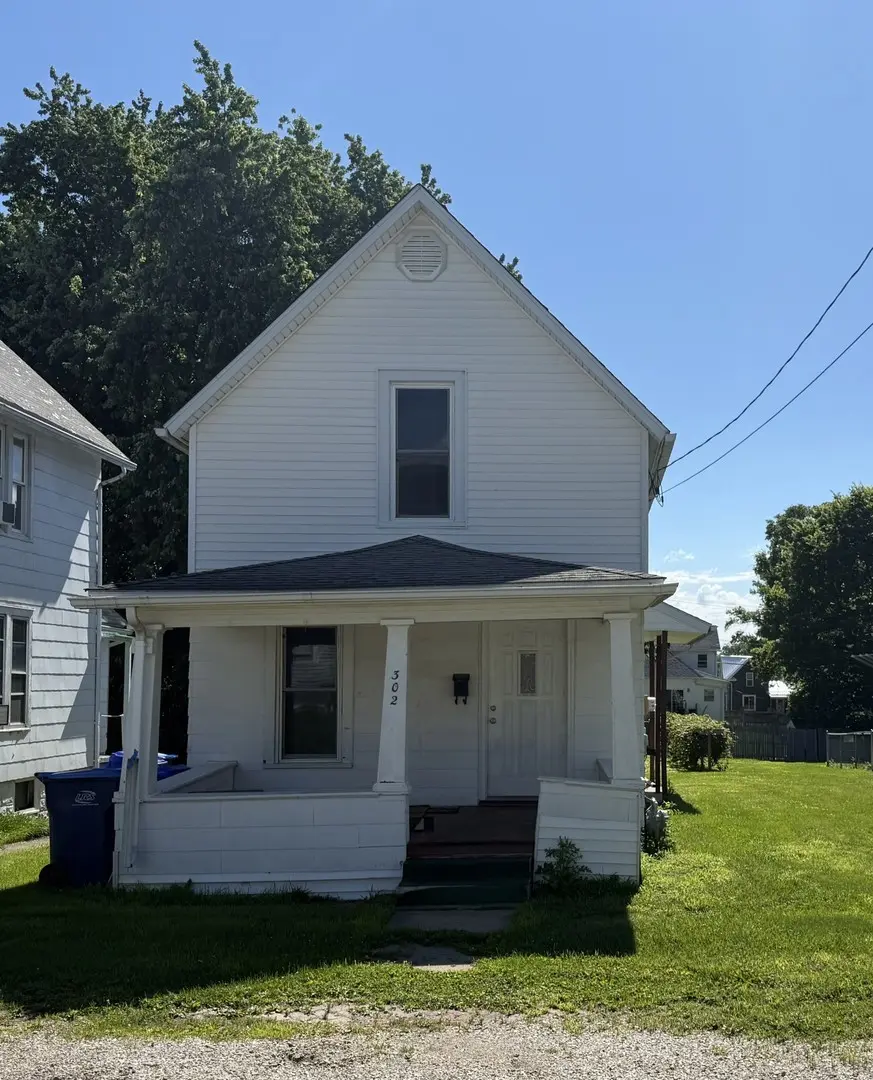
302 S Walnut St · Kewanee, IL
Flood risk 1/10 · Minimal
- FEMA flood zone
- X (unshaded)
- Chance of flooding over 30 yrs
- 0.0%
- Est. flood insurance / yr
- $473 – $860
Fire risk 1/10 · Minimal
- Est. fire insurance / yr
- $804 – $1,492
Heat risk 3/10 · Minor
- Hot days now (above 103°F)
- 7 days/yr
- Hot days in 30 yrs
- 17 days/yr
Wind risk 2/10 · Minimal
- Chance of severe wind over 30 yrs
- —
Air-quality risk 3/10 · Minor
- Unhealthy air days now
- 2 days/yr
- Unhealthy air days in 30 yrs
- 3 days/yr
Risk factors via First Street. Map © Google.
Why this score? — see what drove the B- grade
The composite is a weighted blend of 9 inputs, each scored 0–100. Each bar is that input's sub-score; the figure is the points it added to the 100-point composite (weight × sub-score).
- Cash flow +30.0/30.0
- 1% rule +10.0/10.0
- DSCR +10.0/10.0
- ARV discount +7.5/15.0
- Livability +3.5/5.0
- Rent growth +2.5/5.0
- Condition / age +2.5/5.0
- Schools +1.2/10.0
- Appreciation +0.0/10.0
$35,000
🖨 Deal sheet 📄 Offer letter ✓ Due diligence
Listing remarks
Affordable living or great investment opportunity! This home features a nice sized kitchen w/ corner China cabinet, laundry hook-ups & plenty of room for cooking! The spacious living room & formal dining room complete the main floor. The second floor offers a bedroom, full bath, and a large landing that could serve as a potential second bedroom, home office, or sitting area! Outside, you'll find a smaller, easy to maintain yard, perfect for those seeking low maintenance living! Whether you're looking for your first home, downsizing, or adding to your investment portfolio, this property offers plenty of potential & value!
Key facts
- Large landing
- Formal dining room
- Laundry hook-ups
Tags
Property features AI
Finance
- HOA & community: No master association fees required
Exterior
- Utilities: Public water; Public sewer
- Home design: Detached single-family home; 1.5-story layout; Fee simple ownership; Home is over 100 years old
- Construction: Asphalt roof; Vinyl siding and slate exterior materials; Brick/mortar foundation; Built before 1978
- Exterior features: Level lot; Lot dimensions approximately 24.75 x 150
Interior
- Kitchen: Kitchen on main level (11 x 13)
- Bedrooms: Master bedroom on second level (9 x 11); Additional bedroom; Additional bedroom; Office on second level (11 x 12)
- Flooring: Hardwood flooring in living room and dining room; Carpet in bedrooms and office; Linoleum in kitchen
- Bathrooms: 1 full bathroom
- Heating & cooling: Natural gas forced air heating; Central air conditioning
- Interior features: 5 total rooms; Unfinished full basement
- Laundry & utility: Laundry room; Washer and Dryer included
Neighborhood map
What this means for you Summary
Snapshot
- This is a 2-bed/1.0-bath single-family listed at $35k.
Deal economics
- At list price, monthly cash flow is $396 ($5k/yr) — positive.
- The deal already cash-flows at list — no discount required.
- Meets the 1% rule at list price ($859 rent vs $35k).
- Cap rate 19.9% vs local median 8.7% in Kewanee — top-decile yield for the area; either an underpriced asset or a hidden risk that comps aren't pricing in. Stress-test before assuming the spread holds.
Location & tenants
- Location reads 69/100 on livability (#409 in IL) — a middle-class / working-renter tenant base. Strengths: cost of living A+, health & safety A+, housing A; Watch: schools F, crime D-, amenities F.
- Kewanee CUSD 229 (town): math 8% / reading 20% proficiency, ranked #540 of 620 in IL (top 87%) — low school quality limits family demand, transient renter base, plan for 1-2y turnover; 73% free/reduced lunch — lower-income household profile, screen leases tightly.
- Market conditions: 39 active listings in the ZIP; 32 units permitted in Henry County in 2024 (0 in 5+ unit buildings).
Forward outlook
- Local home prices are declining (-3.0%/yr); year-one equity from $242 of loan paydown is wiped out by about $1k of value loss. Plan a longer hold.
- Henry County population projected at -16% by 2050 — secular population decline; favor cash flow + early exit over multi-decade hold.
- At projected returns (-3.0% appreciation + 3.0% rent growth), your $10k cash investment doubles in ~3 years — after that, you're playing with house money.
Negotiation context
- Only 2 days on market — expect competitive offers; lowballing is unlikely to land.
Risks & watch-outs
- Watch-outs: property tax is 2.9% of price; built in 1921 — expect roof / HVAC / electrical / plumbing capex.
Questions for the listing agent
- Built in 1921 — when were the roof, HVAC, electrical panel, plumbing, and water heater last replaced?
- Property tax is high relative to price — has the assessment been appealed recently, and will the sale trigger a re-assessment?
- Is there a deadline driving the sale (1031 exchange, divorce, estate, relocation)? That informs how much negotiation room exists.
- Schools are F-rated, which usually means shorter tenancies and higher turnover. Who's the typical renter profile here, and what's been the actual vacancy rate?
- Crime grade is D in this area — have there been break-ins, vandalism, or insurance claims at this property in the last 3 years? What carrier currently insures it and at what premium?
- What's the average days-on-market for RENTAL listings here right now (not sales)? A rising rental-DOM trend means longer vacancies and softer asking-rent achievability than the comps imply.
- What's the recent tenant-quality profile in this submarket — average credit score on applications, eviction rate, late-payment / NSF rate, and stable-employment percentage? A property-management company in the area should have these aggregated.
- How much new for-sale + rental construction is in the pipeline within 1–3 miles? Heavy new supply typically softens prices + rents 12–24 months out; constrained supply supports both.
Investment metrics
- 1% rule
- 2.46% ✓
- Cap rate
- 19.85%
- Cash-on-cash
- 48.43%
- DSCR
- 3.15
- GRM
- 3.4
CMA / ARV
- ARV (on-the-fly)
- $77,792
- Comps found
- 12
Show comp detail 12 sales within ~0.75 mi
| Address | Dist | Beds/Ba | Sqft | Sold | Price | $/sf | Match |
|---|---|---|---|---|---|---|---|
| 414 E Oak St | 0.05mi | 2/1.0 | 912 (+3%) | 8mo | $80,000 | $88 | 86 |
| 414 E Oak St | 0.05mi | 2/1.0 | 912 (+3%) | 8mo | $80,000 | $88 | 86 |
| 716 Morton Ave | 0.37mi | 2/1.0 | 912 (+3%) | 2mo | $94,000 | $103 | 76 |
| 518 E Division St | 0.43mi | 2/1.0 | 875 (-1%) | 12mo | $88,000 | $101 | 68 |
| 518 E Division St | 0.43mi | 2/1.0 | 875 (-1%) | 12mo | $88,000 | $101 | 68 |
| 727 Gilbert St | 0.39mi | 2/1.0 | 918 (+4%) | 12mo | $80,500 | $88 | 66 |
| 727 Gilbert St | 0.39mi | 2/1.0 | 918 (+4%) | 12mo | $80,500 | $88 | 66 |
| 216 E 2nd St | 0.29mi | 2/1.0 | 1,000 (+13%) | 13mo | $65,000 | $65 | 54 |
| 419 E Church St | 0.74mi | 2/1.0 | 840 (-5%) | 11mo | $78,500 | $93 | 48 |
| 419 E Church St | 0.74mi | 2/1.0 | 840 (-5%) | 11mo | $78,500 | $93 | 48 |
| 116 S Maple Ave | 0.44mi | 2/1.0 | 758 (-14%) | 14mo | $49,900 | $66 | 44 |
| 416 S Park St | 0.56mi | 3/1.0 (+1) | 1,008 (+14%) | 9mo | $25,000 | $25 | 38 |
Match score weights: distance 35% · size 25% · config 20% · recency 20%. Top-matched comps best support the ARV.
Projected returns pro-forma
-3.0% appreciation · 3.0% rent growth · sell at horizon
- IRR
- 46.0%
- Equity multiple
- 3.00×
- Total profit
- $19,558
- Equity at exit
- $5,219
- IRR
- 51.8%
- Equity multiple
- 6.06×
- Total profit
- $49,624
- Equity at exit
- $3,026
Cash invested: $9,800 (down + closing). Projections, not guarantees.
Landlord ↔ Tenant lean methodology
- Overall (STATE)
- 43 Moderately Tenant-Leaning
- State Illinois
- 43 Moderately Tenant-Leaning · D+7
- County
- — inherits STATE
- City
- — inherits STATE
ZIP-level market 61443
- Active inventory
- 39
- Price-to-rent
- 3.4×
Monthly cashflow live
- Estimated rent
- $859 medium interval (Pro) →
- Mortgage (P&I)
- −$184
- Tax from tax record
- −$85 /mo · $1,023/yr
- Insurance
- −$15
- HOA
- −$0
- Vacancy / Maint / Mgmt
- −$180
- Net cashflow
- $396
Break-even live
UW: 25.0% down · 7.5% · 30yr · 1.5% tax · 5.0% vac · 8.0% maint · 8.0% mgmt
Financing live
Cash to close
- Down payment
- $8,750
- Closing costs
- $1,050
- Reserves months
- —
- Total cash needed
- —
Loan-product check · same deal, 3 products live
Conventional
25% down · 7.5% · 30yr
- Down + closing
- —
- Monthly P&I
- —
- Monthly cashflow
- —
- DSCR
- —
- Eligible?
- —
Personal DTI + credit; lowest rate.
DSCR
20% down · 8.5% · 30yr
- Down + closing
- —
- Monthly P&I
- —
- Monthly cashflow
- —
- DSCR
- —
- Eligible?
- —
No personal income docs; deal must DSCR.
Hard money
10% down · 12.0% · 12mo
- Down + closing
- —
- Monthly P&I
- —
- Monthly cashflow
- —
- DSCR
- —
- Eligible?
- —
Short-term bridge; refi at stabilization.
Listing history 3 events
-
2026-06-18days on market $35,000 Active 2 DOM
-
2026-06-17remarks 634-char remark
-
2026-06-17$35,000 Active 1 DOM
ⓘ Source: listings_history table (triggers on properties + properties_extension) + one-shot
backfill from property_details.listing_events for pre-trigger history.
Tax reassessment forecast IL · Partial reset (capped growth)
- Current annual tax
- $1,023 · $85/mo
- Projected year-2 tax
- $1,023 · $85/mo
- Expected delta
- $0/yr ($0/mo · 0.0%)
ⓘ Screening estimate from a state-policy table — verify with the county assessor before closing.
Climate risk First Street
- Flood 1/10 Low FEMA zone X (unshaded) · 0% chance over 30 yrs
- Wildfire 1/10 Low
- Heat 3/10 Moderate 7 d/yr ≥103°F today · 17 d/yr by 30 yrs out
- Wind 2/10 Low
- Air quality 3/10 Moderate 2 unhealthy d/yr today · 3 by 30 yrs out
Nearby sold comps map
Loading sold comps map…
Walkable amenities ~0.75 mi
Loading nearby amenities…
Taxation est. · year 1
- Rental income
- $10,312
- − Mortgage interest
- −$1,961
- − Property taxes
- −$1,023
- − Insurance
- −$175
- − Repairs & maintenance
- −$825
- − Management
- −$825
- − Depreciation
- −$1,018
- Taxable income
- $4,486
- Est. tax owed @ 24.0%
- −$1,077
- After-tax cash flow
- $3,670/yr
For passive investors: Depreciation is non-cash, so a rental often shows a tax loss while cash-flowing — sheltering income. Rental losses are passive: they offset passive income freely, and up to $25,000/yr can offset ordinary (W-2) income if you actively participate and your MAGI is under $100k (phasing out to $0 by $150k); unused losses carry forward. On sale, claimed depreciation is recaptured at up to 25%, and gains may owe capital-gains tax (a 1031 exchange can defer both). Figures are a year-1 estimate at your 24.0% rate — not tax advice; consult a CPA.
Schools (NCES district)
- District
- Kewanee CUSD 229
- NCES district ID
- 1721000
- Math proficiency
- 8% ▼ -8.00%
- Reading proficiency
- 20% ▼ -12.00%
- Median HH income
- $38,294
- Composite
- 11.77/100
- National rank
- #9682
- State rank
- #540 of 620 in IL
Livability — Kewanee
- Score
- 69/100
- State rank
- #409
- US rank
- #8423
Category grades
Schools grade is shown separately in the Schools card above.
Census & demographics
- Census place
- Kewanee, IL
- Population (ZIP)
- 13,529
Population outlook (Henry County) Hauer SSP2
- Today (2025)
- 47,376 people
- By 2030
- 45,920 · -3.1%
- By 2040
- 42,829 · -9.6%
- By 2050
- 39,606 · -16.4%
- By 2075
- 31,848 · -32.8%
- By 2100
- 23,503 · -50.4%
Race, ethnicity, and origin ACS 2023
- Neighborhood character
- Predominantly White (79%)
- Race & ethnicity
- White 79% Hispanic / Latino 11% Black 6% Two or more races 5%
- Hispanic origin (detail)
- Mexican 9% Puerto Rican 1%
- Common ancestry
- Romanian 4% English 3% Italian 3%
- Foreign-born
- 3% · Canada
- Languages at home
- 92% English-only · Spanish 7%
Political lean MEDSL · Henry
- 2024 margin
- Strong R (+24.5) · D 36.8% · R 61.3% · Other 1.9%
- 2008→2024 swing
- -32.2pp toward R · 2008: 7.7pp · 2024: -24.5pp
- All cycles
- 2024: R+24.5 2020: R+21.4 2016: R+21.2 2012: D+3.1 2008: D+7.7
Not yet ingested
- Civics
- —
Market trends
- HPI YoY
- ▼ -68.32%
- Current HPI
- 121.8672
- Rent YoY
- —
- Metro
- —
- State GDP YoY
- ▲ 1.59%
- F500 in state
- 60
Industry mix (Fortune 500 HQ in IL)
| Industry | F500 HQs | Revenue |
|---|---|---|
| Insurance | 4 | $201B |
|
||
| Consumer Goods | 4 | $87B |
|
||
| Industrial Machinery | 3 | $64B |
|
||
| Healthcare | 2 | $55B |
|
||
| Retail / Pharmacy | 1 | $148B |
|
||
| Agriculture / Food | 1 | $86B |
|
||
Price history
1 event — show timeline
- 2026-06-16 Listed $35,000 MRED as Distributed by MLS Grid
Property tax history
+2.2%/yrLatest (2025): $1,023 · +3.9% YoY. Source: county tax records.
Cash-flow waterfall
monthlySold comps — $/sqft
last 12 mo · ≤1 miLoading sold comps…