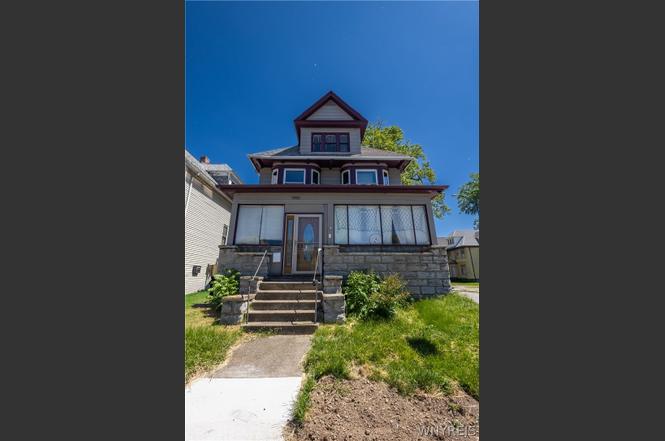
2302 Seneca St · Buffalo, NY
Flood risk 1/10 · Minimal
- FEMA flood zone
- X (unshaded)
- Chance of flooding over 30 yrs
- 0.0%
- Est. flood insurance / yr
- $473 – $860
Fire risk 1/10 · Minimal
- Est. fire insurance / yr
- $691 – $1,283
Heat risk 3/10 · Minor
- Hot days now (above 92°F)
- 7 days/yr
- Hot days in 30 yrs
- 16 days/yr
Wind risk 1/10 · Minimal
- Chance of severe wind over 30 yrs
- —
Air-quality risk 3/10 · Minor
- Unhealthy air days now
- 2 days/yr
- Unhealthy air days in 30 yrs
- 3 days/yr
Risk factors via First Street. Map © Google.
Why this score? — see what drove the C grade
The composite is a weighted blend of 9 inputs, each scored 0–100. Each bar is that input's sub-score; the figure is the points it added to the 100-point composite (weight × sub-score).
- ARV discount +15.0/15.0
- Cash flow +13.7/30.0
- Appreciation +10.0/10.0
- Rent growth +5.0/5.0
- DSCR +4.1/10.0
- Livability +3.9/5.0
- Schools +3.3/10.0
- 1% rule +2.5/10.0
- Condition / age +2.5/5.0
$219,900
🖨 Deal sheet (PDF) 📄 Offer letter ✓ Due diligence
Listing remarks MLS
Over 1,700 square foot colonial. Enclosed front porch leads you into a large foyer and then into the dance hall sized living room. Natural wood work, formal dining room with built in cabinets, nice working kitchen and half bath on the first floor. Spacious four bedrooms, and full bath upstairs as well as a full walk up attic. All the charm and character you would expect - Easy to Show, Call Today!
Key facts
- Fully fenced in yard
- 3,630 sq ft lot
- Garage
Tags
Property features AI
Exterior
- Parking: Detached garage; 1 garage space
- Utilities: Electricity connected; Public water connected; Sewer connected; Photovoltaic (solar) panels
- Home design: Two-story house; Vinyl siding; Asphalt roof; Existing/resale property
- Construction: Poured foundation; Vinyl siding construction; Asphalt roof
- Exterior features: Concrete driveway; Enclosed porch; Porch (screened); Fully fenced yard; Full fencing
Interior
- Kitchen: Dishwasher; Microwave
- Bedrooms: Total rooms: 10
- Flooring: Hardwood; Vinyl; Varies
- Bathrooms: 1 full bathroom; 1 half bathroom; Main level has a bathroom
- Heating & cooling: Gas forced-air heating
- Interior features: Leaded glass windows; Separate/formal dining room; Separate/formal living room; Enclosed porch; See remarks
- Laundry & utility: Gas water heater
Neighborhood map
What this means for you Summary
Snapshot
- This is a 4-bed/1.5-bath single-family listed at $220k.
Deal economics
- At list price, monthly cash flow is $14 ($170/yr) — positive.
- The deal already cash-flows at list — no discount required.
- To meet the 1% rule (rent ≥ 1% of price), the offer needs to be $166k (24.7% below list).
- Recommended offer: $166k (24.7% below list) — sets the bar for 1% rule.
- Cap rate 6.4% vs local median 8.1% in Buffalo — below-typical yield; the buyer is paying a premium for something (appreciation thesis, condition, location) that the cap rate doesn't capture.
Location & tenants
- Location reads 77/100 on livability (#195 in NY, #3,011 nationally) — a middle-class / working-renter tenant base. Strengths: commute A+, housing A+, health & safety A+; Watch: crime F, employment D-.
- Buffalo City School District (urban): math 41% / reading 40% proficiency, ranked #535 of 590 in NY (top 91%) — families likely to look elsewhere, expect single-tenant / working-renter base with shorter leases; 75% free/reduced lunch — lower-income household profile, screen leases tightly.
- Zoned schools: International School (math 8% / reading 17%, grade F, #2,048 of 2,108 statewide, top 97%, 981 students, 92% FRL); Hutchinson Central Technical High School (math 96% / reading 32%, grade B-, #807 of 1,100 statewide, top 73%, 1,175 students, 78% FRL).
- Market conditions: Rents rising fast (+12.7%/yr); 94 active listings in the ZIP; 2 comparable units currently listed for rent nearby; 1,244 units permitted in Erie County in 2024 (563 in 5+ unit buildings).
- This rent runs 37% of the median local income ($54k/yr) — at the standard rent-burdened threshold; future hikes will face affordability resistance.
Forward outlook
- In year one you build about $24k of equity ($2k loan paydown + $22k appreciation (10.0% local appreciation)).
- At projected returns (10.0% appreciation + 8.0% rent growth), your $62k cash investment doubles in ~3 years — after that, you're playing with house money.
- By year 2, paydown + projected appreciation supports a ~$38k cash-out refi (75% LTV) — recoverable capital for the next deal without selling this one.
Negotiation context
- It's been on market 113 days — a 9% lower offer ($200k) is reasonable based on typical stale-listing flexibility.
- 4 sale attempts since 10y ago with the ask held roughly flat each time — persistent listings suggest the price (not the market) is what's stuck; bring a comps-based counter.
- Current owner paid $34k; list at $220k implies a 547% gain — meaningful room to come down on a strong offer.
Risks & watch-outs
- Watch-outs: built in 1900 — expect roof / HVAC / electrical / plumbing capex.
Questions for the listing agent
- It's been on market 113 days. Have you received any prior offers? Is the seller open to a 25% concession, seller financing, or rate buy-down credit?
- Built in 1900 — when were the roof, HVAC, electrical panel, plumbing, and water heater last replaced?
- Why hasn't it sold? Are there any deal-killer items the seller is aware of (foundation, flood, title, zoning, code violations)?
- Is there a deadline driving the sale (1031 exchange, divorce, estate, relocation)? That informs how much negotiation room exists.
- Crime grade is F in this area — have there been break-ins, vandalism, or insurance claims at this property in the last 3 years? What carrier currently insures it and at what premium?
- What's the average days-on-market for RENTAL listings here right now (not sales)? A rising rental-DOM trend means longer vacancies and softer asking-rent achievability than the comps imply.
- What's the recent tenant-quality profile in this submarket — average credit score on applications, eviction rate, late-payment / NSF rate, and stable-employment percentage? A property-management company in the area should have these aggregated.
- How much new for-sale + rental construction is in the pipeline within 1–3 miles? Heavy new supply typically softens prices + rents 12–24 months out; constrained supply supports both.
Investment metrics
- 1% rule
- 0.75% ✗
- Cap rate
- 6.37%
- Cash-on-cash
- 0.28%
- DSCR
- 1.01
- GRM
- 11.1
CMA / ARV
- ARV (on-the-fly)
- $294,816
- Comps found
- 12
Show comp detail 12 sales within ~0.75 mi
| Address | Dist | Beds/Ba | Sqft | Sold | Price | $/sf | Match |
|---|---|---|---|---|---|---|---|
| 22 Cazenovia St | 0.42mi | 4/2.0 | 1,690 (-5%) | 3mo | $285,000 | $169 | 68 |
| 64 Alsace Ave | 0.63mi | 4/1.5 | 1,824 (+3%) | 1mo | $360,000 | $197 | 65 |
| 46 Benson Ave | 0.63mi | 4/2.0 | 1,760 (-1%) | 5mo | $270,000 | $153 | 63 |
| 22 Wichita Rd | 0.58mi | 4/2.0 | 1,876 (+6%) | 0mo | $252,000 | $134 | 61 |
| 55 Princeton Pl | 0.38mi | 5/1.0 (+1) | 1,617 (-9%) | 2mo | $190,000 | $118 | 59 |
| 368 Woodside Ave | 0.67mi | 3/1.0 (-1) | 1,750 (-2%) | 6mo | $290,000 | $166 | 54 |
| 123 Columbia Pkwy | 0.48mi | 3/1.5 (-1) | 1,566 (-12%) | 2mo | $260,000 | $166 | 51 |
| 179 Columbus Ave | 0.69mi | 3/1.5 (-1) | 1,664 (-6%) | 2mo | $272,026 | $163 | 50 |
| 2623 Seneca St | 0.60mi | 3/1.0 (-1) | 1,610 (-9%) | 2mo | $175,000 | $109 | 48 |
| 60 Lorraine Ave | 0.62mi | 4/2.0 | 1,581 (-11%) | 5mo | $359,000 | $227 | 47 |
| 70 Alsace Ave | 0.62mi | 3/2.0 (-1) | 1,968 (+11%) | 1mo | $341,000 | $173 | 45 |
| 850 Abbott Rd | 0.69mi | 4/1.0 | 1,584 (-11%) | 4mo | $275,000 | $174 | 44 |
Match score weights: distance 35% · size 25% · config 20% · recency 20%. Top-matched comps best support the ARV.
Projected returns pro-forma
10.0% appreciation · 8.0% rent growth · sell at horizon
- IRR
- 26.0%
- Equity multiple
- 3.10×
- Total profit
- $129,309
- Equity at exit
- $198,103
- IRR
- 24.0%
- Equity multiple
- 7.52×
- Total profit
- $401,549
- Equity at exit
- $427,217
Cash invested: $61,572 (down + closing). Projections, not guarantees.
Landlord ↔ Tenant lean methodology
- Overall (STATE)
- 15 Strongly Tenant-Friendly
- State New York
- 15 Strongly Tenant-Friendly · D+10
- County
- — inherits STATE
- City
- — inherits STATE
ZIP-level market 14210
- Home prices YoY
- 13.8%
- Rents YoY
- 12.7%
- Active inventory
- 94
- Price-to-rent
- 11.1×
Monthly cashflow live
- Estimated rent
- $1,657 medium interval (Pro) →
- Mortgage (P&I)
- −$1,153
- Tax from tax record
- −$50 /mo · $598/yr
- Insurance
- −$92
- HOA
- −$0
- Lot rent
- −$0
- Vacancy / Maint / Mgmt
- −$348
- Net cashflow
- $14
Break-even live
Sensitivity live
| Price | -10% $139 | -5% $76 | +0% $14 | +5% $-48 | +10% $-110 |
|---|---|---|---|---|---|
| Rent | -10% $-117 | -5% $-51 | +0% $14 | +5% $80 | +10% $145 |
| Rate | -1.0pp $125 | -0.5pp $70 | base $14 | +0.5pp $-43 | +1.0pp $-101 |
UW: 25.0% down · 7.5% · 30yr · 1.5% tax · 5.0% vac · 8.0% maint · 8.0% mgmt
Financing live
Cash to close
- Down payment
- $54,975
- Closing costs
- $6,597
- Reserves months
- —
- Total cash needed
- —
Loan-product check · same deal, 3 products live
Conventional
25% down · 7.5% · 30yr
- Down + closing
- —
- Monthly P&I
- —
- Monthly cashflow
- —
- DSCR
- —
- Eligible?
- —
Personal DTI + credit; lowest rate.
DSCR
20% down · 8.5% · 30yr
- Down + closing
- —
- Monthly P&I
- —
- Monthly cashflow
- —
- DSCR
- —
- Eligible?
- —
No personal income docs; deal must DSCR.
Hard money
10% down · 12.0% · 12mo
- Down + closing
- —
- Monthly P&I
- —
- Monthly cashflow
- —
- DSCR
- —
- Eligible?
- —
Short-term bridge; refi at stabilization.
Rent comps 2 comps
| Address | Beds | Baths | Sqft | Rent | $/sqft | DOM | Units | Dist |
|---|---|---|---|---|---|---|---|---|
| 74 Woodside Ave Unit 1 Buffalo, NY | 3.0 | 1.0 | 1250 | $1,510 | $1.21 | 0d | 1 | 1.05mi |
| 89 Macamley St #2 Buffalo, NY | 3.0 | 1.0 | 1274 | $1,100 | $0.86 | 12d | 1 | 1.14mi |
Listing history 12 events
-
2026-06-22days on market $219,900 Active 113 DOM
-
2026-06-21days on market $219,900 Active 112 DOM
-
2026-06-18days on market $219,900 Active 109 DOM
-
2026-06-17days on market $219,900 Active 108 DOM
-
2026-06-16days on market $219,900 Active 107 DOM
-
2026-06-15days on market $219,900 Active 106 DOM
-
2026-06-13days on market $219,900 Active 104 DOM
-
2026-06-13days on market $219,900 Active 103 DOM
-
2026-06-10days on market $219,900 Active 101 DOM
-
2026-06-09days on market $219,900 Active 100 DOM
-
2026-06-08remarks 602-char remark
-
2026-06-08$219,900 Active 99 DOM
ⓘ Source: listings_history table (triggers on properties + properties_extension) + one-shot
backfill from property_details.listing_events for pre-trigger history.
Tax reassessment forecast NY · Partial reset (capped growth)
- Current annual tax
- $598 · $50/mo
- Projected year-2 tax
- $2,157 · $180/mo
- Expected delta
- +$1,559/yr (+$130/mo · 260.9%)
ⓘ Screening estimate from a state-policy table — verify with the county assessor before closing.
Climate risk First Street
- Flood 1/10 Low FEMA zone X (unshaded) · 0% chance over 30 yrs
- Wildfire 1/10 Low
- Heat 3/10 Moderate 7 d/yr ≥92°F today · 16 d/yr by 30 yrs out
- Wind 1/10 Low
- Air quality 3/10 Moderate 2 unhealthy d/yr today · 3 by 30 yrs out
Nearby sold comps map
Loading sold comps map…
Walkable amenities ~0.75 mi
Loading nearby amenities…
Taxation est. · year 1
- Rental income
- $19,881
- − Mortgage interest
- −$12,318
- − Property taxes
- −$598
- − Insurance
- −$1,100
- − Repairs & maintenance
- −$1,590
- − Management
- −$1,590
- − Depreciation
- −$6,397
- Taxable loss
- −$3,712
- Est. tax savings @ 24.0%
- +$891
- After-tax cash flow
- $1,061/yr
For passive investors: Depreciation is non-cash, so a rental often shows a tax loss while cash-flowing — sheltering income. Rental losses are passive: they offset passive income freely, and up to $25,000/yr can offset ordinary (W-2) income if you actively participate and your MAGI is under $100k (phasing out to $0 by $150k); unused losses carry forward. On sale, claimed depreciation is recaptured at up to 25%, and gains may owe capital-gains tax (a 1031 exchange can defer both). Figures are a year-1 estimate at your 24.0% rate — not tax advice; consult a CPA.
Schools (NCES district)
- District
- Buffalo City School District
- NCES district ID
- 3605850
- Math proficiency
- 41% ▲ 11.00%
- Reading proficiency
- 40% ▲ 7.00%
- Median HH income
- $31,665
- Composite
- 33.17/100
- National rank
- #5544
- State rank
- #535 of 590 in NY
Livability — Buffalo
- Score
- 77/100
- State rank
- #195
- US rank
- #3011
Category grades
Schools grade is shown separately in the Schools card above.
Census & demographics
- Census place
- Buffalo, NY
- County
- Erie County · 714,559 people
- City population
- 440,021
- Metro
- Buffalo-Cheektowaga, NY
- Population (ZIP)
- 15,563
- Household income
- $54,197
- Rent vs Own
- Severe rent burden
- 959.0
Population outlook (Erie County) Hauer SSP2
- Today (2025)
- 933,037 people
- By 2030
- 935,181 · +0.2%
- By 2040
- 928,531 · -0.5%
- By 2050
- 905,725 · -2.9%
- By 2075
- 834,037 · -10.6%
- By 2100
- 708,033 · -24.1%
Race, ethnicity, and origin ACS 2023
- Neighborhood character
- Predominantly White (79%)
- Race & ethnicity
- White 79% Two or more races 8% Black 8% Hispanic / Latino 7% Asian 1%
- Hispanic origin (detail)
- Puerto Rican 6%
- Common ancestry
- Romanian 21% Lithuanian 2% Serbian 1%
- Foreign-born
- 2% · Canada, China
- Languages at home
- 95% English-only · Spanish 2% Arabic 1% Other Indo-European 1%
Political lean MEDSL · Erie
- 2024 margin
- Lean D (+9.7) · D 54.8% · R 45.2%
- 2008→2024 swing
- -7.9pp toward R · 2008: 17.5pp · 2024: 9.7pp
- All cycles
- 2024: D+9.7 2020: D+14.7 2016: D+4.8 2012: D+15.6 2008: D+17.5
Not yet ingested
- Civics
- —
Market trends
- HPI YoY
- ▲ 52.34%
- Current HPI
- 431.7951
- Rent YoY
- ▲ 12.67%
- Metro
- Buffalo-Cheektowaga, NY
- State GDP YoY
- ▲ 2.60%
- F500 in state
- 92
Industry mix (Fortune 500 HQ in NY)
| Industry | F500 HQs | Revenue |
|---|---|---|
| Financial Services | 10 | $950B |
|
||
| Consumer Goods | 9 | $162B |
|
||
| Insurance | 4 | $225B |
|
||
| Telecommunications | 2 | $144B |
|
||
| Pharmaceuticals | 2 | $112B |
|
||
| Media / Entertainment | 2 | $69B |
|
||
Price history
+269.6% since first listed13 events — show timeline
- 2026-06-08 Relisted — WNYREIS
- 2025-09-22 Price Changed $219,900 WNYREIS
- 2025-09-08 Listing Removed — WNYREIS
- 2025-09-08 Listed $229,900 WNYREIS
- 2025-07-23 Contingent — WNYREIS
- 2025-05-06 Pending — WNYREIS
- 2025-03-20 Listed $229,900 WNYREIS
- 2016-09-01 Sold (MLS) $34,000 WNYREIS
- 2016-06-28 Pending — WNYREIS
- 2016-06-23 Contingent — WNYREIS
- 2016-06-12 Listed $34,000 WNYREIS
- 2006-10-24 Sold (Public Records) $53,000 Public Records
- 1995-11-29 Sold (Public Records) $59,500 Public Records
Property tax history
+5.8%/yrLatest (2025): $598 · +40.3% YoY. Source: county tax records.
Cash-flow waterfall
monthlySold comps — $/sqft
last 12 mo · ≤1 miLoading sold comps…