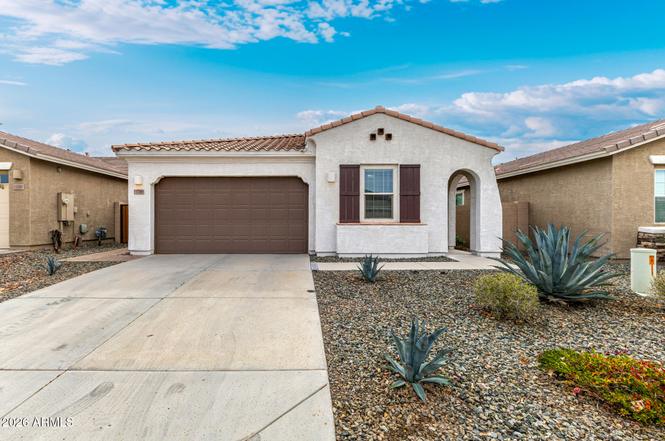
11769 E Chevelon Trl · Gold Canyon, AZ
Flood risk 1/10 · Minimal
- FEMA flood zone
- X (unshaded)
- Chance of flooding over 30 yrs
- 0.0%
- Est. flood insurance / yr
- $507 – $1,088
Fire risk 6/10 · Moderate
- Est. fire insurance / yr
- $610 – $1,132
Heat risk 9/10 · Severe
- Hot days now (above 111°F)
- 7 days/yr
- Hot days in 30 yrs
- 19 days/yr
Wind risk 1/10 · Minimal
- Chance of severe wind over 30 yrs
- —
Air-quality risk 2/10 · Minimal
- Unhealthy air days now
- 2 days/yr
- Unhealthy air days in 30 yrs
- 2 days/yr
Risk factors via First Street. Map © Google.
Why this score? — see what drove the D+ grade
The composite is a weighted blend of 9 inputs, each scored 0–100. Each bar is that input's sub-score; the figure is the points it added to the 100-point composite (weight × sub-score).
- ARV discount +15.0/15.0
- Cash flow +14.5/30.0
- DSCR +4.4/10.0
- 1% rule +3.6/10.0
- Livability +2.9/5.0
- Rent growth +2.5/5.0
- Condition / age +2.5/5.0
- Schools +1.5/10.0
- Appreciation +0.0/10.0
$409,000
🖨 Deal sheet 📄 Offer letter ✓ Due diligence
Listing remarks
Move-in-ready and designed for easy living, this energy-efficient 4-bedroom home with a 2-car garage and OWNED SOLAR is ready to impress! Inside, a welcoming great room offers the perfect setting for relaxing or gathering with friends, complemented by carpet and tile flooring in all the right places. The kitchen shines with matching appliances, neutral cabinetry, generous counter space, a walk-in pantry, and a center island with a breakfast bar ideal for casual meals or morning coffee. Spacious main bedroom provides a peaceful retreat, complete with a walk-in closet and a private bathroom featuring dual sinks. Out back, enjoy a serene yard with a covered patio and plenty of room to add a po
Key facts
- Covered patio
- Great room
- Walk in pantry
Tags
Property features AI
Finance
- HOA & community: Monthly HOA fee of $100 covering grounds maintenance; Community amenities include pickleball and tennis courts, playground, and biking/walking path
Exterior
- Parking: 2 covered parking spaces; 2-car garage with garage door opener and direct access
- Utilities: City water; Public sewer
- Home design: Single family residence; Fee simple ownership
- Construction: Stucco and wood frame construction; Tile roof
- Exterior features: Desert front yard; Desert back yard; Mountain views; City-maintained road
Interior
- Kitchen: Built-in microwave; Kitchen island; Laminate counters; Pantry; Refrigerator; Dishwasher; Garbage disposal; Breakfast bar
- Bedrooms: Up to 4 bedrooms
- Flooring: Carpet; Tile
- Bathrooms: 2 full bathrooms
- Heating & cooling: Electric heating; Central air; Ceiling fans
- Interior features: High-speed internet; Double vanity; Breakfast bar; No interior steps; Kitchen island; Pantry; Full bath in master bedroom; Laminate counters; Dual-pane windows; Lever handle door hardware
- Laundry & utility: Indoor laundry; Washer/dryer hookup only
Neighborhood map
What this means for you Summary
Snapshot
- This is a 4-bed/2.0-bath single-family listed at $409k.
Deal economics
- At list price, monthly cash flow is $91 ($1k/yr) — positive.
- The deal already cash-flows at list — no discount required.
- To meet the 1% rule (rent ≥ 1% of price), the offer needs to be $353k (13.8% below list).
- Recommended offer: $353k (13.8% below list) — sets the bar for 1% rule.
- Cap rate 6.6% vs local median 3.9% in Gold Canyon — top-decile yield for the area; either an underpriced asset or a hidden risk that comps aren't pricing in. Stress-test before assuming the spread holds.
Location & tenants
- Location reads 57/100 on livability (#225 in AZ) — a working-class tenant base; expect higher turnover. Strengths: crime A+, housing A+, employment A; Watch: amenities F, commute F, health & safety D-.
- Apache Junction Unified District (4443) (suburban): math 15% / reading 20% proficiency, ranked #195 of 249 in AZ (top 78%) — low school quality limits family demand, transient renter base, plan for 1-2y turnover.
- Zoned schools: Peralta Trail Elementary School (math 17% / reading 26%, grade F, #717 of 1,109 statewide, top 65%, 286 students, 74% FRL); Apache Junction High School (math 12% / reading 17%, grade F, #267 of 381 statewide, top 72%, 999 students, 48% FRL).
- Market conditions: 425 active listings in the ZIP; 9 comparable units currently listed for rent nearby; rentals leasing fast (median 13d on market — plan ~1-2 weeks tenant-placement turnaround); solid renter incomes; 9,504 units permitted in Pinal County in 2024 (776 in 5+ unit buildings).
- At $3,527/mo this rent would consume 49% of the median local household income ($86k/yr) (locally 160% of renters already pay >50% of income on rent) — very limited rent-growth headroom before tenants either downsize or default.
Forward outlook
- Local home prices are declining (-3.0%/yr); year-one equity from $3k of loan paydown is wiped out by about $12k of value loss. Plan a longer hold.
Negotiation context
- It's been on market 98 days — a 9% lower offer ($372k) is reasonable based on typical stale-listing flexibility.
Risks & watch-outs
- Climate carrying-cost: major wildfire risk; extreme-heat days projected 7→19/yr by 2055 (HVAC capex compounding) — expect insurance premiums to compound above CPI over the hold.
Questions for the listing agent
- It's been on market 98 days. Have you received any prior offers? Is the seller open to a 14% concession, seller financing, or rate buy-down credit?
- What does the HOA fee cover, when was the last increase, and are there any pending special assessments or reserve-fund shortfalls?
- Why hasn't it sold? Are there any deal-killer items the seller is aware of (foundation, flood, title, zoning, code violations)?
- Is there a deadline driving the sale (1031 exchange, divorce, estate, relocation)? That informs how much negotiation room exists.
- Schools are D-rated, which usually means shorter tenancies and higher turnover. Who's the typical renter profile here, and what's been the actual vacancy rate?
- The area grade is low — what's the realistic commute time and amenity access for the typical tenant pool here? Any planned neighborhood developments (good or bad) we should know about?
- What's the average days-on-market for RENTAL listings here right now (not sales)? A rising rental-DOM trend means longer vacancies and softer asking-rent achievability than the comps imply.
- What's the recent tenant-quality profile in this submarket — average credit score on applications, eviction rate, late-payment / NSF rate, and stable-employment percentage? A property-management company in the area should have these aggregated.
- How much new for-sale + rental construction is in the pipeline within 1–3 miles? Heavy new supply typically softens prices + rents 12–24 months out; constrained supply supports both.
Investment metrics
- 1% rule
- 0.86% ✗
- Cap rate
- 6.56%
- Cash-on-cash
- 0.95%
- DSCR
- 1.04
- GRM
- 9.7
CMA / ARV
- ARV (on-the-fly)
- $533,448
- Comps found
- 12
Show comp detail 12 sales within ~0.75 mi
| Address | Dist | Beds/Ba | Sqft | Sold | Price | $/sf | Match |
|---|---|---|---|---|---|---|---|
| 7764 S Agassiz Peak Ct | 0.15mi | 4/2.0 | 1,992 (+4%) | 1mo | $438,500 | $220 | 85 |
| 12221 E Chiricahua Pl | 0.30mi | 4/2.5 | 1,946 (+2%) | 2mo | $574,000 | $295 | 79 |
| 12259 E Chiricahua Pl | 0.32mi | 4/2.5 | 1,946 (+2%) | 2mo | $610,000 | $313 | 78 |
| 12374 E Pivot Peak -- | 0.47mi | 4/3.0 | 1,961 (+3%) | 1mo | $575,000 | $293 | 69 |
| 10039 E Legend Ct | 0.23mi | 3/2.0 (-1) | 1,697 (-11%) | 1mo | $442,000 | $260 | 65 |
| 10109 E Trailhead Ct | 0.61mi | 3/2.0 (-1) | 1,930 (+1%) | 2mo | $449,900 | $233 | 64 |
| 10238 E Peralta Canyon Dr | 0.56mi | 3/2.0 (-1) | 1,866 (-2%) | 2mo | $520,000 | $279 | 63 |
| 12438 E Parsons Peak -- | 0.42mi | 3/2.0 (-1) | 1,770 (-7%) | 1mo | $600,000 | $339 | 62 |
| 12686 E Pivot Peak -- | 0.64mi | 4/2.0 | 2,000 (+5%) | 1mo | $545,000 | $273 | 62 |
| 12674 E Pivot Peak -- | 0.64mi | 4/3.0 | 1,961 (+3%) | 1mo | $487,000 | $248 | 62 |
| 10284 E Meandering Trail Ln | 0.26mi | 3/2.0 (-1) | 1,643 (-14%) | 1mo | $478,000 | $291 | 59 |
| 10465 E Dutchmans Trl | 0.51mi | 3/2.0 (-1) | 2,166 (+13%) | 2mo | $420,000 | $194 | 47 |
Match score weights: distance 35% · size 25% · config 20% · recency 20%. Top-matched comps best support the ARV.
Projected returns pro-forma
-3.0% appreciation · 3.0% rent growth · sell at horizon
- IRR
- -14.8%
- Equity multiple
- 0.47×
- Total profit
- $-60,499
- Equity at exit
- $60,983
- IRR
- -6.1%
- Equity multiple
- 0.60×
- Total profit
- $-45,319
- Equity at exit
- $35,363
Cash invested: $114,520 (down + closing). Projections, not guarantees.
Landlord ↔ Tenant lean methodology
- Overall (STATE)
- 87 Strongly Landlord-Friendly
- State Arizona
- 87 Strongly Landlord-Friendly · R+3
- County
- — inherits STATE
- City
- — inherits STATE
ZIP-level market 85118
- Home prices YoY
- -32.4%
- Active inventory
- 425
- Price-to-rent
- 9.7×
Monthly cashflow live
- Estimated rent
- $3,527 high interval (Pro) →
- Mortgage (P&I)
- −$2,145
- Tax from tax record
- −$280 /mo · $3,358/yr
- Insurance
- −$170
- HOA
- −$100
- Vacancy / Maint / Mgmt
- −$741
- Net cashflow
- $91
Break-even live
UW: 25.0% down · 7.5% · 30yr · 1.5% tax · 5.0% vac · 8.0% maint · 8.0% mgmt
Financing live
Cash to close
- Down payment
- $102,250
- Closing costs
- $12,270
- Reserves months
- —
- Total cash needed
- —
Loan-product check · same deal, 3 products live
Conventional
25% down · 7.5% · 30yr
- Down + closing
- —
- Monthly P&I
- —
- Monthly cashflow
- —
- DSCR
- —
- Eligible?
- —
Personal DTI + credit; lowest rate.
DSCR
20% down · 8.5% · 30yr
- Down + closing
- —
- Monthly P&I
- —
- Monthly cashflow
- —
- DSCR
- —
- Eligible?
- —
No personal income docs; deal must DSCR.
Hard money
10% down · 12.0% · 12mo
- Down + closing
- —
- Monthly P&I
- —
- Monthly cashflow
- —
- DSCR
- —
- Eligible?
- —
Short-term bridge; refi at stabilization.
Rent comps 9 comps
| Address | Beds | Baths | Sqft | Rent | $/sqft | DOM | Units | Dist |
|---|---|---|---|---|---|---|---|---|
| 11757 E Chevelon Trl Gold Canyon, AZ | 3.0 | 2.0 | 1777 | $4,500 | $2.53 | 1d | 1 | 0.04mi |
| 12356 E Soloman Rd Gold Canyon, AZ | 4.0 | 3.0 | 2268 | $4,500 | $1.98 | 1d | 1 | 0.37mi |
| 8226 S Hidden Trail Ct Unit 1545711P Gold Canyon, AZ | 3.0 | 2.0 | 1291 | $6,243 | $4.84 | 12d | 1 | 0.41mi |
| 7605 S Thimble Peak Gold Canyon, AZ | 3.0 | 3.0 | 1937 | $2,149 | $1.11 | 15d | 1 | 0.64mi |
| 6298 S La Paloma Ct Gold Canyon, AZ | 4.0 | 2.0 | 1929 | $10,000 | $5.18 | 2d | 1 | 0.82mi |
| 6494 S Foothills Dr Gold Canyon, AZ | 3.0 | 2.0 | 1450 | $2,300 | $1.59 | 16d | 1 | 0.87mi |
| 6816 S Russet Sky Way Gold Canyon, AZ | 3.0 | 2.0 | 1366 | $1,800 | $1.32 | 24d | 1 | 0.97mi |
| 10100 E Agua Vista Way Gold Canyon, AZ | 3.0 | 2.0 | 1812 | $2,050 | $1.13 | 22d | 1 | 1.34mi |
| 8950 E Yucca Blossom Dr Gold Canyon, AZ | 3.0 | 2.0 | 1952 | $1,999 | $1.02 | 5d | 1 | 1.40mi |
HOA detail
- Monthly dues
- $100 · $1,200/yr
Listing history 5 events
-
2026-05-21status Pending
-
2026-05-14price $409,000
-
2026-03-26price $419,000
-
2026-03-12price $424,000
-
2026-02-12$439,000 Active
ⓘ Source: listings_history table (triggers on properties + properties_extension) + one-shot
backfill from property_details.listing_events for pre-trigger history.
Tax reassessment forecast AZ · Resets to sale price
- Current annual tax
- $3,358 · $280/mo
- Projected year-2 tax
- $3,358 · $280/mo
- Expected delta
- $0/yr ($0/mo · 0.0%)
ⓘ Screening estimate from a state-policy table — verify with the county assessor before closing.
Climate risk First Street
- Flood 1/10 Low FEMA zone X (unshaded) · 0% chance over 30 yrs
- Wildfire 6/10 Major
- Heat 9/10 Extreme 7 d/yr ≥111°F today · 19 d/yr by 30 yrs out
- Wind 1/10 Low
- Air quality 2/10 Low 2 unhealthy d/yr today · 2 by 30 yrs out
Nearby sold comps map
Loading sold comps map…
Walkable amenities ~0.75 mi
Loading nearby amenities…
Taxation est. · year 1
- Rental income
- $42,323
- − Mortgage interest
- −$22,910
- − Property taxes
- −$3,358
- − Insurance
- −$2,045
- − Repairs & maintenance
- −$3,386
- − Management
- −$3,386
- − HOA
- −$1,200
- − Depreciation
- −$11,898
- Taxable loss
- −$5,861
- Est. tax savings @ 24.0%
- +$1,407
- After-tax cash flow
- $2,500/yr
For passive investors: Depreciation is non-cash, so a rental often shows a tax loss while cash-flowing — sheltering income. Rental losses are passive: they offset passive income freely, and up to $25,000/yr can offset ordinary (W-2) income if you actively participate and your MAGI is under $100k (phasing out to $0 by $150k); unused losses carry forward. On sale, claimed depreciation is recaptured at up to 25%, and gains may owe capital-gains tax (a 1031 exchange can defer both). Figures are a year-1 estimate at your 24.0% rate — not tax advice; consult a CPA.
Schools (NCES district)
- District
- Apache Junction Unified District (4443)
- NCES district ID
- 0400790
- Math proficiency
- 15% ▼ -17.00%
- Reading proficiency
- 20% ▼ -13.00%
- Median HH income
- $44,930
- Composite
- 15.34/100
- National rank
- #9325
- State rank
- #195 of 249 in AZ
Livability — Gold Canyon
- Score
- 57/100
- State rank
- #225
- US rank
- #21732
Category grades
Schools grade is shown separately in the Schools card above.
Census & demographics
- Census place
- Gold Canyon, AZ
- County
- Pinal County · 399,947 people
- City population
- 14,932
- Metro
- Phoenix-Mesa-Chandler, AZ
- Population (ZIP)
- 14,932
- Household income
- $86,393
- Rent vs Own
- Severe rent burden
- 160.0
Population outlook (Pinal County) Hauer SSP2
- Today (2025)
- 437,574 people
- By 2030
- 446,903 · +2.1%
- By 2040
- 452,589 · +3.4%
- By 2050
- 444,126 · +1.5%
- By 2075
- 430,300 · -1.7%
- By 2100
- 393,536 · -10.1%
Race, ethnicity, and origin ACS 2023
- Neighborhood character
- Predominantly White (86%)
- Race & ethnicity
- White 86% Hispanic / Latino 8% Two or more races 6%
- Hispanic origin (detail)
- Mexican 7%
- Common ancestry
- Portuguese 7% Romanian 4% Slovak 4%
- Foreign-born
- 5% · Canada
- Languages at home
- 96% English-only · Spanish 3%
Political lean MEDSL · Pinal
- 2024 margin
- Strong R (+22.1) · D 38.5% · R 60.6%
- 2008→2024 swing
- -7.6pp toward R · 2008: -14.5pp · 2024: -22.1pp
- All cycles
- 2024: R+22.1 2020: R+17.3 2016: R+19.3 2012: R+17.1 2008: R+14.5
Not yet ingested
- Civics
- —
Market trends
- HPI YoY
- ▼ -122.27%
- Current HPI
- 255.6958
- Rent YoY
- —
- Metro
- Phoenix-Mesa-Chandler, AZ
- State GDP YoY
- ▲ 4.54%
- F500 in state
- 20
Industry mix (Fortune 500 HQ in AZ)
| Industry | F500 HQs | Revenue |
|---|---|---|
| Technology | 2 | $13B |
|
||
| Mining / Metals | 1 | $23B |
|
||
| Environmental Services | 1 | $16B |
|
||
| Metals / Steel | 1 | $14B |
|
||
| Technology Distribution | 1 | $9B |
|
||
| Homebuilding | 1 | $8B |
|
||
Price history
-6.8% since first listed5 events — show timeline
- 2026-05-21 Pending — ARMLS
- 2026-05-14 Price Changed $409,000 ARMLS
- 2026-03-26 Price Changed $419,000 ARMLS
- 2026-03-12 Price Changed $424,000 ARMLS
- 2026-02-12 Listed $439,000 ARMLS
Property tax history
+42.9%/yrLatest (2025): $3,358 · +4.0% YoY. Source: county tax records.
Cash-flow waterfall
monthlySold comps — $/sqft
last 12 mo · ≤1 miLoading sold comps…