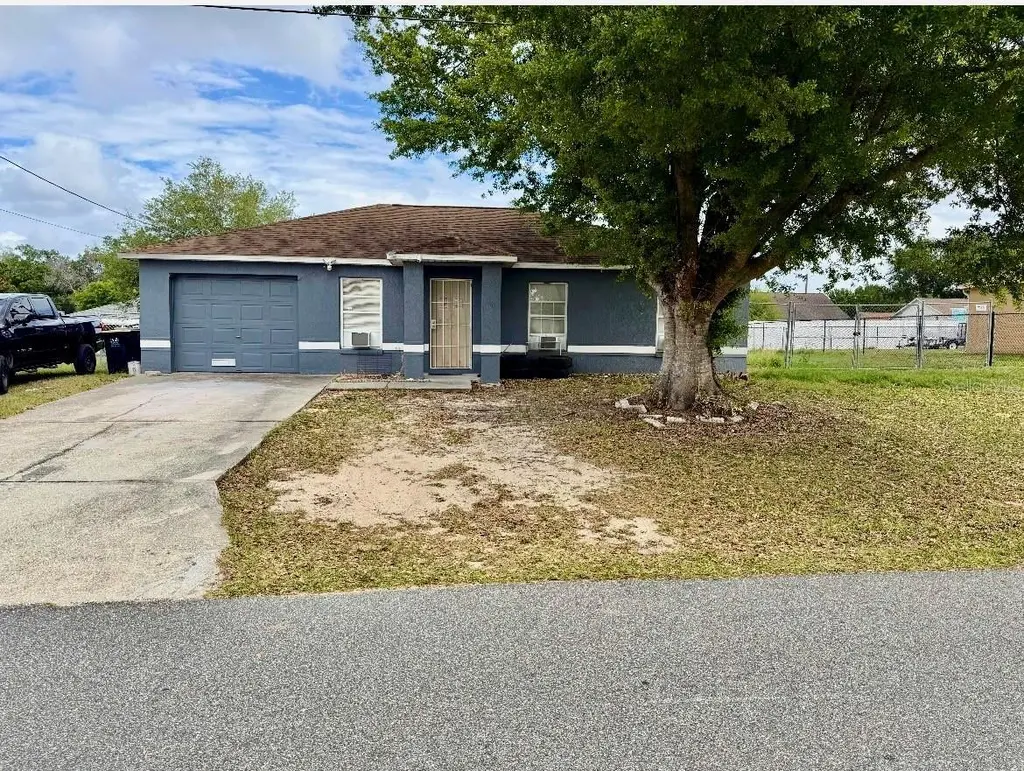
207 Lily Pad Rd · Eagle Lake, FL
Flood risk 1/10 · Minimal
- FEMA flood zone
- X (unshaded)
- Chance of flooding over 30 yrs
- 0.0%
- Est. flood insurance / yr
- $507 – $1,088
Fire risk 5/10 · Moderate
- Est. fire insurance / yr
- $947 – $1,759
Heat risk 8/10 · Major
- Hot days now (above 107°F)
- 7 days/yr
- Hot days in 30 yrs
- 24 days/yr
Wind risk 10/10 · Severe
- Chance of severe wind over 30 yrs
- 99.0%
Air-quality risk 2/10 · Minimal
- Unhealthy air days now
- 2 days/yr
- Unhealthy air days in 30 yrs
- 2 days/yr
Risk factors via First Street. Map © Google.
Why this score? — see what drove the C grade
The composite is a weighted blend of 9 inputs, each scored 0–100. Each bar is that input's sub-score; the figure is the points it added to the 100-point composite (weight × sub-score).
- Cash flow +21.3/30.0
- ARV discount +7.5/15.0
- DSCR +6.8/10.0
- Appreciation +5.9/10.0
- 1% rule +4.6/10.0
- Livability +3.9/5.0
- Schools +3.5/10.0
- Rent growth +2.5/5.0
- Condition / age +2.5/5.0
$188,499
🖨 Deal sheet 📄 Offer letter ✓ Due diligence
Listing remarks
Under contract-accepting backup offers. Back on the Market! Buyer failed to make escrow. CENTRAL AC! NO HOA!!! ONE OWNER! Tucked away in Eagle Lake, 207 Lily Pad Rd feels like the kind of home where life can be enjoyed at a simpler pace. From the moment you arrive, there is a sense of comfort and ease. A place where you can settle in, relax, and make yourself at home. Inside, the home offers 3 bedrooms, 2 full bathrooms, and 1,155 heated square feet of well-used space designed for everyday living. The living and dining areas feel welcoming and practical. The layout flows comfortably, making it easy to imagine quiet evenings at home, weekend meals with family, or simply enjoying your own s
Key facts
- Chain-link fence
- Huge backyard
- No hoa
Tags
Property features AI
Finance
- Other: No additional equipment; No lease restrictions
- HOA & community: No association fees
Exterior
- Parking: Attached garage (1 car)
- Utilities: Public water; Septic sewer; Cable connected; Electricity connected; Natural gas connected; Water connected
- Home design: Single family residence; Residential property; One story; Faces south; Homesteaded
- Construction: Stucco exterior; Shingle roof; Slab foundation; Built area about 1423 square feet
- Exterior features: Covered rear porch; Chain link fence; Paved lot; Mature landscaping; Asphalt road access
Interior
- Kitchen: Range; Range hood
- Bedrooms: 3 bedrooms
- Flooring: Laminate flooring; Vinyl flooring
- Bathrooms: 2 full bathrooms
- Heating & cooling: Central heating; Central air conditioning
- Interior features: Ceiling fans; Eat-in kitchen; Thermostat
- Laundry & utility: Laundry closet
Neighborhood map
What this means for you Summary
Snapshot
- This is a 3-bed/2.0-bath single-family listed at $188k.
Deal economics
- At list price, monthly cash flow is $277 ($3k/yr) — positive.
- The deal already cash-flows at list — no discount required.
- To meet the 1% rule (rent ≥ 1% of price), the offer needs to be $180k (4.5% below list).
- Recommended offer: $180k (4.5% below list) — sets the bar for 1% rule.
Location & tenants
- Location reads 77/100 on livability (#196 in FL, #3,096 nationally) — a middle-class / working-renter tenant base. Strengths: crime A+, cost of living A+, housing A+; Watch: schools D+, amenities F, commute F.
- Polk (suburban): math 39% / reading 43% proficiency, ranked #62 of 73 in FL (top 85%) — families likely to look elsewhere, expect single-tenant / working-renter base with shorter leases.
- Market conditions: 167 active listings in the ZIP; 6 comparable units currently listed for rent nearby; rentals at typical pace (median 21d on market — plan ~3-4 weeks tenant-placement turnaround); 10,384 units permitted in Polk County in 2024 (1,716 in 5+ unit buildings).
Forward outlook
- In year one you build about $5k of equity ($1k loan paydown + $3k appreciation (1.8% local appreciation)).
- Polk County population projected at +33% by 2050 — long-run rental-demand tailwind backs the buy-and-hold thesis.
- At projected returns (1.8% appreciation + 3.0% rent growth), your $53k cash investment doubles in ~6 years — after that, you're playing with house money.
- By year 8, paydown + projected appreciation supports a ~$35k cash-out refi (75% LTV) — recoverable capital for the next deal without selling this one.
Negotiation context
- It's been on market 46 days — a 3% lower offer ($183k) is reasonable based on typical stale-listing flexibility.
- Current owner paid $10k; list at $188k implies a 1695% gain — meaningful room to come down on a strong offer.
Risks & watch-outs
- Climate carrying-cost: severe wind risk, 99% chance of damaging wind over 30y; moderate wildfire risk; extreme-heat days projected 7→24/yr by 2055 (HVAC capex compounding) — expect insurance premiums to compound above CPI over the hold.
Questions for the listing agent
- It's been on market 46 days. Have you received any prior offers? Is the seller open to a 4% concession, seller financing, or rate buy-down credit?
- Is there a deadline driving the sale (1031 exchange, divorce, estate, relocation)? That informs how much negotiation room exists.
- Schools are D-rated, which usually means shorter tenancies and higher turnover. Who's the typical renter profile here, and what's been the actual vacancy rate?
- What's the average days-on-market for RENTAL listings here right now (not sales)? A rising rental-DOM trend means longer vacancies and softer asking-rent achievability than the comps imply.
- What's the recent tenant-quality profile in this submarket — average credit score on applications, eviction rate, late-payment / NSF rate, and stable-employment percentage? A property-management company in the area should have these aggregated.
- How much new for-sale + rental construction is in the pipeline within 1–3 miles? Heavy new supply typically softens prices + rents 12–24 months out; constrained supply supports both.
Investment metrics
- 1% rule
- 0.96% ✗
- Cap rate
- 8.06%
- Cash-on-cash
- 6.30%
- DSCR
- 1.28
- GRM
- 8.7
CMA / ARV
No comps found within radius.
Projected returns pro-forma
1.75% appreciation · 3.0% rent growth · sell at horizon
- IRR
- 10.0%
- Equity multiple
- 1.53×
- Total profit
- $28,083
- Equity at exit
- $71,786
- IRR
- 13.2%
- Equity multiple
- 2.73×
- Total profit
- $91,161
- Equity at exit
- $101,439
Cash invested: $52,780 (down + closing). Projections, not guarantees.
Landlord ↔ Tenant lean methodology
- Overall (STATE)
- 87 Strongly Landlord-Friendly
- State Florida
- 87 Strongly Landlord-Friendly · R+3
- County
- — inherits STATE
- City
- — inherits STATE
ZIP-level market 33839
- Home prices YoY
- 0.6%
- Active inventory
- 167
- Price-to-rent
- 8.7×
Monthly cashflow live
- Estimated rent
- $1,800 high interval (Pro) →
- Mortgage (P&I)
- −$989
- Tax from tax record
- −$78 /mo · $938/yr
- Insurance
- −$79
- HOA
- −$0
- Vacancy / Maint / Mgmt
- −$378
- Net cashflow
- $277
Break-even live
UW: 25.0% down · 7.5% · 30yr · 1.5% tax · 5.0% vac · 8.0% maint · 8.0% mgmt
Financing live
Cash to close
- Down payment
- $47,125
- Closing costs
- $5,655
- Reserves months
- —
- Total cash needed
- —
Loan-product check · same deal, 3 products live
Conventional
25% down · 7.5% · 30yr
- Down + closing
- —
- Monthly P&I
- —
- Monthly cashflow
- —
- DSCR
- —
- Eligible?
- —
Personal DTI + credit; lowest rate.
DSCR
20% down · 8.5% · 30yr
- Down + closing
- —
- Monthly P&I
- —
- Monthly cashflow
- —
- DSCR
- —
- Eligible?
- —
No personal income docs; deal must DSCR.
Hard money
10% down · 12.0% · 12mo
- Down + closing
- —
- Monthly P&I
- —
- Monthly cashflow
- —
- DSCR
- —
- Eligible?
- —
Short-term bridge; refi at stabilization.
Rent comps 6 comps
| Address | Beds | Baths | Sqft | Rent | $/sqft | DOM | Units | Dist |
|---|---|---|---|---|---|---|---|---|
| 418 Reina Way Bartow, FL | 3.0 | 2.0 | 1350 | $1,666 | $1.23 | 21d | 1 | 0.66mi |
| 588 Crown Rose Dr Bartow, FL | 3.0 | 2.0 | 1350 | $1,646 | $1.22 | 13d | 1 | 0.68mi |
| 303 Corbel Ln Bartow, FL | 3.0 | 2.0 | 1350 | $1,731 | $1.28 | 3d | 1 | 0.68mi |
| 1469 Deepwater Cir Eagle Lake, FL | 3.0 | 2.0 | 1461 | $2,000 | $1.37 | 23d | 1 | 0.72mi |
| 2782 Pioneer Trl Eagle Lake, FL | 3.0 | 2.0 | 1486 | $1,940 | $1.31 | 23d | 1 | 0.78mi |
| 1204 Deepwater Cir Eagle Lake, FL | 3.0 | 2.0 | 1444 | $1,900 | $1.32 | 14d | 1 | 0.83mi |
Listing history 12 events
-
2026-06-13days on market $188,499 Pending 46 DOM
-
2026-06-07statusdays on market $188,499 Pending 45 DOM
-
2026-06-05days on market $188,499 Active 44 DOM
-
2026-06-03days on market $188,499 Active 43 DOM
-
2026-06-03days on market $188,499 Active 42 DOM
-
2026-06-01days on market $188,499 Active 41 DOM
-
2026-06-01price $188,499 Active 40 DOM
-
2026-05-31statusdays on market $198,499 Active 40 DOM
-
2026-05-12price $198,499
-
2026-04-24price $199,999
-
2026-04-14$210,000 Active
-
1999-03-18soldstatus $10,500
ⓘ Source: listings_history table (triggers on properties + properties_extension) + one-shot
backfill from property_details.listing_events for pre-trigger history.
Tax reassessment forecast FL · Resets to sale price
- Current annual tax
- $938 · $78/mo
- Projected year-2 tax
- $1,565 · $130/mo
- Expected delta
- +$626/yr (+$52/mo · 66.7%)
ⓘ Screening estimate from a state-policy table — verify with the county assessor before closing.
Climate risk First Street
- Flood 1/10 Low FEMA zone X (unshaded) · 0% chance over 30 yrs
- Wildfire 5/10 Major
- Heat 8/10 Severe 7 d/yr ≥107°F today · 24 d/yr by 30 yrs out
- Wind 10/10 Extreme 99% chance of damaging wind over 30 yrs
- Air quality 2/10 Low 2 unhealthy d/yr today · 2 by 30 yrs out
Nearby sold comps map
Loading sold comps map…
Walkable amenities ~0.75 mi
Loading nearby amenities…
Taxation est. · year 1
- Rental income
- $21,603
- − Mortgage interest
- −$10,559
- − Property taxes
- −$938
- − Insurance
- −$942
- − Repairs & maintenance
- −$1,728
- − Management
- −$1,728
- − Depreciation
- −$5,484
- Taxable income
- $223
- Est. tax owed @ 24.0%
- −$53
- After-tax cash flow
- $3,270/yr
For passive investors: Depreciation is non-cash, so a rental often shows a tax loss while cash-flowing — sheltering income. Rental losses are passive: they offset passive income freely, and up to $25,000/yr can offset ordinary (W-2) income if you actively participate and your MAGI is under $100k (phasing out to $0 by $150k); unused losses carry forward. On sale, claimed depreciation is recaptured at up to 25%, and gains may owe capital-gains tax (a 1031 exchange can defer both). Figures are a year-1 estimate at your 24.0% rate — not tax advice; consult a CPA.
Schools (NCES district)
- District
- Polk
- NCES district ID
- 1201590
- Math proficiency
- 39% ▼ -11.00%
- Reading proficiency
- 43% ▼ -4.00%
- Median HH income
- $43,979
- Composite
- 34.74/100
- National rank
- #5132
- State rank
- #62 of 73 in FL
Livability — Eagle Lake
- Score
- 77/100
- State rank
- #196
- US rank
- #3096
Category grades
Schools grade is shown separately in the Schools card above.
Census & demographics
- City population
- 4,397
- Population (ZIP)
- 4,397
Population outlook (Polk County) Hauer SSP2
- Today (2025)
- 752,975 people
- By 2030
- 804,621 · +6.9%
- By 2040
- 906,117 · +20.3%
- By 2050
- 1,000,476 · +32.9%
- By 2075
- 1,197,520 · +59.0%
- By 2100
- 1,271,518 · +68.9%
Race, ethnicity, and origin ACS 2023
- Neighborhood character
- Diverse neighborhood (Simpson 0.57)
- Race & ethnicity
- White 57% Hispanic / Latino 32% Two or more races 8% Black 8%
- Hispanic origin (detail)
- Mexican 6% Puerto Rican 23% Cuban 1%
- Common ancestry
- Lithuanian 1% Romanian 1% Italian 1%
- Foreign-born
- 4% · Canada, Vietnam
- Languages at home
- 84% English-only · Spanish 13% Russian/Polish/Slavic 1% French/Haitian/Cajun 1%
Political lean MEDSL · Polk
- 2024 margin
- Strong R (+20.7) · D 39.2% · R 59.9%
- 2008→2024 swing
- -14.6pp toward R · 2008: -6.1pp · 2024: -20.7pp
- All cycles
- 2024: R+20.7 2020: R+14.4 2016: R+14.1 2012: R+6.8 2008: R+6.1
Not yet ingested
- Civics
- —
Market trends
- HPI YoY
- ▲ 1.75%
- Current HPI
- 317.0642
- Rent YoY
- —
- Metro
- —
- State GDP YoY
- ▲ 3.28%
- F500 in state
- 36
Industry mix (Fortune 500 HQ in FL)
| Industry | F500 HQs | Revenue |
|---|---|---|
| Industrial Technology | 2 | $29B |
|
||
| Insurance | 2 | $17B |
|
||
| Retail | 1 | $60B |
|
||
| Technology Distribution | 1 | $58B |
|
||
| Homebuilding | 1 | $35B |
|
||
| Technology Manufacturing | 1 | $35B |
|
||
Price history
+1790.5% since first listed4 events — show timeline
- 2026-05-12 Price Changed $198,499 Stellar MLS as Distributed by MLS Grid
- 2026-04-24 Price Changed $199,999 Stellar MLS as Distributed by MLS Grid
- 2026-04-14 Listed $210,000 Stellar MLS as Distributed by MLS Grid
- 1999-03-18 Sold (Public Records) $10,500 Public Records
Property tax history
+19.3%/yrLatest (2025): $938 · +16.9% YoY. Source: county tax records.
Cash-flow waterfall
monthlySold comps — $/sqft
last 12 mo · ≤1 miLoading sold comps…