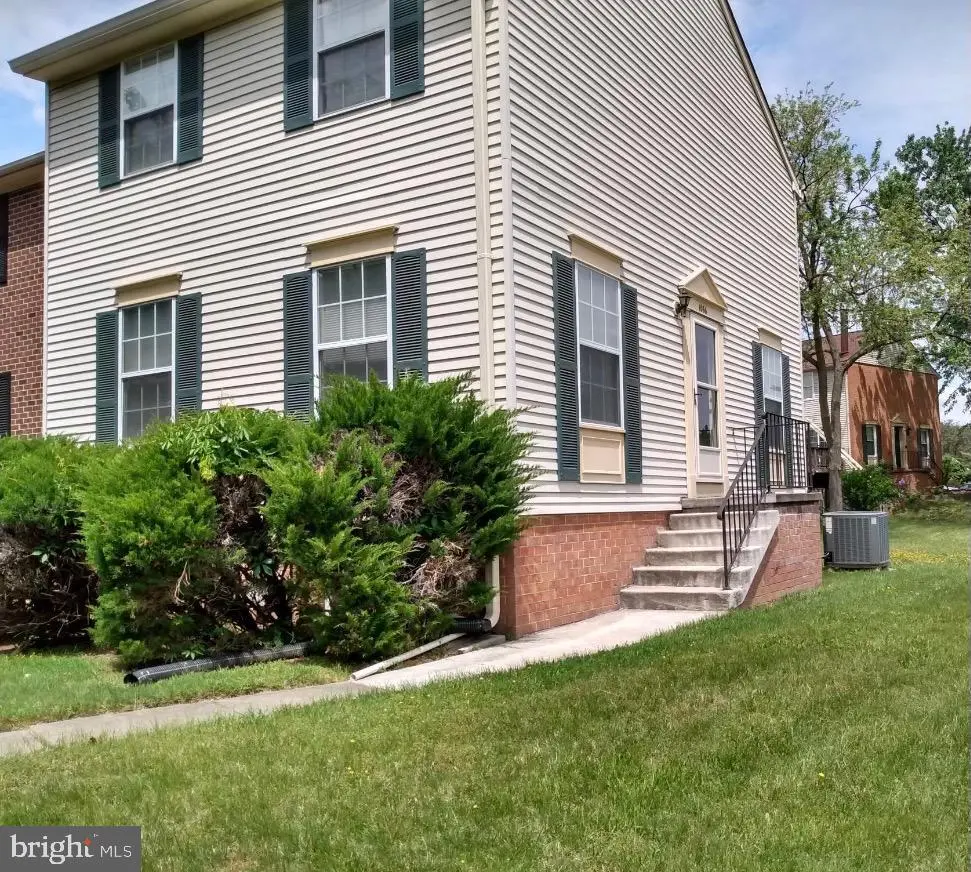
1066 Saybrook Harbour · Riviera Beach, MD
Flood risk 1/10 · Minimal
- FEMA flood zone
- X (unshaded)
- Chance of flooding over 30 yrs
- 0.0%
- Est. flood insurance / yr
- $473 – $860
Fire risk 1/10 · Minimal
- Est. fire insurance / yr
- $755 – $1,403
Heat risk 8/10 · Major
- Hot days now (above 103°F)
- 7 days/yr
- Hot days in 30 yrs
- 15 days/yr
Wind risk 6/10 · Moderate
- Chance of severe wind over 30 yrs
- 60.0%
Air-quality risk 5/10 · Moderate
- Unhealthy air days now
- 6 days/yr
- Unhealthy air days in 30 yrs
- 8 days/yr
Risk factors via First Street. Map © Google.
Why this score? — see what drove the D grade
The composite is a weighted blend of 9 inputs, each scored 0–100. Each bar is that input's sub-score; the figure is the points it added to the 100-point composite (weight × sub-score).
- Cash flow +13.3/30.0
- ARV discount +10.7/15.0
- DSCR +4.0/10.0
- 1% rule +3.6/10.0
- Livability +3.2/5.0
- Schools +2.9/10.0
- Rent growth +2.7/5.0
- Condition / age +2.5/5.0
- Appreciation +0.0/10.0
$330,000
🖨 Deal sheet 📄 Offer letter ✓ Due diligence
Listing remarks
* * Move-In Ready End Unit Townhome in Desirable Waterfront Community! * * * * Priced to sell FAST!! * * * * NEW CARPET JUST INSTALLED TODAY!! 6/12/26 (Photos do not show the new carpet) * * Welcome home to this beautifully maintained 3-level end-unit townhome situated on one of the largest lots in the community! Proudly owned by the original owner since new, this property offers comfort, convenience, and access to fantastic waterfront amenities. This spacious home features 3 bedrooms and 1 full bathroom on the upper level, along with a partially finished basement complete with a remodeled half bathroom. Both bathrooms have been tastefully updated, and the home has been freshly p
Key facts
- $195 HOA
- Built 1984
- Listed 6 days
Property features AI
Finance
- Other: Total below-grade area 280 (assessor); Above-grade finished area 1,120 (assessor)
- HOA & community: HOA fee of $195 per month
Exterior
- Parking: Parking lot
- Utilities: Public water; Public sewer; Electric cooling fuel; Hot water: Other
- Home design: End of row townhouse; Fee simple ownership
- Construction: Frame, brick and vinyl siding construction; Block foundation; Above-grade and below-grade structures; Estimated year built
- Exterior features: Sidewalks; Water-oriented property on a creek
Interior
- Bedrooms: Three bedrooms on the upper level
- Bathrooms: One full bathroom; One half bathroom
- Heating & cooling: Heat pump(s); Central air conditioning (electric)
- Interior features: Partially finished basement; Assessor as source for living area
Neighborhood map
What this means for you Summary
Snapshot
- This is a 3-bed/1.5-bath townhouse listed at $330k.
Deal economics
- At list price, monthly cash flow is $3 ($31/yr) — positive.
- The deal already cash-flows at list — no discount required.
- To meet the 1% rule (rent ≥ 1% of price), the offer needs to be $285k (13.6% below list).
- Recommended offer: $285k (13.6% below list) — sets the bar for 1% rule.
Location & tenants
- Location reads 64/100 on livability (#280 in MD) — a middle-class / working-renter tenant base. Strengths: employment A+, housing A+; Watch: crime D, cost of living D, schools D-.
- Anne Arundel County Public Schools (suburban): math 20% / reading 37% proficiency, ranked #10 of 24 in MD (top 42%) — low school quality limits family demand, transient renter base, plan for 1-2y turnover.
- Market conditions: Rents flat; 254 active listings in the ZIP; 15 comparable units currently listed for rent nearby; rentals at typical pace (median 15d on market — plan ~3-4 weeks tenant-placement turnaround); high-income renter base; 1,303 units permitted in Anne Arundel County in 2024 (299 in 5+ unit buildings).
Forward outlook
- Local home prices are declining (-3.0%/yr); year-one equity from $2k of loan paydown is wiped out by about $10k of value loss. Plan a longer hold.
- Anne Arundel County population projected at +17% by 2050 — long-run rental-demand tailwind backs the buy-and-hold thesis.
Negotiation context
- Only 6 days on market — expect competitive offers; lowballing is unlikely to land.
- Current owner paid $66k; list at $330k implies a 403% gain — meaningful room to come down on a strong offer.
Risks & watch-outs
- Climate carrying-cost: major wind risk, 60% chance of damaging wind over 30y; extreme-heat days projected 7→15/yr by 2055 (HVAC capex compounding) — expect insurance premiums to compound above CPI over the hold.
Questions for the listing agent
- What does the HOA fee cover, when was the last increase, and are there any pending special assessments or reserve-fund shortfalls?
- Is there a deadline driving the sale (1031 exchange, divorce, estate, relocation)? That informs how much negotiation room exists.
- Schools are D-rated, which usually means shorter tenancies and higher turnover. Who's the typical renter profile here, and what's been the actual vacancy rate?
- Crime grade is D in this area — have there been break-ins, vandalism, or insurance claims at this property in the last 3 years? What carrier currently insures it and at what premium?
- The area grade is low — what's the realistic commute time and amenity access for the typical tenant pool here? Any planned neighborhood developments (good or bad) we should know about?
- What's the average days-on-market for RENTAL listings here right now (not sales)? A rising rental-DOM trend means longer vacancies and softer asking-rent achievability than the comps imply.
- What's the recent tenant-quality profile in this submarket — average credit score on applications, eviction rate, late-payment / NSF rate, and stable-employment percentage? A property-management company in the area should have these aggregated.
- How much new for-sale + rental construction is in the pipeline within 1–3 miles? Heavy new supply typically softens prices + rents 12–24 months out; constrained supply supports both.
Investment metrics
- 1% rule
- 0.86% ✗
- Cap rate
- 6.30%
- Cash-on-cash
- 0.03%
- DSCR
- 1.00
- GRM
- 9.6
CMA / ARV
- ARV (on-the-fly)
- $355,600
- Comps found
- 12
Show comp detail 12 sales within ~0.75 mi
| Address | Dist | Beds/Ba | Sqft | Sold | Price | $/sf | Match |
|---|---|---|---|---|---|---|---|
| 1056 Saybrook Harbour | 0.01mi | 3/1.5 | 1,400 (0%) | 2mo | $365,000 | $261 | 98 |
| 961 Mount Desert Harbour | 0.09mi | 3/1.5 | 1,400 (0%) | 0mo | $359,000 | $256 | 95 |
| 925 Mount Desert Harbour | 0.14mi | 3/1.5 | 1,400 (0%) | 1mo | $350,000 | $250 | 93 |
| 912 Hingham Harbour | 0.19mi | 3/1.5 | 1,400 (0%) | 0mo | $355 | — | 91 |
| 1027 Cutler Harbour | 0.12mi | 3/2.5 | 1,440 (+3%) | 1mo | $415,122 | $288 | 85 |
| 889 New London Harbour | 0.24mi | 3/1.5 | 1,400 (0%) | 4mo | $374,900 | $268 | 85 |
| 8639 Cobscook Harbour | 0.25mi | 3/1.5 | 1,400 (0%) | 6mo | $355,000 | $254 | 84 |
| 819 De Franceaux Hbr | 0.26mi | 3/2.0 | 1,400 (0%) | 6mo | $395,000 | $282 | 81 |
| 1186 Annis Squam Harbour | 0.33mi | 3/2.0 | 1,400 (0%) | 3mo | $340,000 | $243 | 81 |
| 8649 Cobscook Harbour | 0.27mi | 4/2.0 (+1) | 1,400 (0%) | 1mo | $355,000 | $254 | 79 |
| 1040 Cape Splitt Harbour | 0.20mi | 3/1.5 | 1,524 (+9%) | 4mo | $345,000 | $226 | 73 |
| 1185 Annis Squam Harbour | 0.30mi | 3/1.5 | 1,509 (+8%) | 7mo | $365,000 | $242 | 67 |
Match score weights: distance 35% · size 25% · config 20% · recency 20%. Top-matched comps best support the ARV.
Projected returns pro-forma
-3.0% appreciation · 0.76% rent growth · sell at horizon
- IRR
- -18.8%
- Equity multiple
- 0.36×
- Total profit
- $-59,574
- Equity at exit
- $49,204
- IRR
- -16.4%
- Equity multiple
- 0.17×
- Total profit
- $-76,231
- Equity at exit
- $28,532
Cash invested: $92,400 (down + closing). Projections, not guarantees.
Landlord ↔ Tenant lean methodology
- Overall (STATE)
- 27 Tenant-Leaning
- State Maryland
- 27 Tenant-Leaning · D+14
- County
- — inherits STATE
- City
- — inherits STATE
ZIP-level market 21122
- Rents YoY
- 0.8%
- Active inventory
- 254
- Price-to-rent
- 9.6×
Monthly cashflow live
- Estimated rent
- $2,852 high interval (Pro) →
- Mortgage (P&I)
- −$1,731
- Tax from tax record
- −$187 /mo · $2,246/yr
- Insurance
- −$138
- HOA
- −$195
- Vacancy / Maint / Mgmt
- −$599
- Net cashflow
- $3
Break-even live
UW: 25.0% down · 7.5% · 30yr · 1.5% tax · 5.0% vac · 8.0% maint · 8.0% mgmt
Financing live
Cash to close
- Down payment
- $82,500
- Closing costs
- $9,900
- Reserves months
- —
- Total cash needed
- —
Loan-product check · same deal, 3 products live
Conventional
25% down · 7.5% · 30yr
- Down + closing
- —
- Monthly P&I
- —
- Monthly cashflow
- —
- DSCR
- —
- Eligible?
- —
Personal DTI + credit; lowest rate.
DSCR
20% down · 8.5% · 30yr
- Down + closing
- —
- Monthly P&I
- —
- Monthly cashflow
- —
- DSCR
- —
- Eligible?
- —
No personal income docs; deal must DSCR.
Hard money
10% down · 12.0% · 12mo
- Down + closing
- —
- Monthly P&I
- —
- Monthly cashflow
- —
- DSCR
- —
- Eligible?
- —
Short-term bridge; refi at stabilization.
Rent comps 15 comps
| Address | Beds | Baths | Sqft | Rent | $/sqft | DOM | Units | Dist |
|---|---|---|---|---|---|---|---|---|
| 959 Mount Desert Harbour Pasadena, MD | 3.0 | 1.5 | 1400 | $2,600 | $1.86 | 24d | 1 | 0.10mi |
| 8561 Skipjack Pl Pasadena, MD | 3.0 | 2.5 | 1670 | $2,900 | $1.74 | 5d | 1 | 0.51mi |
| 8561 Skipjack Pl Pasadena, MD | 3.0 | 2.5 | 1670 | $2,900 | $1.74 | 3d | 1 | 0.51mi |
| 950 Nabbs Creek Rd Glen Burnie, MD | 4.0 | 3.5 | 1752 | $6,500 | $3.71 | 24d | 1 | 0.89mi |
| 932 12th St Pasadena, MD | 3.0 | 2.5 | 1100 | $2,750 | $2.50 | 44d | 1 | 1.04mi |
| 7707 Warsaw Ave Glen Burnie, MD | 3.0 | 1.0 | 924 | $2,400 | $2.60 | 11d | 1 | 1.10mi |
| 8582 Beacon Point Rd Pasadena, MD | 3.0 | 1.5 | 1159 | $2,650 | $2.29 | 2d | 1 | 1.10mi |
| 8436 Bay Dr Pasadena, MD | 4.0 | 3.0 | 1004 | $3,200 | $3.19 | 24d | 1 | 1.16mi |
| 329 Bar Harbor Rd Pasadena, MD | 2.0 | 1.0 | 1500 | $2,050 | $1.37 | 15d | 1 | 1.21mi |
| 329 Bar Harbor Rd Pasadena, MD | 2.0 | 1.0 | 1500 | $2,150 | $1.43 | 10d | 1 | 1.21mi |
| 3630 Saltwood Gln Pasadena, MD | 2.0 | 2.0 | 960 | $2,339 | $2.44 | 3d | 1 | 1.30mi |
| 1122 Hilltop Rd Orchard Beach, MD | 3.0 | 2.0 | 1041 | $2,399 | $2.30 | 24d | 1 | 1.30mi |
| 765 202nd St Pasadena, MD | 3.0 | 1.0 | 1200 | $2,300 | $1.92 | 14d | 1 | 1.32mi |
| 216 Dunlap Rd Pasadena, MD | 4.0 | 2.0 | 1110 | $3,000 | $2.70 | 44d | 1 | 1.35mi |
| 3631 Dorshire Ct Pasadena, MD | 3.0 | 2.0 | 1540 | $2,495 | $1.62 | 20d | 1 | 1.49mi |
HOA detail
- Monthly dues
- $195 · $2,340/yr
- Likely covers
- water
Listing history 17 events
-
2026-06-18days on market $330,000 Active 6 DOM
-
2026-06-17price $330,000 Active 5 DOM
-
2026-06-17days on market $350,000 Active 5 DOM
-
2026-06-16days on market $350,000 Active 4 DOM
-
2026-06-15days on market $350,000 Active 3 DOM
-
2026-06-13statusdays on market $350,000 Active 1 DOM
-
2026-06-10remarks 699-char remark
-
2026-06-09days on market $350,000 Coming Soon 18 DOM
-
2026-06-08days on market $350,000 Coming Soon 17 DOM
-
2026-06-07days on market $350,000 Coming Soon 16 DOM
-
2026-06-04days on market $350,000 Coming Soon 13 DOM
-
2026-06-03days on market $350,000 Coming Soon 12 DOM
-
2026-06-02days on market $350,000 Coming Soon 11 DOM
-
2026-06-01days on market $350,000 Coming Soon 10 DOM
-
2026-05-31days on market $350,000 Coming Soon 9 DOM
-
2026-05-22historical $350,000
-
1985-06-28soldstatus $65,640
ⓘ Source: listings_history table (triggers on properties + properties_extension) + one-shot
backfill from property_details.listing_events for pre-trigger history.
Tax reassessment forecast MD · Partial reset (capped growth)
- Current annual tax
- $2,246 · $187/mo
- Projected year-2 tax
- $2,921 · $243/mo
- Expected delta
- +$676/yr (+$56/mo · 30.1%)
ⓘ Screening estimate from a state-policy table — verify with the county assessor before closing.
Climate risk First Street
- Flood 1/10 Low FEMA zone X (unshaded) · 0% chance over 30 yrs
- Wildfire 1/10 Low
- Heat 8/10 Severe 7 d/yr ≥103°F today · 15 d/yr by 30 yrs out
- Wind 6/10 Major 60% chance of damaging wind over 30 yrs
- Air quality 5/10 Major 6 unhealthy d/yr today · 8 by 30 yrs out
Nearby sold comps map
Loading sold comps map…
Walkable amenities ~0.75 mi
Loading nearby amenities…
Taxation est. · year 1
- Rental income
- $34,219
- − Mortgage interest
- −$18,485
- − Property taxes
- −$2,246
- − Insurance
- −$1,650
- − Repairs & maintenance
- −$2,738
- − Management
- −$2,738
- − HOA
- −$2,340
- − Depreciation
- −$9,600
- Taxable loss
- −$5,577
- Est. tax savings @ 24.0%
- +$1,338
- After-tax cash flow
- $1,369/yr
For passive investors: Depreciation is non-cash, so a rental often shows a tax loss while cash-flowing — sheltering income. Rental losses are passive: they offset passive income freely, and up to $25,000/yr can offset ordinary (W-2) income if you actively participate and your MAGI is under $100k (phasing out to $0 by $150k); unused losses carry forward. On sale, claimed depreciation is recaptured at up to 25%, and gains may owe capital-gains tax (a 1031 exchange can defer both). Figures are a year-1 estimate at your 24.0% rate — not tax advice; consult a CPA.
Schools (NCES district)
- District
- Anne Arundel County Public Schools
- NCES district ID
- 2400060
- Math proficiency
- 20% ▼ -21.00%
- Reading proficiency
- 37% ▼ -13.00%
- Median HH income
- $87,880
- Composite
- 28.52/100
- National rank
- #6733
- State rank
- #10 of 24 in MD
Livability — Riviera Beach
- Score
- 64/100
- State rank
- #280
- US rank
- #14429
Category grades
Schools grade is shown separately in the Schools card above.
Census & demographics
- Census place
- Riviera Beach, MD
- County
- Anne Arundel County · 535,653 people
- Metro
- Baltimore-Columbia-Towson, MD
- Population (ZIP)
- 61,566
- Household income
- $127,587
- Rent vs Own
- Severe rent burden
- 791.0
Population outlook (Anne Arundel County) Hauer SSP2
- Today (2025)
- 617,384 people
- By 2030
- 642,094 · +4.0%
- By 2040
- 686,621 · +11.2%
- By 2050
- 723,031 · +17.1%
- By 2075
- 809,346 · +31.1%
- By 2100
- 837,658 · +35.7%
Race, ethnicity, and origin ACS 2023
- Neighborhood character
- Predominantly White (80%)
- Race & ethnicity
- White 80% Two or more races 7% Black 7% Hispanic / Latino 5% Asian 2%
- Common ancestry
- Romanian 4% Lithuanian 2% Slovak 2%
- Foreign-born
- 4% · Canada, China
- Languages at home
- 93% English-only · Spanish 3% Other Indo-European 1% Chinese 0%
Political lean MEDSL · Anne Arundel
- 2024 margin
- D (+13.9) · D 55.7% · R 41.7% · Other 2.6%
- 2008→2024 swing
- +15.7pp toward D · 2008: -1.8pp · 2024: 13.9pp
- All cycles
- 2024: D+13.9 2020: D+14.5 2016: D+0.7 2012: R+0.9 2008: R+1.8
Not yet ingested
- Civics
- —
Market trends
- HPI YoY
- ▼ -401.00%
- Current HPI
- 283.1566
- Rent YoY
- ▲ 0.76%
- Metro
- Baltimore-Columbia-Towson, MD
- State GDP YoY
- ▲ 2.97%
- F500 in state
- 12
Industry mix (Fortune 500 HQ in MD)
| Industry | F500 HQs | Revenue |
|---|---|---|
| Aerospace / Defense | 1 | $71B |
|
||
| Utilities | 1 | $25B |
|
||
| Hotels | 1 | $24B |
|
||
| Consumer Goods | 1 | $7B |
|
||
| Real Estate | 1 | $6B |
|
||
| Chemicals | 1 | $2B |
|
||
Price history
+433.2% since first listed2 events — show timeline
- 2026-05-22 Coming Soon $350,000 BRIGHT MLS
- 1985-06-28 Sold (Public Records) $65,640 Public Records
Property tax history
+4.3%/yrLatest (2025): $2,246 · +2.6% YoY. Source: county tax records.
Cash-flow waterfall
monthlySold comps — $/sqft
last 12 mo · ≤1 miLoading sold comps…