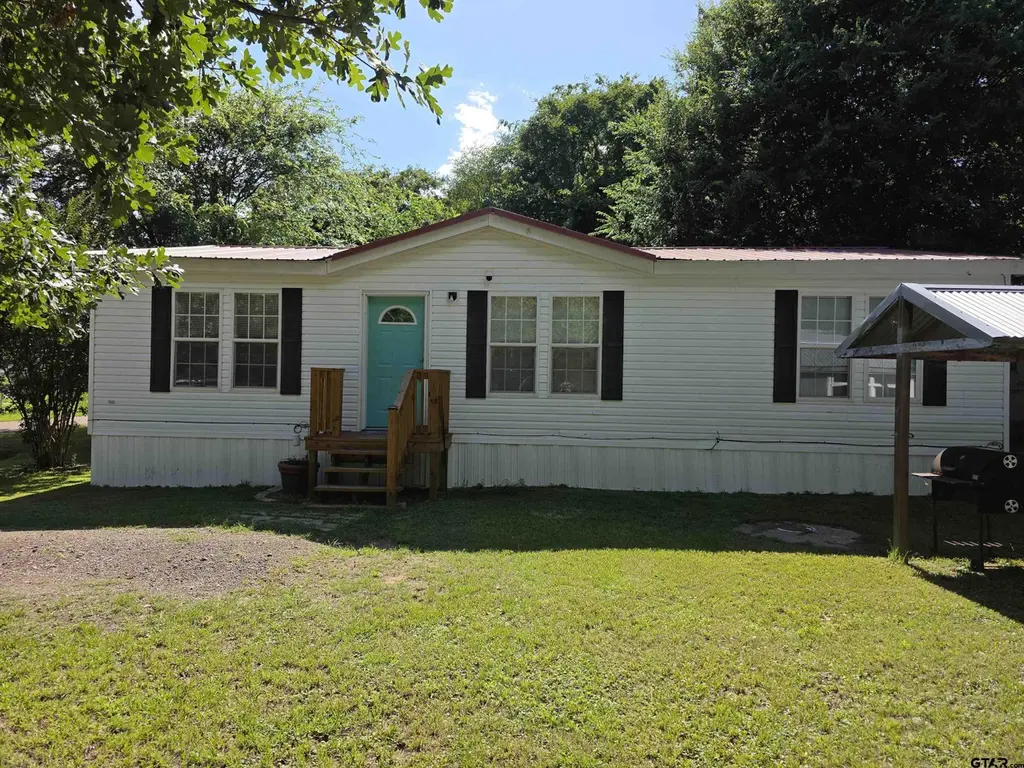
21587 Ravenwood Dr · Chandler, TX
Flood risk No data
- FEMA flood zone
- —
- Chance of flooding over 30 yrs
- —
- Est. flood insurance / yr
- —
Fire risk No data
- Est. fire insurance / yr
- —
Heat risk No data
- Hot days now (above threshold)
- —
- Hot days in 30 yrs
- —
Wind risk No data
- Chance of severe wind over 30 yrs
- —
Air-quality risk No data
- Unhealthy air days now
- —
- Unhealthy air days in 30 yrs
- —
Risk factors via First Street. Map © Google.
Why this score? — see what drove the C grade
The composite is a weighted blend of 9 inputs, each scored 0–100. Each bar is that input's sub-score; the figure is the points it added to the 100-point composite (weight × sub-score).
- Cash flow +19.5/30.0
- ARV discount +15.0/15.0
- DSCR +6.2/10.0
- 1% rule +4.6/10.0
- Schools +3.7/10.0
- Livability +3.5/5.0
- Rent growth +2.5/5.0
- Condition / age +2.5/5.0
- Appreciation +0.0/10.0
$135,000
🖨 Deal sheet 📄 Offer letter ✓ Due diligence
Listing remarks MLS
Enjoy country living and get a breath of fresh air in this 3 bedroom home located near Lake Palestine. For utility turn-ons, approval must be granted in advance from HUD s Field Service Manager. In cases where plumbing deficiencies exist, approval for water turn-on may be denied.
Key facts
- Clubhouse
- Community pool
- Double lot
Tags
Property features AI
Finance
- HOA & community: Homeowners association with $240 annual fee (about $20/month)
Exterior
- Parking: Gravel parking
- Utilities: Underground utilities; Septic tank
- Home design: Single-story; Manufactured (mobile) home; Residential property; Lot approximately 60 x 70
- Construction: Aluminum/metal roof
- Exterior features: Front porch; Pool (community)
Interior
- Kitchen: Dishwasher; Electric oven; Electric range; Refrigerator
- Flooring: Carpet; Laminate
- Bathrooms: 2 full bathrooms
- Heating & cooling: Central heating (electric); Central air; Ceiling fan(s)
- Interior features: Walk-in closet(s)
- Laundry & utility: Electric water heater
Neighborhood map
What this means for you Summary
Snapshot
- This is a 3-bed/2.0-bath manufactured listed at $135k.
Deal economics
- At list price, monthly cash flow is $152 ($2k/yr) — positive.
- The deal already cash-flows at list — no discount required.
- To meet the 1% rule (rent ≥ 1% of price), the offer needs to be $130k (3.7% below list).
- Recommended offer: $130k (3.7% below list) — sets the bar for 1% rule.
- Cap rate 7.6% vs local median 3.8% in Chandler — top-decile yield for the area; either an underpriced asset or a hidden risk that comps aren't pricing in. Stress-test before assuming the spread holds.
Location & tenants
- Location reads 70/100 on livability (#347 in TX) — a middle-class / working-renter tenant base. Strengths: crime A+, cost of living A+, housing A+; Watch: amenities F, commute F, employment D-.
- Brownsboro ISD (rural): math 42% / reading 46% proficiency, ranked #290 of 826 in TX (top 35%) — families likely to look elsewhere, expect single-tenant / working-renter base with shorter leases.
- Zoned schools: Chandler El (math 42% / reading 37%, grade F, #1,545 of 4,322 statewide, top 38%, 450 students, 74% FRL); Brownsboro J H (math 48% / reading 49%, grade C-, #392 of 1,662 statewide, top 24%, 405 students, 60% FRL); Brownsboro H S (math 31% / reading 63%, grade D-, #591 of 1,632 statewide, top 38%, 757 students, 50% FRL).
- Market conditions: 225 active listings in the ZIP; 1 comparable units currently listed for rent nearby; 263 units permitted in Henderson County in 2024 (0 in 5+ unit buildings).
Forward outlook
- Local home prices are declining (-3.0%/yr); year-one equity from $933 of loan paydown is wiped out by about $4k of value loss. Plan a longer hold.
Negotiation context
- Only 8 days on market — expect competitive offers; lowballing is unlikely to land.
- 4 sale attempts since 13y ago with the ask held roughly flat each time — persistent listings suggest the price (not the market) is what's stuck; bring a comps-based counter.
Questions for the listing agent
- What does the HOA fee cover, when was the last increase, and are there any pending special assessments or reserve-fund shortfalls?
- Is there a deadline driving the sale (1031 exchange, divorce, estate, relocation)? That informs how much negotiation room exists.
- Schools are D-rated, which usually means shorter tenancies and higher turnover. Who's the typical renter profile here, and what's been the actual vacancy rate?
- What's the average days-on-market for RENTAL listings here right now (not sales)? A rising rental-DOM trend means longer vacancies and softer asking-rent achievability than the comps imply.
- What's the recent tenant-quality profile in this submarket — average credit score on applications, eviction rate, late-payment / NSF rate, and stable-employment percentage? A property-management company in the area should have these aggregated.
- How much new for-sale + rental construction is in the pipeline within 1–3 miles? Heavy new supply typically softens prices + rents 12–24 months out; constrained supply supports both.
Investment metrics
- 1% rule
- 0.96% ✗
- Cap rate
- 7.65%
- Cash-on-cash
- 4.83%
- DSCR
- 1.22
- GRM
- 8.7
CMA / ARV
- ARV (on-the-fly)
- $226,908
- Comps found
- 3
Show comp detail 3 sales within ~0.75 mi
| Address | Dist | Beds/Ba | Sqft | Sold | Price | $/sf | Match |
|---|---|---|---|---|---|---|---|
| 21605 Sundown Rd | 0.05mi | 3/2.0 | 1,232 (+4%) | 4mo | $70,000 | $57 | 89 |
| 1260 Shoreline Cir | 0.31mi | 3/2.0 | 1,152 (-3%) | 21mo | $295,000 | $256 | 63 |
| 955 Beachside Dr | 0.15mi | 2/1.0 (-1) | 1,310 (+10%) | 10mo | $249,900 | $191 | 59 |
Match score weights: distance 35% · size 25% · config 20% · recency 20%. Top-matched comps best support the ARV.
Projected returns pro-forma
-3.0% appreciation · 3.0% rent growth · sell at horizon
- IRR
- -8.8%
- Equity multiple
- 0.68×
- Total profit
- $-12,194
- Equity at exit
- $20,129
- IRR
- 0.7%
- Equity multiple
- 1.05×
- Total profit
- $1,803
- Equity at exit
- $11,672
Cash invested: $37,800 (down + closing). Projections, not guarantees.
Landlord ↔ Tenant lean methodology
- Overall (STATE)
- 87 Strongly Landlord-Friendly
- State Texas
- 87 Strongly Landlord-Friendly · R+5
- County
- — inherits STATE
- City
- — inherits STATE
ZIP-level market 75758
- Home prices YoY
- -27.6%
- Active inventory
- 225
- Price-to-rent
- 8.7×
Monthly cashflow live
- Estimated rent
- $1,300 medium interval (Pro) →
- Mortgage (P&I)
- −$708
- Tax from tax record
- −$91 /mo · $1,086/yr
- Insurance
- −$56
- HOA
- −$20
- Vacancy / Maint / Mgmt
- −$273
- Net cashflow
- $152
Break-even live
UW: 25.0% down · 7.5% · 30yr · 1.5% tax · 5.0% vac · 8.0% maint · 8.0% mgmt
Financing live
Cash to close
- Down payment
- $33,750
- Closing costs
- $4,050
- Reserves months
- —
- Total cash needed
- —
Loan-product check · same deal, 3 products live
Conventional
25% down · 7.5% · 30yr
- Down + closing
- —
- Monthly P&I
- —
- Monthly cashflow
- —
- DSCR
- —
- Eligible?
- —
Personal DTI + credit; lowest rate.
DSCR
20% down · 8.5% · 30yr
- Down + closing
- —
- Monthly P&I
- —
- Monthly cashflow
- —
- DSCR
- —
- Eligible?
- —
No personal income docs; deal must DSCR.
Hard money
10% down · 12.0% · 12mo
- Down + closing
- —
- Monthly P&I
- —
- Monthly cashflow
- —
- DSCR
- —
- Eligible?
- —
Short-term bridge; refi at stabilization.
Rent comps 1 comps
| Address | Beds | Baths | Sqft | Rent | $/sqft | DOM | Units | Dist |
|---|---|---|---|---|---|---|---|---|
| 501 Farm to Market 315 Unit 2 Chandler, TX | 2.0 | 1.0 | 1000 | $1,300 | $1.30 | 44d | 1 | 1.08mi |
HOA detail
- Monthly dues
- $20 · $240/yr
- Likely covers
- water
Listing history 7 events
-
2026-06-19days on market $135,000 Active 8 DOM
-
2026-06-18days on market $135,000 Active 7 DOM
-
2026-06-17days on market $135,000 Active 6 DOM
-
2026-06-16days on market $135,000 Active 5 DOM
-
2026-06-15days on market $135,000 Active 4 DOM
-
2026-06-14days on market $135,000 Active 2 DOM
-
2026-06-13$135,000 Active 1 DOM
ⓘ Source: listings_history table (triggers on properties + properties_extension) + one-shot
backfill from property_details.listing_events for pre-trigger history.
Tax reassessment forecast TX · Resets to sale price
- Current annual tax
- $1,086 · $91/mo
- Projected year-2 tax
- $2,470 · $206/mo
- Expected delta
- +$1,384/yr (+$115/mo · 127.4%)
ⓘ Screening estimate from a state-policy table — verify with the county assessor before closing.
Nearby sold comps map
Loading sold comps map…
Walkable amenities ~0.75 mi
Loading nearby amenities…
Taxation est. · year 1
- Rental income
- $15,600
- − Mortgage interest
- −$7,562
- − Property taxes
- −$1,086
- − Insurance
- −$675
- − Repairs & maintenance
- −$1,248
- − Management
- −$1,248
- − HOA
- −$240
- − Depreciation
- −$3,927
- Taxable loss
- −$387
- Est. tax savings @ 24.0%
- +$93
- After-tax cash flow
- $1,920/yr
For passive investors: Depreciation is non-cash, so a rental often shows a tax loss while cash-flowing — sheltering income. Rental losses are passive: they offset passive income freely, and up to $25,000/yr can offset ordinary (W-2) income if you actively participate and your MAGI is under $100k (phasing out to $0 by $150k); unused losses carry forward. On sale, claimed depreciation is recaptured at up to 25%, and gains may owe capital-gains tax (a 1031 exchange can defer both). Figures are a year-1 estimate at your 24.0% rate — not tax advice; consult a CPA.
Schools (NCES district)
- District
- Brownsboro ISD
- NCES district ID
- 4811640
- Math proficiency
- 42% ▼ -5.00%
- Reading proficiency
- 46% ▬ 0.00%
- Median HH income
- $45,624
- Composite
- 37.38/100
- National rank
- #4429
- State rank
- #290 of 826 in TX
Livability — Chandler
- Score
- 70/100
- State rank
- #347
- US rank
- #7634
Category grades
Schools grade is shown separately in the Schools card above.
Census & demographics
- Population (ZIP)
- 10,357
Population outlook (Henderson County) Hauer SSP2
- Today (2025)
- 80,471 people
- By 2030
- 80,608 · +0.2%
- By 2040
- 80,087 · -0.5%
- By 2050
- 78,208 · -2.8%
- By 2075
- 72,423 · -10.0%
- By 2100
- 61,012 · -24.2%
Race, ethnicity, and origin ACS 2023
- Neighborhood character
- Predominantly White (79%)
- Race & ethnicity
- White 79% Hispanic / Latino 16% Two or more races 9% Black 2%
- Hispanic origin (detail)
- Mexican 14%
- Common ancestry
- Slovak 3% Serbian 2% Romanian 1%
- Foreign-born
- 5% · Canada, Vietnam
- Languages at home
- 91% English-only · Spanish 8% Other Indo-European 1%
Political lean MEDSL · Henderson
- 2024 margin
- Solid R (+63.5) · D 18.0% · R 81.4%
- 2008→2024 swing
- -18.8pp toward R · 2008: -44.6pp · 2024: -63.5pp
- All cycles
- 2024: R+63.5 2020: R+60.2 2016: R+60.0 2012: R+54.8 2008: R+44.6
Not yet ingested
- Civics
- —
Market trends
- HPI YoY
- ▼ -73.16%
- Current HPI
- 192.0837
- Rent YoY
- —
- Metro
- —
- State GDP YoY
- ▲ 3.95%
- F500 in state
- 110
Industry mix (Fortune 500 HQ in TX)
| Industry | F500 HQs | Revenue |
|---|---|---|
| Energy | 16 | $1,198B |
|
||
| Technology | 5 | $198B |
|
||
| Engineering / Construction | 4 | $72B |
|
||
| Energy Services | 3 | $60B |
|
||
| Utilities | 3 | $41B |
|
||
| Healthcare | 2 | $330B |
|
||
Price history
+390.9% since first listed16 events — show timeline
- 2026-06-12 Listed $135,000 GTAR
- 2022-12-09 Sold (Public Records) — Public Records
- 2013-12-02 Sold (MLS) — NTREIS
- 2013-10-07 Pending — NTREIS
- 2013-10-04 Relisted — NTREIS
- 2013-10-04 Price Changed $20,250 NTREIS
- 2013-08-05 Pending — NTREIS
- 2013-08-03 Price Changed $24,750 NTREIS
- 2013-07-31 Relisted — NTREIS
- 2013-07-15 Pending — NTREIS
- 2013-07-14 Listing Removed — NTREIS
- 2013-05-08 Pending — NTREIS
- 2013-03-20 Listed $27,500 NTREIS
- 2008-08-18 Sold (Public Records) — Public Records
- 2006-08-16 Sold (Public Records) — Public Records
- 2004-08-06 Sold (Public Records) — Public Records
Property tax history
-3.1%/yrLatest (2025): $1,086 · +7.0% YoY. Source: county tax records.
Cash-flow waterfall
monthlySold comps — $/sqft
last 12 mo · ≤1 miLoading sold comps…