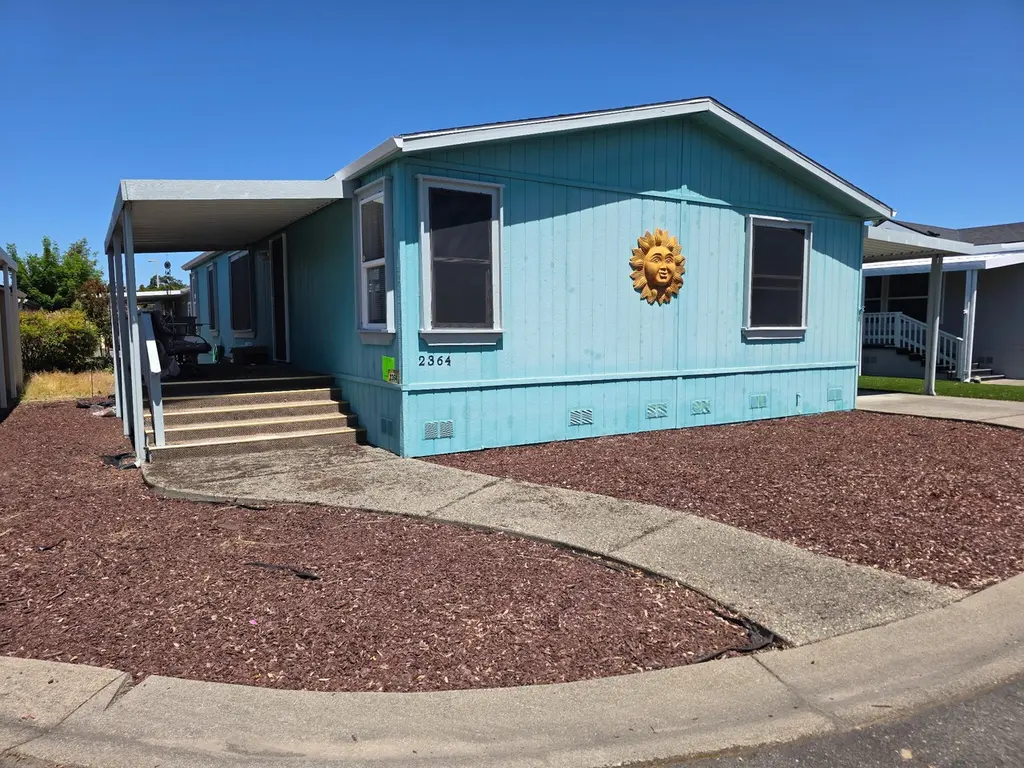
2364 Bradley Ct · Grants Pass, OR
Flood risk 1/10 · Minimal
- FEMA flood zone
- X (unshaded)
- Chance of flooding over 30 yrs
- 0.0%
- Est. flood insurance / yr
- $507 – $1,088
Fire risk 8/10 · Major
- Est. fire insurance / yr
- $498 – $926
Heat risk 6/10 · Moderate
- Hot days now (above 99°F)
- 8 days/yr
- Hot days in 30 yrs
- 17 days/yr
Wind risk 1/10 · Minimal
- Chance of severe wind over 30 yrs
- —
Air-quality risk 10/10 · Severe
- Unhealthy air days now
- 29 days/yr
- Unhealthy air days in 30 yrs
- 32 days/yr
Risk factors via First Street. Map © Google.
Why this score? — see what drove the D grade
The composite is a weighted blend of 9 inputs, each scored 0–100. Each bar is that input's sub-score; the figure is the points it added to the 100-point composite (weight × sub-score).
- Cash flow +13.5/30.0
- 1% rule +9.8/10.0
- Schools +4.2/10.0
- DSCR +4.1/10.0
- Livability +3.5/5.0
- Rent growth +3.3/5.0
- Condition / age +2.5/5.0
- ARV discount +0.0/15.0
- Appreciation +0.0/10.0
$129,900
🖨 Deal sheet (PDF) 📄 Offer letter ✓ Due diligence
Listing remarks
Double-wide 1998, split floor plan, master with bath, 3 bed. , 2 bath in Willow Estates in 55+ park. Golden West, 1404 sq ft
Key facts
- Parking
- Built 1998
- Listed 37 days
Property features AI
Finance
- Financial info: Monthly land lease $675
- HOA & community: Has association; Monthly association fee of $675; Association covers trash and water; Senior community; No CCRs
Exterior
- Parking: Attached carport
- Security: Carbon monoxide detector(s); Smoke detector(s)
- Utilities: Public water; District / public sewer; Cable connected; Electricity connected
- Home design: Mobile home (double wide) located in a park; Single-level; Manufacturer: Golden West; Vinyl skirting; May remain in park
- Construction: Built in 1998; Block foundation
- Exterior features: Composition roof; Double-pane windows with vinyl frames; Shed(s); Paved road access; Flood zone: Not applicable
Interior
- Kitchen: Dishwasher; Disposal; Oven; Range; Range hood; Refrigerator
- Bedrooms: 3 bedrooms
- Flooring: Carpet; Laminate; Vinyl
- Bathrooms: 2 full bathrooms
- Heating & cooling: Heat pump (heating and cooling); Electric heating
- Interior features: Breakfast bar; Ceiling fans; Laminate counters; Pantry; Shower/tub combo; Walk-in closet(s)
- Laundry & utility: Washer; Dryer; Dedicated laundry room
Neighborhood map
What this means for you Summary
Snapshot
- This is a 3-bed/2.0-bath manufactured listed at $130k.
Deal economics
- At list price, monthly cash flow is $6 ($69/yr) — positive.
- The deal already cash-flows at list — no discount required.
- Meets the 1% rule at list price ($2k rent vs $130k).
- Recommended offer: $126k (3.0% below list) — sets the bar for market timing.
- Cap rate 6.3% vs local median 3.2% in Grants Pass — top-decile yield for the area; either an underpriced asset or a hidden risk that comps aren't pricing in. Stress-test before assuming the spread holds.
Location & tenants
- Location reads 70/100 on livability (#137 in OR) — a middle-class / working-renter tenant base. Strengths: amenities A+, health & safety A+, housing A-; Watch: employment D, crime F, commute F.
- Grants Pass SD 7 (urban): math 39% / reading 56% proficiency, ranked #66 of 183 in OR (top 36%) — families likely to look elsewhere, expect single-tenant / working-renter base with shorter leases.
- Zoned schools: Redwood Elementary School (440 students, 70% FRL); South Middle School (reading 75%, 633 students, 69% FRL); Grants Pass High School (1,722 students, 68% FRL) — zoned schools average 69% FRL vs 53% district-wide (16 pts higher); higher-poverty schools than district average — tighter screening recommended.
- Market conditions: Rents rising (+3.0%/yr); 186 active listings in the ZIP; 7 comparable units currently listed for rent nearby; rentals lingering (median 46d on market — plan ~5-8 weeks vacancy on turnover, expect pricing pressure); 100% of comp listings sitting > 30 days — soft ceiling on asking rent; 223 units permitted in Josephine County in 2024 (5 in 5+ unit buildings).
- This rent runs 34% of the median local income ($67k/yr) — at the standard rent-burdened threshold; future hikes will face affordability resistance.
Forward outlook
- Local home prices are declining (-3.0%/yr); year-one equity from $898 of loan paydown is wiped out by about $4k of value loss. Plan a longer hold.
- Josephine County population projected at +3% by 2050 — modest demand growth; plan on rents tracking national, not racing it.
Negotiation context
- It's been on market 37 days — a 3% lower offer ($126k) is reasonable based on typical stale-listing flexibility.
- 6 sale attempts since 13y ago with the ask held roughly flat each time — persistent listings suggest the price (not the market) is what's stuck; bring a comps-based counter.
- Current owner paid $49k; list at $130k implies a 165% gain — meaningful room to come down on a strong offer.
Risks & watch-outs
- Watch-outs: HOA is 35% of rent.
- Climate carrying-cost: severe wildfire risk; extreme-heat days projected 8→17/yr by 2055 (HVAC capex compounding) — expect insurance premiums to compound above CPI over the hold.
Questions for the listing agent
- It's been on market 37 days. Have you received any prior offers? Is the seller open to a 3% concession, seller financing, or rate buy-down credit?
- What does the HOA fee cover, when was the last increase, and are there any pending special assessments or reserve-fund shortfalls?
- Is there a deadline driving the sale (1031 exchange, divorce, estate, relocation)? That informs how much negotiation room exists.
- Schools are D-rated, which usually means shorter tenancies and higher turnover. Who's the typical renter profile here, and what's been the actual vacancy rate?
- Crime grade is F in this area — have there been break-ins, vandalism, or insurance claims at this property in the last 3 years? What carrier currently insures it and at what premium?
- The area grade is low — what's the realistic commute time and amenity access for the typical tenant pool here? Any planned neighborhood developments (good or bad) we should know about?
- What's the average days-on-market for RENTAL listings here right now (not sales)? A rising rental-DOM trend means longer vacancies and softer asking-rent achievability than the comps imply.
- What's the recent tenant-quality profile in this submarket — average credit score on applications, eviction rate, late-payment / NSF rate, and stable-employment percentage? A property-management company in the area should have these aggregated.
- How much new for-sale + rental construction is in the pipeline within 1–3 miles? Heavy new supply typically softens prices + rents 12–24 months out; constrained supply supports both.
Investment metrics
- 1% rule
- 1.48% ✓
- Cap rate
- 6.35%
- Cash-on-cash
- 0.19%
- DSCR
- 1.01
- GRM
- 5.6
CMA / ARV
- ARV (median comp)
- $100,000
- List price
- $129,900
- Delta
- 29.90%
- Verdict
- OVERPRICED
- Comps
- 18 within 1.0 mi
Show comp detail 12 sales within ~0.75 mi
| Address | Dist | Beds/Ba | Sqft | Sold | Price | $/sf | Match |
|---|---|---|---|---|---|---|---|
| 1505 Agape Way | 0.25mi | 3/2.0 | 1,350 (-4%) | 4mo | $60,000 | $44 | 78 |
| 122 Whispering Willow Dr | 0.20mi | 2/2.0 (-1) | 1,365 (-3%) | 4mo | $99,900 | $73 | 77 |
| 2387 Mulberry Ct | 0.08mi | 2/2.0 (-1) | 1,512 (+8%) | 7mo | $83,000 | $55 | 72 |
| 2371 Ryan Ct | 0.00mi | 2/2.0 (-1) | 1,509 (+8%) | 12mo | $133,000 | $88 | 72 |
| 298 Whispering Willow Dr | 0.30mi | 3/2.0 | 1,512 (+8%) | 3mo | $88,000 | $58 | 70 |
| 327 Whispering Willow Dr | 0.27mi | 3/2.0 | 1,296 (-8%) | 5mo | $127,500 | $98 | 70 |
| 1450 Willow Ct | 0.09mi | 3/2.0 | 1,296 (-8%) | 16mo | $111,000 | $86 | 69 |
| 2386 Sasha Ct | 0.08mi | 3/2.0 | 1,248 (-11%) | 11mo | $115,000 | $92 | 69 |
| 1426 Willow Ct | 0.06mi | 2/2.0 (-1) | 1,512 (+8%) | 14mo | $110,000 | $73 | 68 |
| 1551 Willow Ln | 0.23mi | 3/2.0 | 1,224 (-13%) | 2mo | $72,000 | $59 | 66 |
| 1504 Agape Way | 0.25mi | 2/2.0 (-1) | 1,288 (-8%) | 6mo | $66,525 | $52 | 64 |
| 431 Whispering Willow Dr | 0.36mi | 3/2.0 | 1,296 (-8%) | 10mo | $125,000 | $96 | 62 |
Match score weights: distance 35% · size 25% · config 20% · recency 20%. Top-matched comps best support the ARV.
Projected returns pro-forma
-3.0% appreciation · 3.05% rent growth · sell at horizon
- IRR
- -15.5%
- Equity multiple
- 0.45×
- Total profit
- $-20,182
- Equity at exit
- $19,369
- IRR
- -6.3%
- Equity multiple
- 0.59×
- Total profit
- $-15,064
- Equity at exit
- $11,231
Cash invested: $36,372 (down + closing). Projections, not guarantees.
Landlord ↔ Tenant lean methodology
- Overall (STATE)
- 28 Tenant-Leaning
- State Oregon
- 28 Tenant-Leaning · D+6
- County
- — inherits STATE
- City
- — inherits STATE
ZIP-level market 97527
- Rents YoY
- 3.0%
- Active inventory
- 186
- Price-to-rent
- 5.6×
Monthly cashflow live
- Estimated rent
- $1,917 high interval (Pro) →
- Mortgage (P&I)
- −$681
- Tax from tax record
- −$98 /mo · $1,179/yr
- Insurance
- −$54
- HOA
- −$675
- Vacancy / Maint / Mgmt
- −$403
- Net cashflow
- $6
Break-even live
Sensitivity live
| Price | -10% $79 | -5% $43 | +0% $6 | +5% $-31 | +10% $-68 |
|---|---|---|---|---|---|
| Rent | -10% $-146 | -5% $-70 | +0% $6 | +5% $81 | +10% $157 |
| Rate | -1.0pp $71 | -0.5pp $39 | base $6 | +0.5pp $-28 | +1.0pp $-62 |
UW: 25.0% down · 7.5% · 30yr · 1.5% tax · 5.0% vac · 8.0% maint · 8.0% mgmt
Financing live
Cash to close
- Down payment
- $32,475
- Closing costs
- $3,897
- Reserves months
- —
- Total cash needed
- —
Loan-product check · same deal, 3 products live
Conventional
25% down · 7.5% · 30yr
- Down + closing
- —
- Monthly P&I
- —
- Monthly cashflow
- —
- DSCR
- —
- Eligible?
- —
Personal DTI + credit; lowest rate.
DSCR
20% down · 8.5% · 30yr
- Down + closing
- —
- Monthly P&I
- —
- Monthly cashflow
- —
- DSCR
- —
- Eligible?
- —
No personal income docs; deal must DSCR.
Hard money
10% down · 12.0% · 12mo
- Down + closing
- —
- Monthly P&I
- —
- Monthly cashflow
- —
- DSCR
- —
- Eligible?
- —
Short-term bridge; refi at stabilization.
Rent comps 7 comps
| Address | Beds | Baths | Sqft | Rent | $/sqft | DOM | Units | Dist |
|---|---|---|---|---|---|---|---|---|
| 1654 Kellenbeck Ave Grants Pass, OR | 2.0 | 1.0 | 1000 | $1,250 | $1.25 | 45d | 1 | 0.25mi |
| 109 SW Otter Ct Grants Pass, OR | 3.0 | 2.0 | 1545 | $2,395 | $1.55 | 45d | 1 | 0.32mi |
| 109 SW Otter Ct Grants Pass, OR | 3.0 | 2.0 | 1545 | $2,395 | $1.55 | 46d | 1 | 0.32mi |
| 1400 SW Kokanee Ln Unit 1402 Grants Pass, OR | 2.0 | 1.0 | 962 | $1,495 | $1.55 | 45d | 1 | 0.38mi |
| 1783 Medart Ln Unit 1783 Grants Pass, OR | 2.0 | 1.0 | 912 | $1,395 | $1.53 | 45d | 1 | 0.43mi |
| 1754 Sun Glo Dr Grants Pass, OR | 2.0 | 1.0 | 888 | $1,450 | $1.63 | 45d | 1 | 0.48mi |
| 1605 Kokanee Ln Grants Pass, OR | 3.0 | 2.0 | 1540 | $2,200 | $1.43 | 45d | 1 | 0.52mi |
HOA detail
- Monthly dues
- $675 · $8,100/yr
Listing history 29 events
-
2026-06-21days on market $129,900 Active 37 DOM
-
2026-06-19days on market $129,900 Active 35 DOM
-
2026-06-18days on market $129,900 Active 34 DOM
-
2026-06-17days on market $129,900 Active 33 DOM
-
2026-06-16days on market $129,900 Active 32 DOM
-
2026-06-15days on market $129,900 Active 31 DOM
-
2026-06-14days on market $129,900 Active 29 DOM
-
2026-06-13days on market $129,900 Active 28 DOM
-
2026-06-10days on market $129,900 Active 26 DOM
-
2026-06-09days on market $129,900 Active 25 DOM
-
2026-06-08days on market $129,900 Active 24 DOM
-
2026-06-07days on market $129,900 Active 23 DOM
-
2026-06-05days on market $129,900 Active 20 DOM
-
2026-06-03days on market $129,900 Active 19 DOM
-
2026-06-02days on market $129,900 Active 18 DOM
-
2026-06-01days on market $129,900 Active 17 DOM
-
2026-05-31days on market $129,900 Active 16 DOM
-
2026-05-30days on market $129,900 Active 15 DOM
-
2026-05-15$129,900 Active 124-char remark
-
2020-04-27historical
-
2020-04-27historical
-
2016-01-07soldstatus $49,000
-
2015-11-16$49,900
-
2015-04-20soldstatus $44,900
-
2015-03-12$44,900
-
2014-12-06historical
-
2014-09-26$59,900
-
2013-09-30$44,500
-
2013-04-09$45,000
ⓘ Source: listings_history table (triggers on properties + properties_extension) + one-shot
backfill from property_details.listing_events for pre-trigger history.
Tax reassessment forecast OR · Resets to sale price
- Current annual tax
- $1,179 · $98/mo
- Projected year-2 tax
- $1,260 · $105/mo
- Expected delta
- +$81/yr (+$7/mo · 6.8%)
ⓘ Screening estimate from a state-policy table — verify with the county assessor before closing.
Climate risk First Street
- Flood 1/10 Low FEMA zone X (unshaded) · 0% chance over 30 yrs
- Wildfire 8/10 Severe
- Heat 6/10 Major 8 d/yr ≥99°F today · 17 d/yr by 30 yrs out
- Wind 1/10 Low
- Air quality 10/10 Extreme 29 unhealthy d/yr today · 32 by 30 yrs out
Nearby sold comps map
Loading sold comps map…
Walkable amenities ~0.75 mi
Loading nearby amenities…
Taxation est. · year 1
- Rental income
- $23,003
- − Mortgage interest
- −$7,276
- − Property taxes
- −$1,179
- − Insurance
- −$650
- − Repairs & maintenance
- −$1,840
- − Management
- −$1,840
- − HOA
- −$8,100
- − Depreciation
- −$3,779
- Taxable loss
- −$1,662
- Est. tax savings @ 24.0%
- +$399
- After-tax cash flow
- $468/yr
For passive investors: Depreciation is non-cash, so a rental often shows a tax loss while cash-flowing — sheltering income. Rental losses are passive: they offset passive income freely, and up to $25,000/yr can offset ordinary (W-2) income if you actively participate and your MAGI is under $100k (phasing out to $0 by $150k); unused losses carry forward. On sale, claimed depreciation is recaptured at up to 25%, and gains may owe capital-gains tax (a 1031 exchange can defer both). Figures are a year-1 estimate at your 24.0% rate — not tax advice; consult a CPA.
Schools (NCES district)
- District
- Grants Pass SD 7
- NCES district ID
- 4105910
- Math proficiency
- 39% ▲ 1.00%
- Reading proficiency
- 56% ▬ 0.00%
- Median HH income
- $36,433
- Composite
- 41.5/100
- National rank
- #7281
- State rank
- #66 of 183 in OR
Livability — Grants Pass
- Score
- 70/100
- State rank
- #137
- US rank
- #7900
Category grades
Schools grade is shown separately in the Schools card above.
Census & demographics
- Census place
- Grants Pass, OR
- County
- Josephine County · 73,366 people
- City population
- 73,366
- Metro
- Grants Pass, OR
- Population (ZIP)
- 37,330
- Household income
- $66,975
- Rent vs Own
- Severe rent burden
- 1018.0
Population outlook (Josephine County) Hauer SSP2
- Today (2025)
- 87,883 people
- By 2030
- 89,055 · +1.3%
- By 2040
- 90,396 · +2.9%
- By 2050
- 90,801 · +3.3%
- By 2075
- 89,880 · +2.3%
- By 2100
- 81,252 · -7.5%
Race, ethnicity, and origin ACS 2023
- Neighborhood character
- Predominantly White (82%)
- Race & ethnicity
- White 82% Hispanic / Latino 11% Two or more races 9%
- Hispanic origin (detail)
- Mexican 8%
- Common ancestry
- Italian 4% Portuguese 3% Lithuanian 3%
- Foreign-born
- 4% · Canada, Vietnam
- Languages at home
- 94% English-only · Spanish 4% German/W. Germanic 1% Other Indo-European 1%
Political lean MEDSL · Josephine
- 2024 margin
- Strong R (+29.1) · D 34.2% · R 63.3% · Other 2.5%
- 2008→2024 swing
- -15.8pp toward R · 2008: -13.2pp · 2024: -29.1pp
- All cycles
- 2024: R+29.1 2020: R+25.8 2016: R+31.4 2012: R+21.9 2008: R+13.2
Not yet ingested
- Civics
- —
Market trends
- HPI YoY
- ▼ -203.09%
- Current HPI
- 318.0477
- Rent YoY
- ▲ 3.05%
- Metro
- Grants Pass, OR
- State GDP YoY
- ▲ 2.05%
- F500 in state
- 2
Industry mix (Fortune 500 HQ in OR)
| Industry | F500 HQs | Revenue |
|---|---|---|
| Consumer Goods | 1 | $51B |
|
||
Price history
+188.7% since first listed11 events — show timeline
- 2026-05-15 Listed $129,900 MLSCO
- 2020-04-27 Listing Removed — MLSCO
- 2020-04-27 Listing Removed — MLSCO
- 2016-01-07 Sold (MLS) $49,000 MLSCO
- 2015-11-16 Listed $49,900 MLSCO
- 2015-04-20 Sold (MLS) $44,900 MLSCO
- 2015-03-12 Listed $44,900 MLSCO
- 2014-12-06 Listing Removed — MLSCO
- 2014-09-26 Listed $59,900 MLSCO
- 2013-09-30 Listed $44,500 MLSCO
- 2013-04-09 Listed $45,000 MLSCO
Property tax history
+9.6%/yrLatest (2025): $1,179 · +6.1% YoY. Source: county tax records.
Cash-flow waterfall
monthlySold comps — $/sqft
last 12 mo · ≤1 miLoading sold comps…