 🌊 Lakefront
1391 Flamingo Dr · Englewood, FL
Flood risk 8/10 · Major
- FEMA flood zone
- AE
- Chance of flooding over 30 yrs
- 0.97%
- Est. flood insurance / yr
- $1,737 – $8,500
Fire risk 5/10 · Moderate
- Est. fire insurance / yr
- $947 – $1,759
Heat risk 10/10 · Severe
- Hot days now (above 107°F)
- 7 days/yr
- Hot days in 30 yrs
- 29 days/yr
Wind risk 10/10 · Severe
- Chance of severe wind over 30 yrs
- 99.0%
Air-quality risk 2/10 · Minimal
- Unhealthy air days now
- 1 days/yr
- Unhealthy air days in 30 yrs
- 1 days/yr
Risk factors via First Street. Map © Google.
Why this score? — see what drove the C- grade
The composite is a weighted blend of 9 inputs, each scored 0–100. Each bar is that input's sub-score; the figure is the points it added to the 100-point composite (weight × sub-score).
- Cash flow +21.0/30.0
- ARV discount +7.5/15.0
- DSCR +6.7/10.0
- 1% rule +5.3/10.0
- Schools +4.6/10.0
- Livability +3.7/5.0
- Rent growth +2.5/5.0
- Condition / age +2.5/5.0
- Appreciation +0.0/10.0
$189,000
🖨 Deal sheet 📄 Offer letter ✓ Due diligence
Listing remarks
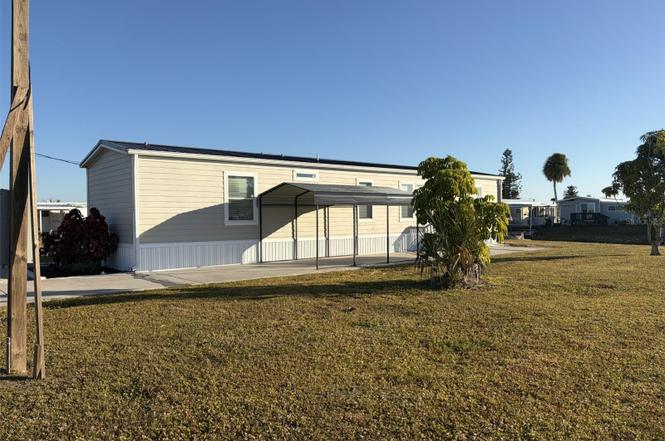
NEW PRICE: ARE YOU LOOKING AT MOVING TO FLORIDA FOR THE WARMER WEATHER? This home comes Furnished and is located on the Redfish Waterway. This Manufactured home has 960 square Ft. and was built in2022. Crafted by Winston Home builders nestled in the coveted Manatee Cove of Englewood/Holiday Estates 2nd addition. This home was built for wind zone III (110) MPS and is securely anchored accordingly providing peace of mind for homeowners. Worried about flooding? The county required foundation elevates the home to eliminate the risk of flooding. In addition, all trees and other flammable materials have been removed within 300 yards to neutralize any risk of fire The community is
Key facts
- Redfish waterway
- Wind zone iii
- Waterfront home
Tags
Property features AI
Finance
- Other: Furnished; Association fee covers grounds maintenance
- Financial info: Lease restrictions apply
- HOA & community: Has HOA (monthly $12.50 / annual $150) - optional; HOA amenities include clubhouse; Community features: clubhouse, deed restrictions, golf carts allowed, special community restrictions, tennis courts; Senior community; Pets allowed (cats and dogs; breed restrictions)
Exterior
- Parking: Carport with 2 spaces
- Security: Smoke detector(s)
- Utilities: Public water; Canal/lake irrigation available; Water connected; Sewer: Other; Electricity connected; Cable available and connected; Broadband/high-speed internet available
- Home design: Manufactured home (single wide); One level; Faces south; New construction
- Construction: Metal roof; Built by Winston Home Builders; Block, slab, and stilt/piling foundation
- Exterior features: Hurricane shutters; Private mailbox; In-ground pool with screen enclosure; On waterfront (canal) with water access; Water view (canal); Minimum wake zone
Interior
- Kitchen: Cooktop; Range; Dishwasher; Disposal; Refrigerator
- Bedrooms: 2 bedrooms
- Flooring: Laminate
- Bathrooms: 2 full bathrooms
- Heating & cooling: Central heating; Central air
- Interior features: Eat-in kitchen; High ceilings; Smoke detector(s)
- Laundry & utility: Washer; Dryer; Electric dryer hookup; Laundry room (inside)
Neighborhood map
What this means for you Summary
Snapshot
- This is a 2-bed/2.0-bath manufactured listed at $189k.
Deal economics
- At list price, monthly cash flow is $-159 ($-2k/yr) — negative.
- To cash-flow at today's rent, offer at most $161k (14.8% below list).
- Meets the 1% rule at list price ($2k rent vs $189k).
- Recommended offer: $161k (14.8% below list) — sets the bar for cash-flow.
- Cap rate 8.0% vs local median 3.8% in Englewood — top-decile yield for the area; either an underpriced asset or a hidden risk that comps aren't pricing in. Stress-test before assuming the spread holds.
Location & tenants
- Location reads 73/100 on livability (#321 in FL) — a middle-class / working-renter tenant base. Strengths: housing A+, cost of living A, health & safety A; Watch: employment C-, amenities F, commute F.
- Charlotte (suburban): math 54% / reading 54% proficiency, ranked #22 of 73 in FL (top 30%) — acceptable for families but not a draw, mixed tenant base, ~2y average lease.
- Zoned schools: Lemon Bay High School (math 50% / reading 56%, grade C-, #148 of 667 statewide, top 23%, 1,360 students, 28% FRL) — zoned schools average 28% FRL vs 54% district-wide (25 pts lower); this property's tenant base skews higher-income than the district average.
- Market conditions: Rents soft (-0.1%/yr); 734 active listings in the ZIP; 8 comparable units currently listed for rent nearby; rentals at typical pace (median 21d on market — plan ~3-4 weeks tenant-placement turnaround); 4,585 units permitted in Charlotte County in 2024 (703 in 5+ unit buildings).
- This rent runs 41% of the median local income ($57k/yr) — at the standard rent-burdened threshold; future hikes will face affordability resistance.
Forward outlook
- Local home prices are declining (-3.0%/yr); year-one equity from $1k of loan paydown is wiped out by about $6k of value loss. Plan a longer hold.
- Charlotte County population projected at +24% by 2050 — long-run rental-demand tailwind backs the buy-and-hold thesis.
Negotiation context
- It's been on market 333 days — a 12% lower offer ($166k) is reasonable based on typical stale-listing flexibility.
- 6 sale attempts since 4y ago; this cycle's ask has dropped $40k (17%) from the opening price — seller is motivated, your offer sets the floor, not the list.
Risks & watch-outs
- Watch-outs: flood insurance adds $427/mo.
- Climate carrying-cost: in FEMA flood zone AE (mandatory federal flood insurance); severe wind risk, 99% chance of damaging wind over 30y; moderate wildfire risk; extreme-heat days projected 7→29/yr by 2055 (HVAC capex compounding) — expect insurance premiums to compound above CPI over the hold.
Questions for the listing agent
- What do current leases actually rent for vs. the listed asking? Can we see a recent rent roll and the last 12 months of T-12 income?
- It's been on market 333 days. Have you received any prior offers? Is the seller open to a 15% concession, seller financing, or rate buy-down credit?
- What's the actual annual flood-insurance premium (NFIP or private), and is the property in a SFHA with mandatory coverage?
- What does the HOA fee cover, when was the last increase, and are there any pending special assessments or reserve-fund shortfalls?
- Why hasn't it sold? Are there any deal-killer items the seller is aware of (foundation, flood, title, zoning, code violations)?
- Is there a deadline driving the sale (1031 exchange, divorce, estate, relocation)? That informs how much negotiation room exists.
- Schools are A-rated — typically a magnet for longer-tenancy family renters. What's the average tenant stay here, and is there a school-zone premium baked into asking?
- This sits on a lake — are riparian / water-frontage rights deeded with the parcel? Any dock permits, shoreline easements, or HOA water-use restrictions?
- What's the documented flood / surge / shoreline-erosion history here (FEMA AND non-FEMA — e.g., storm surge, creek backup, septic-field saturation)?
- Any water-quality or seasonal algae-bloom issues that affect tenant satisfaction or short-term-rental demand?
- What's the average days-on-market for RENTAL listings here right now (not sales)? A rising rental-DOM trend means longer vacancies and softer asking-rent achievability than the comps imply.
- What's the recent tenant-quality profile in this submarket — average credit score on applications, eviction rate, late-payment / NSF rate, and stable-employment percentage? A property-management company in the area should have these aggregated.
- How much new for-sale + rental construction is in the pipeline within 1–3 miles? Heavy new supply typically softens prices + rents 12–24 months out; constrained supply supports both.
Investment metrics
- 1% rule
- 1.03% ✓
- Cap rate
- 7.99%
- Cash-on-cash
- 6.08%
- DSCR
- 1.27
- GRM
- 8.1
CMA / ARV
- ARV (on-the-fly)
- $44,100
- Comps found
- 1
Show comp detail 1 sale within ~0.75 mi
| Address | Dist | Beds/Ba | Sqft | Sold | Price | $/sf | Match |
|---|---|---|---|---|---|---|---|
| 426 Camino Real | 0.46mi | 2/2.0 | 818 (-9%) | 8mo | $40,000 | $49 | 57 |
Match score weights: distance 35% · size 25% · config 20% · recency 20%. Top-matched comps best support the ARV.
Projected returns pro-forma
-3.0% appreciation · 0.0% rent growth · sell at horizon
- IRR
- -26.8%
- Equity multiple
- 0.13×
- Total profit
- $-46,162
- Equity at exit
- $28,181
- IRR
- -47.3%
- Equity multiple
- -0.40×
- Total profit
- $-74,168
- Equity at exit
- $16,341
Cash invested: $52,920 (down + closing). Projections, not guarantees.
Landlord ↔ Tenant lean methodology
- Overall (STATE)
- 87 Strongly Landlord-Friendly
- State Florida
- 87 Strongly Landlord-Friendly · R+3
- County
- — inherits STATE
- City
- — inherits STATE
ZIP-level market 34224
- Home prices YoY
- -18.9%
- Rents YoY
- -0.1%
- Active inventory
- 734
- Price-to-rent
- 8.1×
Monthly cashflow live
- Estimated rent
- $1,949 high interval (Pro) →
- Mortgage (P&I)
- −$991
- Tax from tax record
- −$189 /mo · $2,273/yr
- Insurance
- −$79
- Flood insurance flood zone
- −$427 /mo · $5,118/yr
- HOA
- −$12
- Vacancy / Maint / Mgmt
- −$409
- Net cashflow
- $-159
Break-even live
UW: 25.0% down · 7.5% · 30yr · 1.5% tax · 5.0% vac · 8.0% maint · 8.0% mgmt
Financing live
Cash to close
- Down payment
- $47,250
- Closing costs
- $5,670
- Reserves months
- —
- Total cash needed
- —
Loan-product check · same deal, 3 products live
Conventional
25% down · 7.5% · 30yr
- Down + closing
- —
- Monthly P&I
- —
- Monthly cashflow
- —
- DSCR
- —
- Eligible?
- —
Personal DTI + credit; lowest rate.
DSCR
20% down · 8.5% · 30yr
- Down + closing
- —
- Monthly P&I
- —
- Monthly cashflow
- —
- DSCR
- —
- Eligible?
- —
No personal income docs; deal must DSCR.
Hard money
10% down · 12.0% · 12mo
- Down + closing
- —
- Monthly P&I
- —
- Monthly cashflow
- —
- DSCR
- —
- Eligible?
- —
Short-term bridge; refi at stabilization.
Rent comps 8 comps
| Address | Beds | Baths | Sqft | Rent | $/sqft | DOM | Units | Dist |
|---|---|---|---|---|---|---|---|---|
| 2275 S McCall Rd #201 Englewood, FL | 2.0 | 2.0 | 1050 | $2,000 | $1.90 | 13d | 1 | 0.37mi |
| 1604 Cardinal Ln Unit 1 Englewood, FL | 1.0 | 1.0 | 750 | $1,300 | $1.73 | 20d | 1 | 0.43mi |
| 6699 San Casa Dr Englewood, FL | 2.0 | 2.0 | 1028 | $1,900 | $1.85 | 20d | 1 | 0.81mi |
| 1531 Placida Rd #203 Englewood, FL | 2.0 | 2.0 | 1056 | $3,900 | $3.69 | 20d | 1 | 1.13mi |
| 1531 Placida Rd #204 Englewood, FL | 2.0 | 2.0 | 1056 | $3,500 | $3.31 | 20d | 1 | 1.13mi |
| 9264 Anita Ave Unit A Englewood, FL | 2.0 | 2.0 | 1008 | $1,400 | $1.39 | 20d | 1 | 1.18mi |
| 9312 Anita Ave Unit B Englewood, FL | 2.0 | 1.0 | 972 | $1,600 | $1.65 | 20d | 1 | 1.27mi |
| 1435 New Point Comfort Rd Unit B Englewood, FL | 1.0 | 1.0 | 744 | $1,520 | $2.04 | 20d | 1 | 1.42mi |
HOA detail
- Monthly dues
- $12 · $144/yr
- Likely covers
- water
Listing history 34 events
-
2026-06-18days on market $189,000 Active 333 DOM
-
2026-06-17days on market $189,000 Active 332 DOM
-
2026-06-16days on market $189,000 Active 331 DOM
-
2026-06-15days on market $189,000 Active 330 DOM
-
2026-06-14days on market $189,000 Active 328 DOM
-
2026-06-13days on market $189,000 Active 327 DOM
-
2026-06-10days on market $189,000 Active 325 DOM
-
2026-06-09days on market $189,000 Active 324 DOM
-
2026-06-08days on market $189,000 Active 323 DOM
-
2026-06-05days on market $189,000 Active 319 DOM
-
2026-06-01days on market $189,000 Active 317 DOM
-
2026-05-31days on market $189,000 Active 316 DOM
-
2026-05-30days on market $189,000 Active 315 DOM
-
2026-04-04price $189,000
-
2026-01-09price $209,000
-
2026-01-02status Active
-
2026-01-01historical
-
2025-07-18$229,000 Active
-
2025-05-31historical
-
2025-01-21price $279,000
-
2024-09-10status Active
-
2024-09-09historical
-
2024-09-06price $289,000
-
2024-08-23status Active
-
2024-08-22historical
-
2024-07-25price $298,000
-
2024-05-01price $304,000
-
2024-03-22$319,000 Active
-
2022-10-07historical
-
2022-08-20$195,000 Active
-
2022-08-05soldstatus $170,000
-
2022-03-21soldstatus $165,000
-
2004-02-18soldstatus $65,000
-
1991-02-01soldstatus $39,000
ⓘ Source: listings_history table (triggers on properties + properties_extension) + one-shot
backfill from property_details.listing_events for pre-trigger history.
Tax reassessment forecast FL · Resets to sale price
- Current annual tax
- $2,273 · $189/mo
- Projected year-2 tax
- $2,273 · $189/mo
- Expected delta
- $0/yr ($0/mo · 0.0%)
ⓘ Screening estimate from a state-policy table — verify with the county assessor before closing.
Climate risk First Street
- Flood 8/10 Severe FEMA zone AE · 97% chance over 30 yrs
- Wildfire 5/10 Major
- Heat 10/10 Extreme 7 d/yr ≥107°F today · 29 d/yr by 30 yrs out
- Wind 10/10 Extreme 99% chance of damaging wind over 30 yrs
- Air quality 2/10 Low 1 unhealthy d/yr today · 1 by 30 yrs out
Nearby sold comps map
Loading sold comps map…
Walkable amenities ~0.75 mi
Loading nearby amenities…
Taxation est. · year 1
- Rental income
- $23,382
- − Mortgage interest
- −$10,587
- − Property taxes
- −$2,273
- − Insurance
- −$6,064
- − Repairs & maintenance
- −$1,871
- − Management
- −$1,871
- − HOA
- −$144
- − Depreciation
- −$5,498
- Taxable loss
- −$4,925
- Est. tax savings @ 24.0%
- +$1,182
- After-tax cash flow
- $-720/yr
For passive investors: Depreciation is non-cash, so a rental often shows a tax loss while cash-flowing — sheltering income. Rental losses are passive: they offset passive income freely, and up to $25,000/yr can offset ordinary (W-2) income if you actively participate and your MAGI is under $100k (phasing out to $0 by $150k); unused losses carry forward. On sale, claimed depreciation is recaptured at up to 25%, and gains may owe capital-gains tax (a 1031 exchange can defer both). Figures are a year-1 estimate at your 24.0% rate — not tax advice; consult a CPA.
Schools (NCES district)
- District
- Charlotte
- NCES district ID
- 1200240
- Math proficiency
- 54% ▼ -6.00%
- Reading proficiency
- 54% ▼ -1.00%
- Median HH income
- $44,864
- Composite
- 45.62/100
- National rank
- #2586
- State rank
- #22 of 73 in FL
Livability — Englewood
- Score
- 73/100
- State rank
- #321
- US rank
- #5655
Category grades
Schools grade is shown separately in the Schools card above.
Census & demographics
- Census place
- Englewood, FL
- County
- Charlotte County · 196,994 people
- City population
- 35,420
- Metro
- Punta Gorda, FL
- Population (ZIP)
- 15,536
- Household income
- $57,281
- Rent vs Own
- Severe rent burden
- 329.0
Population outlook (Charlotte County) Hauer SSP2
- Today (2025)
- 198,646 people
- By 2030
- 210,507 · +6.0%
- By 2040
- 230,857 · +16.2%
- By 2050
- 247,148 · +24.4%
- By 2075
- 281,777 · +41.8%
- By 2100
- 293,609 · +47.8%
Race, ethnicity, and origin ACS 2023
- Neighborhood character
- Predominantly White (92%)
- Race & ethnicity
- White 92% Two or more races 5% Hispanic / Latino 3% Asian 1%
- Common ancestry
- Romanian 4% Slovak 4% Lithuanian 4%
- Foreign-born
- 9% · Canada
- Languages at home
- 92% English-only · Other Indo-European 2% Spanish 2% German/W. Germanic 1%
Political lean MEDSL · Charlotte
- 2024 margin
- Solid R (+34.0) · D 32.7% · R 66.7%
- 2008→2024 swing
- -26.7pp toward R · 2008: -7.2pp · 2024: -34.0pp
- All cycles
- 2024: R+34.0 2020: R+26.6 2016: R+27.8 2012: R+14.3 2008: R+7.2
Not yet ingested
- Civics
- —
Market trends
- HPI YoY
- ▼ -75.76%
- Current HPI
- 325.0345
- Rent YoY
- ▼ -0.11%
- Metro
- Punta Gorda, FL
- State GDP YoY
- ▲ 3.28%
- F500 in state
- 36
Industry mix (Fortune 500 HQ in FL)
| Industry | F500 HQs | Revenue |
|---|---|---|
| Industrial Technology | 2 | $29B |
|
||
| Insurance | 2 | $17B |
|
||
| Retail | 1 | $60B |
|
||
| Technology Distribution | 1 | $58B |
|
||
| Homebuilding | 1 | $35B |
|
||
| Technology Manufacturing | 1 | $35B |
|
||
Price history
+384.6% since first listed21 events — show timeline
- 2026-04-04 Price Changed $189,000 Stellar MLS as Distributed by MLS Grid
- 2026-01-09 Price Changed $209,000 Stellar MLS as Distributed by MLS Grid
- 2026-01-02 Relisted — Stellar MLS as Distributed by MLS Grid
- 2026-01-01 Listing Removed — Stellar MLS as Distributed by MLS Grid
- 2025-07-18 Listed $229,000 Stellar MLS as Distributed by MLS Grid
- 2025-05-31 Listing Removed — Stellar MLS as Distributed by MLS Grid
- 2025-01-21 Price Changed $279,000 Stellar MLS as Distributed by MLS Grid
- 2024-09-10 Relisted — Stellar MLS as Distributed by MLS Grid
- 2024-09-09 Listing Removed — Stellar MLS as Distributed by MLS Grid
- 2024-09-06 Price Changed $289,000 Stellar MLS as Distributed by MLS Grid
- 2024-08-23 Relisted — Stellar MLS as Distributed by MLS Grid
- 2024-08-22 Listing Removed — Stellar MLS as Distributed by MLS Grid
- 2024-07-25 Price Changed $298,000 Stellar MLS as Distributed by MLS Grid
- 2024-05-01 Price Changed $304,000 Stellar MLS as Distributed by MLS Grid
- 2024-03-22 Listed $319,000 Stellar MLS as Distributed by MLS Grid
- 2022-10-07 Listing Removed — Stellar MLS as Distributed by MLS Grid
- 2022-08-20 Listed $195,000 Stellar MLS as Distributed by MLS Grid
- 2022-08-05 Sold (Public Records) $170,000 Public Records
- 2022-03-21 Sold (Public Records) $165,000 Public Records
- 2004-02-18 Sold (Public Records) $65,000 Public Records
- 1991-02-01 Sold (Public Records) $39,000 Public Records
Property tax history
+12.7%/yrLatest (2025): $2,273 · +97.4% YoY. Source: county tax records.
Cash-flow waterfall
monthlySold comps — $/sqft
last 12 mo · ≤1 miLoading sold comps…