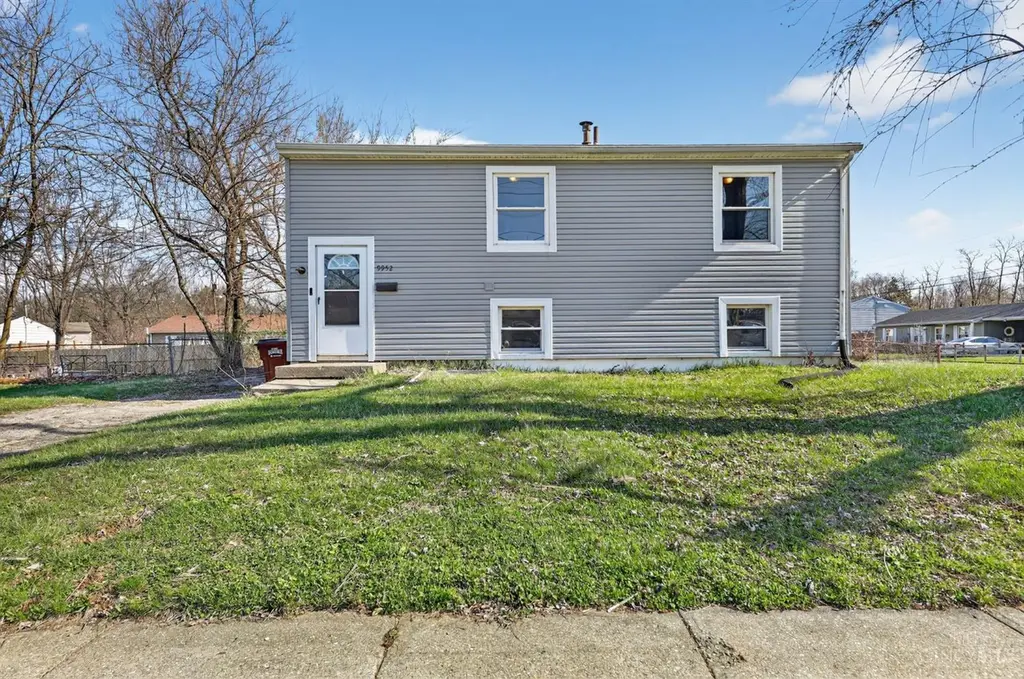
9952 Capstan Dr · Northgate, OH
Flood risk 1/10 · Minimal
- FEMA flood zone
- X (unshaded)
- Chance of flooding over 30 yrs
- 0.0%
- Est. flood insurance / yr
- $507 – $1,088
Fire risk 1/10 · Minimal
- Est. fire insurance / yr
- $713 – $1,323
Heat risk 4/10 · Minor
- Hot days now (above 103°F)
- 7 days/yr
- Hot days in 30 yrs
- 19 days/yr
Wind risk 2/10 · Minimal
- Chance of severe wind over 30 yrs
- 1.0%
Air-quality risk 4/10 · Minor
- Unhealthy air days now
- 4 days/yr
- Unhealthy air days in 30 yrs
- 6 days/yr
Risk factors via First Street. Map © Google.
Why this score? — see what drove the C- grade
The composite is a weighted blend of 9 inputs, each scored 0–100. Each bar is that input's sub-score; the figure is the points it added to the 100-point composite (weight × sub-score).
- Cash flow +18.9/30.0
- ARV discount +7.5/15.0
- DSCR +5.9/10.0
- 1% rule +5.1/10.0
- Livability +4.2/5.0
- Schools +3.7/10.0
- Rent growth +2.5/5.0
- Condition / age +2.5/5.0
- Appreciation +0.0/10.0
$169,900
🖨 Deal sheet 📄 Offer letter ✓ Due diligence
Listing remarks
Welcome to this beautifully maintained 4-bedroom block home in the heart of Colerain Township! Built in 1962, this classic home combines mid-century durability with modern comfort. The main level features an inviting, sun-drenched living area with updated double-pane vinyl windows and original hardwood potential. The functional kitchen flows seamlessly into the dining space, perfect for easy entertaining. Downstairs, the expansive finished basement nearly doubles your living square footage, ideal for a media room, home office, or gym. Enjoy peace of mind with municipal water and sewer, plus efficient natural gas heating and central cooling to keep you comfortable year-round. The level backy
Key facts
- Natural gas heating
- Central cooling
- Level backyard
Tags
Property features AI
Finance
- Other: Lease not considered
- HOA & community: No HOA
Exterior
- Parking: Driveway
- Utilities: Public water; Public sewer; Natural gas
- Home design: Traditional single-family home; Two levels; Slab foundation
- Construction: Vinyl siding construction; Shingle roof; Slab foundation; Second floor area noted
- Exterior features: Shingle roof; Vinyl siding; Residential zoning; Lot approximately 0.192 acres
Interior
- Kitchen: Oven/Range; Refrigerator
- Bedrooms: Four bedrooms — three on main level (11x9, 10x9, 8x11) and one lower-level bedroom (24x13)
- Bathrooms: One full bathroom on main level; Primary bathroom listed as other
- Heating & cooling: Central air conditioning; Forced air gas heating; Gas water heating
- Interior features: Seven total rooms; Slider windows
Neighborhood map
What this means for you Summary
Snapshot
- This is a 3-bed/1.0-bath single-family listed at $170k.
Deal economics
- At list price, monthly cash flow is $173 ($2k/yr) — positive.
- The deal already cash-flows at list — no discount required.
- Meets the 1% rule at list price ($2k rent vs $170k).
- Recommended offer: $160k (6.0% below list) — sets the bar for market timing.
Location & tenants
- Location reads 84/100 on livability (#55 in OH, #761 nationally) — a professional / high-income tenant draw. Strengths: commute A+, cost of living A+, housing A+; Watch: schools C-, employment C-.
- Northwest Local (suburban): math 38% / reading 46% proficiency, ranked #508 of 656 in OH (top 77%) — families likely to look elsewhere, expect single-tenant / working-renter base with shorter leases.
- Market conditions: 53 active listings in the ZIP; 4 comparable units currently listed for rent nearby; rentals leasing fast (median 12d on market — plan ~1-2 weeks tenant-placement turnaround); 801 units permitted in Hamilton County in 2024 (190 in 5+ unit buildings).
Forward outlook
- Local home prices are declining (-3.0%/yr); year-one equity from $1k of loan paydown is wiped out by about $5k of value loss. Plan a longer hold.
Negotiation context
- It's been on market 76 days — a 6% lower offer ($160k) is reasonable based on typical stale-listing flexibility.
- Current owner paid $62k; list at $170k implies a 174% gain — meaningful room to come down on a strong offer.
Questions for the listing agent
- It's been on market 76 days. Have you received any prior offers? Is the seller open to a 6% concession, seller financing, or rate buy-down credit?
- Built in 1962 — when were the roof, HVAC, electrical panel, plumbing, and water heater last replaced?
- Why hasn't it sold? Are there any deal-killer items the seller is aware of (foundation, flood, title, zoning, code violations)?
- Is there a deadline driving the sale (1031 exchange, divorce, estate, relocation)? That informs how much negotiation room exists.
- What's the average days-on-market for RENTAL listings here right now (not sales)? A rising rental-DOM trend means longer vacancies and softer asking-rent achievability than the comps imply.
- What's the recent tenant-quality profile in this submarket — average credit score on applications, eviction rate, late-payment / NSF rate, and stable-employment percentage? A property-management company in the area should have these aggregated.
- How much new for-sale + rental construction is in the pipeline within 1–3 miles? Heavy new supply typically softens prices + rents 12–24 months out; constrained supply supports both.
Investment metrics
- 1% rule
- 1.01% ✓
- Cap rate
- 7.52%
- Cash-on-cash
- 4.37%
- DSCR
- 1.19
- GRM
- 8.3
CMA / ARV
No comps found within radius.
Projected returns pro-forma
-3.0% appreciation · 3.0% rent growth · sell at horizon
- IRR
- -9.5%
- Equity multiple
- 0.65×
- Total profit
- $-16,465
- Equity at exit
- $25,333
- IRR
- -0.0%
- Equity multiple
- 1.00×
- Total profit
- $-12
- Equity at exit
- $14,690
Cash invested: $47,572 (down + closing). Projections, not guarantees.
Landlord ↔ Tenant lean methodology
- Overall (STATE)
- 73 Landlord-Friendly
- State Ohio
- 73 Landlord-Friendly · R+6
- County
- — inherits STATE
- City
- — inherits STATE
ZIP-level market 45251
- Active inventory
- 53
- Price-to-rent
- 8.3×
Monthly cashflow live
- Estimated rent
- $1,709 medium interval (Pro) →
- Mortgage (P&I)
- −$891
- Tax from tax record
- −$215 /mo · $2,581/yr
- Insurance
- −$71
- HOA
- −$0
- Vacancy / Maint / Mgmt
- −$359
- Net cashflow
- $173
Break-even live
UW: 25.0% down · 7.5% · 30yr · 1.5% tax · 5.0% vac · 8.0% maint · 8.0% mgmt
Financing live
Cash to close
- Down payment
- $42,475
- Closing costs
- $5,097
- Reserves months
- —
- Total cash needed
- —
Loan-product check · same deal, 3 products live
Conventional
25% down · 7.5% · 30yr
- Down + closing
- —
- Monthly P&I
- —
- Monthly cashflow
- —
- DSCR
- —
- Eligible?
- —
Personal DTI + credit; lowest rate.
DSCR
20% down · 8.5% · 30yr
- Down + closing
- —
- Monthly P&I
- —
- Monthly cashflow
- —
- DSCR
- —
- Eligible?
- —
No personal income docs; deal must DSCR.
Hard money
10% down · 12.0% · 12mo
- Down + closing
- —
- Monthly P&I
- —
- Monthly cashflow
- —
- DSCR
- —
- Eligible?
- —
Short-term bridge; refi at stabilization.
Rent comps 4 comps
| Address | Beds | Baths | Sqft | Rent | $/sqft | DOM | Units | Dist |
|---|---|---|---|---|---|---|---|---|
| 10101 Arborwood Dr Cincinnati, OH | 1.0–3.0 | 1.0–1.5 | 912 | $1,649 | $1.81 | 1d | 26 | 0.63mi |
| 10220 September Dr Cincinnati, OH | 4.0 | 1.0 | 1025 | $1,890 | $1.84 | 12d | 1 | 0.74mi |
| 9333 Round Top Cincinnati, OH | 1.0–3.0 | 1.0–2.0 | 979 | $1,623 | $1.66 | 2d | 3 | 1.07mi |
| 2753 Town Terrace Dr Cincinnati, OH | 2.0–3.0 | 1.0–1.5 | 968 | $1,450 | $1.50 | 21d | 4 | 1.34mi |
Listing history 19 events
-
2026-06-18days on market $169,900 Active 76 DOM
-
2026-06-17days on market $169,900 Active 75 DOM
-
2026-06-16days on market $169,900 Active 74 DOM
-
2026-06-15days on market $169,900 Active 73 DOM
-
2026-06-13days on market $169,900 Active 71 DOM
-
2026-06-12pricedays on market $169,900 Active 70 DOM
-
2026-06-09days on market $179,900 Active 67 DOM
-
2026-06-08days on market $179,900 Active 66 DOM
-
2026-06-08days on market $179,900 Active 65 DOM
-
2026-06-07pricedays on market $179,900 Active 64 DOM
-
2026-06-04days on market $184,900 Active 61 DOM
-
2026-06-02days on market $184,900 Active 60 DOM
-
2026-06-01days on market $184,900 Active 59 DOM
-
2026-05-31days on market $184,900 Active 58 DOM
-
2026-05-13price $184,900
-
2026-04-03$194,900 Active
-
2019-11-14soldstatus $62,000
-
1994-01-13soldstatus $40,000
-
1994-01-13soldstatus $40,000
ⓘ Source: listings_history table (triggers on properties + properties_extension) + one-shot
backfill from property_details.listing_events for pre-trigger history.
Tax reassessment forecast OH · Partial reset (capped growth)
- Current annual tax
- $2,581 · $215/mo
- Projected year-2 tax
- $2,616 · $218/mo
- Expected delta
- +$35/yr (+$3/mo · 1.3%)
ⓘ Screening estimate from a state-policy table — verify with the county assessor before closing.
Climate risk First Street
- Flood 1/10 Low FEMA zone X (unshaded) · 0% chance over 30 yrs
- Wildfire 1/10 Low
- Heat 4/10 Moderate 7 d/yr ≥103°F today · 19 d/yr by 30 yrs out
- Wind 2/10 Low 100% chance of damaging wind over 30 yrs
- Air quality 4/10 Moderate 4 unhealthy d/yr today · 6 by 30 yrs out
Nearby sold comps map
Loading sold comps map…
Walkable amenities ~0.75 mi
Loading nearby amenities…
Taxation est. · year 1
- Rental income
- $20,509
- − Mortgage interest
- −$9,517
- − Property taxes
- −$2,581
- − Insurance
- −$850
- − Repairs & maintenance
- −$1,641
- − Management
- −$1,641
- − Depreciation
- −$4,943
- Taxable loss
- −$663
- Est. tax savings @ 24.0%
- +$159
- After-tax cash flow
- $2,239/yr
For passive investors: Depreciation is non-cash, so a rental often shows a tax loss while cash-flowing — sheltering income. Rental losses are passive: they offset passive income freely, and up to $25,000/yr can offset ordinary (W-2) income if you actively participate and your MAGI is under $100k (phasing out to $0 by $150k); unused losses carry forward. On sale, claimed depreciation is recaptured at up to 25%, and gains may owe capital-gains tax (a 1031 exchange can defer both). Figures are a year-1 estimate at your 24.0% rate — not tax advice; consult a CPA.
Schools (NCES district)
- District
- Northwest Local
- NCES district ID
- 3904736
- Math proficiency
- 38% ▼ -18.00%
- Reading proficiency
- 46% ▼ -10.00%
- Median HH income
- $58,765
- Composite
- 36.97/100
- National rank
- #4528
- State rank
- #508 of 656 in OH
Livability — Northgate
- Score
- 84/100
- State rank
- #55
- US rank
- #761
Category grades
Schools grade is shown separately in the Schools card above.
Census & demographics
- Census place
- Northgate, OH
- County
- Hamilton County · 701,295 people
- Metro
- Cincinnati, OH-KY-IN
- Population (ZIP)
- 20,254
- Household income
- $74,614
- Rent vs Own
- Severe rent burden
- 442.0
Population outlook (Hamilton County) Hauer SSP2
- Today (2025)
- 826,054 people
- By 2030
- 830,947 · +0.6%
- By 2040
- 832,319 · +0.8%
- By 2050
- 822,428 · -0.4%
- By 2075
- 788,688 · -4.5%
- By 2100
- 710,674 · -14.0%
Race, ethnicity, and origin ACS 2023
- Neighborhood character
- Diverse neighborhood (Simpson 0.57)
- Race & ethnicity
- White 56% Black 34% Two or more races 6% Hispanic / Latino 3% Asian 2%
- Common ancestry
- Iranian 1% Italian 1% Lithuanian 1%
- Foreign-born
- 4% · Canada, China
- Languages at home
- 94% English-only · Spanish 2% Other Asian/Pacific 1% Chinese 1%
Political lean MEDSL · Hamilton
- 2024 margin
- D (+14.9) · D 57.0% · R 42.1%
- 2008→2024 swing
- +7.9pp toward D · 2008: 7.0pp · 2024: 14.9pp
- All cycles
- 2024: D+14.9 2020: D+15.9 2016: D+9.5 2012: D+4.9 2008: D+7.0
Not yet ingested
- Civics
- —
Market trends
- HPI YoY
- ▼ -222.27%
- Current HPI
- 232.8505
- Rent YoY
- —
- Metro
- Cincinnati, OH-KY-IN
- State GDP YoY
- ▲ 1.98%
- F500 in state
- 48
Industry mix (Fortune 500 HQ in OH)
| Industry | F500 HQs | Revenue |
|---|---|---|
| Insurance | 3 | $145B |
|
||
| Industrial Machinery | 3 | $49B |
|
||
| Financial Services | 3 | $24B |
|
||
| Consumer Goods | 2 | $93B |
|
||
| Aerospace / Defense | 2 | $47B |
|
||
| Utilities | 2 | $33B |
|
||
Price history
+362.2% since first listed5 events — show timeline
- 2026-05-13 Price Changed $184,900 Cincy MLS
- 2026-04-03 Listed $194,900 Cincy MLS
- 2019-11-14 Sold (Public Records) $62,000 Public Records
- 1994-01-13 Sold (Public Records) $40,000 Public Records
- 1994-01-13 Sold (Public Records) $40,000 Public Records
Property tax history
+3.0%/yrLatest (2025): $2,581 · +5.0% YoY. Source: county tax records.
Cash-flow waterfall
monthlySold comps — $/sqft
last 12 mo · ≤1 miLoading sold comps…