121 Welborn Cir · Easley, SC
Flood risk 1/10 · Minimal
- FEMA flood zone
- X (unshaded)
- Chance of flooding over 30 yrs
- 0.0%
- Est. flood insurance / yr
- $507 – $1,088
Fire risk 4/10 · Minor
- Est. fire insurance / yr
- $783 – $1,453
Heat risk 5/10 · Moderate
- Hot days now (above 105°F)
- 7 days/yr
- Hot days in 30 yrs
- 16 days/yr
Wind risk 2/10 · Minimal
- Chance of severe wind over 30 yrs
- 0.0%
Air-quality risk 4/10 · Minor
- Unhealthy air days now
- 3 days/yr
- Unhealthy air days in 30 yrs
- 4 days/yr
Risk factors via First Street. Map © Google.
Why this score? — see what drove the C grade
The composite is a weighted blend of 9 inputs, each scored 0–100. Each bar is that input's sub-score; the figure is the points it added to the 100-point composite (weight × sub-score).
- Cash flow +22.0/30.0
- ARV discount +7.5/15.0
- DSCR +7.0/10.0
- 1% rule +4.9/10.0
- Schools +3.9/10.0
- Rent growth +3.8/5.0
- Livability +3.6/5.0
- Condition / age +2.5/5.0
- Appreciation +0.0/10.0
$144,900
🖨 Deal sheet 📄 Offer letter ✓ Due diligence
Listing remarks
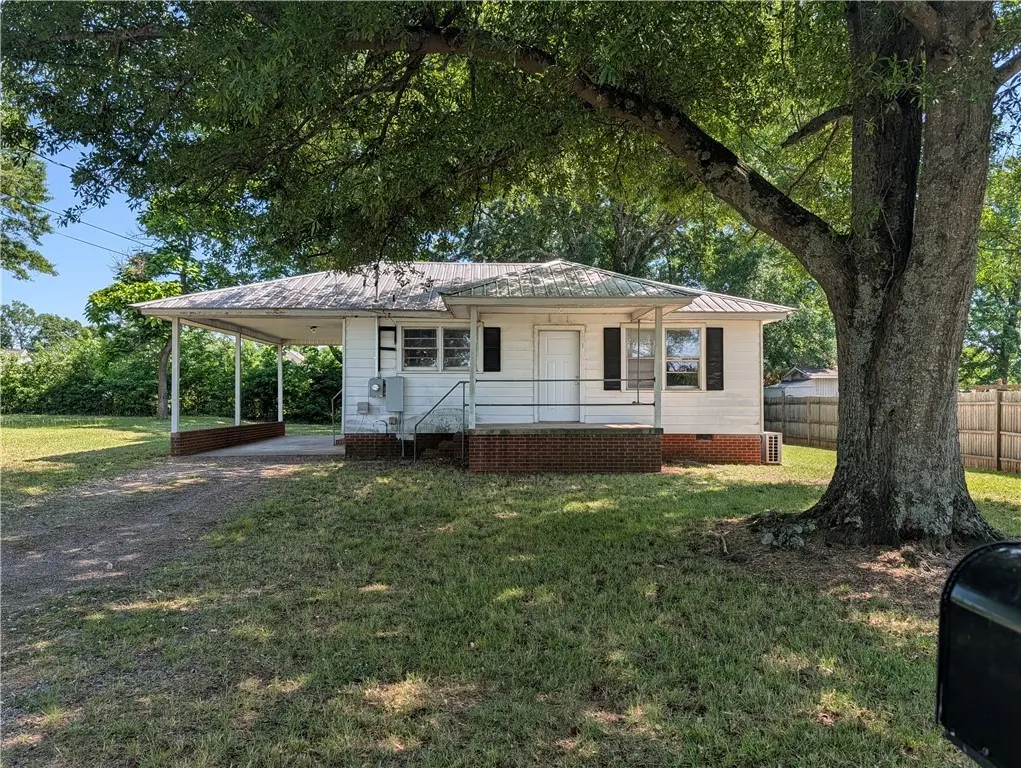
Charming Fixer-Upper with Lots of Potential: Nestled under canopy of a large, mature oak trees, this bungalow offers the perfect blend of small-town charm and a blank canvas for your own creative vision. The exterior features a durable metal roof and integrated carport that provides shaded parking or a protected space for outdoor projects. Highlights of the Home include hardwood flooring runs throughout the main living area and bedrooms, waiting to be buffed into a beautiful high-gloss finish. The bath was recently updated with white shower surround and a sleek gray vanity, giving you a functional head start on your renovations. Perfect for the DIY project or as an investment opportunity. H
Key facts
- Hardwood flooring
- Mature oak trees
- Metal roof
Tags
Property features AI
Exterior
- Parking: Attached carport; 1-car garage
- Utilities: Public sewer; Water available; Sewer available
- Home design: Single-story home; Aluminum siding; Built over 50 years ago; Entry level: main
- Construction: Aluminum siding construction; Crawlspace foundation; Built over 50 years ago
- Exterior features: City lot; Not in a subdivision; Crawlspace foundation
Interior
- Kitchen: Kitchen on main level
- Bedrooms: 2 main-level bedrooms
- Bathrooms: 1 full bathroom (main level)
- Heating & cooling: Heating: see remarks
- Interior features: Ceiling fan(s)
Neighborhood map
What this means for you Summary
Snapshot
- This is a 2-bed/1.0-bath single-family listed at $145k.
Deal economics
- At list price, monthly cash flow is $231 ($3k/yr) — positive.
- The deal already cash-flows at list — no discount required.
- To meet the 1% rule (rent ≥ 1% of price), the offer needs to be $144k (0.5% below list).
- Recommended offer: $141k (3.0% below list) — sets the bar for market timing.
- Cap rate 8.2% vs local median 4.0% in Easley — top-decile yield for the area; either an underpriced asset or a hidden risk that comps aren't pricing in. Stress-test before assuming the spread holds.
Location & tenants
- Location reads 71/100 on livability (#47 in SC) — a middle-class / working-renter tenant base. Strengths: cost of living A+, housing A+; Watch: schools D+, amenities D, commute F.
- Pickens 01 (rural): math 42% / reading 50% proficiency, ranked #21 of 80 in SC (top 26%) — families likely to look elsewhere, expect single-tenant / working-renter base with shorter leases.
- Market conditions: Rents rising fast (+5.3%/yr); 315 active listings in the ZIP; 13 comparable units currently listed for rent nearby; rentals at typical pace (median 24d on market — plan ~3-4 weeks tenant-placement turnaround); solid renter incomes; 1,440 units permitted in Pickens County in 2024 (245 in 5+ unit buildings).
Forward outlook
- Local home prices are declining (-3.0%/yr); year-one equity from $1k of loan paydown is wiped out by about $4k of value loss. Plan a longer hold.
- Pickens County population projected at +6% by 2050 — modest demand growth; plan on rents tracking national, not racing it.
Negotiation context
- It's been on market 35 days — a 3% lower offer ($141k) is reasonable based on typical stale-listing flexibility.
Risks & watch-outs
- Climate carrying-cost: extreme-heat days projected 7→16/yr by 2055 (HVAC capex compounding) — expect insurance premiums to compound above CPI over the hold.
Questions for the listing agent
- It's been on market 35 days. Have you received any prior offers? Is the seller open to a 3% concession, seller financing, or rate buy-down credit?
- Built in 1966 — when were the roof, HVAC, electrical panel, plumbing, and water heater last replaced?
- Is there a deadline driving the sale (1031 exchange, divorce, estate, relocation)? That informs how much negotiation room exists.
- Schools are D-rated, which usually means shorter tenancies and higher turnover. Who's the typical renter profile here, and what's been the actual vacancy rate?
- What's the average days-on-market for RENTAL listings here right now (not sales)? A rising rental-DOM trend means longer vacancies and softer asking-rent achievability than the comps imply.
- What's the recent tenant-quality profile in this submarket — average credit score on applications, eviction rate, late-payment / NSF rate, and stable-employment percentage? A property-management company in the area should have these aggregated.
- How much new for-sale + rental construction is in the pipeline within 1–3 miles? Heavy new supply typically softens prices + rents 12–24 months out; constrained supply supports both.
Investment metrics
- 1% rule
- 0.99% ✗
- Cap rate
- 8.21%
- Cash-on-cash
- 6.84%
- DSCR
- 1.30
- GRM
- 8.4
CMA / ARV
- ARV (on-the-fly)
- $95,940
- Comps found
- 8
Show comp detail 8 sales within ~0.75 mi
| Address | Dist | Beds/Ba | Sqft | Sold | Price | $/sf | Match |
|---|---|---|---|---|---|---|---|
| 119 Welborn Cir | 0.01mi | 2/1.0 | 788 (+1%) | 1mo | $96,668 | $123 | 97 |
| 113 Welborn Cir | 0.06mi | 2/1.0 | 788 (+1%) | 1mo | $96,668 | $123 | 95 |
| 111 Welborn Cir | 0.06mi | 2/1.0 | 788 (+1%) | 1mo | $96,668 | $123 | 95 |
| 109 Welborn Cir | 0.08mi | 2/1.0 | 788 (+1%) | 1mo | $96,668 | $123 | 94 |
| 107 Welborn Cir | 0.10mi | 2/1.0 | 788 (+1%) | 1mo | $96,668 | $123 | 93 |
| 115 Welborn Cir | 0.04mi | 3/1.0 (+1) | 788 (+1%) | 1mo | $96,668 | $123 | 91 |
| 114 Welborn Cir | 0.05mi | 2/1.0 | 884 (+13%) | 1mo | $178,000 | $201 | 75 |
| 702 W 5th Ave | 0.57mi | 2/1.0 | 834 (+7%) | 9mo | $199,000 | $239 | 55 |
Match score weights: distance 35% · size 25% · config 20% · recency 20%. Top-matched comps best support the ARV.
Projected returns pro-forma
-3.0% appreciation · 5.3% rent growth · sell at horizon
- IRR
- -3.4%
- Equity multiple
- 0.87×
- Total profit
- $-5,366
- Equity at exit
- $21,605
- IRR
- 8.5%
- Equity multiple
- 1.71×
- Total profit
- $28,836
- Equity at exit
- $12,528
Cash invested: $40,572 (down + closing). Projections, not guarantees.
Landlord ↔ Tenant lean methodology
- Overall (STATE)
- 90 Strongly Landlord-Friendly
- State South Carolina
- 90 Strongly Landlord-Friendly · R+6
- County
- — inherits STATE
- City
- — inherits STATE
ZIP-level market 29642
- Home prices YoY
- -31.6%
- Rents YoY
- 5.3%
- Active inventory
- 315
- Price-to-rent
- 8.4×
Monthly cashflow live
- Estimated rent
- $1,441 high interval (Pro) →
- Mortgage (P&I)
- −$760
- Tax from tax record
- −$87 /mo · $1,045/yr
- Insurance
- −$60
- HOA
- −$0
- Vacancy / Maint / Mgmt
- −$303
- Net cashflow
- $231
Break-even live
UW: 25.0% down · 7.5% · 30yr · 1.5% tax · 5.0% vac · 8.0% maint · 8.0% mgmt
Financing live
Cash to close
- Down payment
- $36,225
- Closing costs
- $4,347
- Reserves months
- —
- Total cash needed
- —
Loan-product check · same deal, 3 products live
Conventional
25% down · 7.5% · 30yr
- Down + closing
- —
- Monthly P&I
- —
- Monthly cashflow
- —
- DSCR
- —
- Eligible?
- —
Personal DTI + credit; lowest rate.
DSCR
20% down · 8.5% · 30yr
- Down + closing
- —
- Monthly P&I
- —
- Monthly cashflow
- —
- DSCR
- —
- Eligible?
- —
No personal income docs; deal must DSCR.
Hard money
10% down · 12.0% · 12mo
- Down + closing
- —
- Monthly P&I
- —
- Monthly cashflow
- —
- DSCR
- —
- Eligible?
- —
Short-term bridge; refi at stabilization.
Rent comps 13 comps
| Address | Beds | Baths | Sqft | Rent | $/sqft | DOM | Units | Dist |
|---|---|---|---|---|---|---|---|---|
| 113 S 7th St Easley, SC | 2.0 | 1.0 | 1116 | $1,000 | $0.90 | 3d | 1 | 0.42mi |
| 106 S 9th St Easley, SC | 2.0 | 2.5 | 1100 | $1,750 | $1.59 | 24d | 1 | 0.49mi |
| 202 Walnut Hill Dr Unit C Easley, SC | 2.0 | 2.0 | 900 | $1,200 | $1.33 | 24d | 1 | 0.49mi |
| 601 S 5th St Easley, SC | 1.0–2.0 | 1.0–2.0 | 1232 | $1,900 | $1.54 | 3d | 6 | 0.50mi |
| 120 Atlantic Ave Easley, SC | 2.0 | 1.0 | 800 | $1,100 | $1.38 | 3d | 1 | 0.58mi |
| 101 Pendleton Ct Unit A3 Easley, SC | 2.0 | 1.5 | 1024 | $1,250 | $1.22 | 24d | 1 | 0.69mi |
| 215 Walnut Hill Dr Unit B Easley, SC | 2.0 | 2.0 | 900 | $1,200 | $1.33 | 24d | 1 | 0.74mi |
| 200 Walnut Hill Dr Unit B Easley, SC | 2.0 | 2.0 | 900 | $1,200 | $1.33 | 24d | 1 | 0.75mi |
| 110 Pearson Terrace Dr Easley, SC | 1.0–3.0 | 1.0–2.0 | 1053 | $1,090 | $1.04 | 3d | 1 | 0.79mi |
| 100 Pebble Brook Ct Easley, SC | 2.0–3.0 | 2.0 | 999 | $1,235 | $1.24 | 3d | 1 | 0.86mi |
| 102 Russell St #101 Easley, SC | 2.0 | 2.0 | 1050 | $1,299 | $1.24 | 24d | 1 | 0.99mi |
| 209 Springfield Cir Unit A Easley, SC | 3.0 | 2.0 | 1100 | $1,475 | $1.34 | 24d | 1 | 1.21mi |
| 300 Duvall St Easley, SC | 2.0–3.0 | 1.0–2.0 | 1089 | $1,368 | $1.26 | 24d | 1 | 1.22mi |
Listing history 16 events
-
2026-06-18days on market $144,900 Active 35 DOM
-
2026-06-17days on market $144,900 Active 34 DOM
-
2026-06-16days on market $144,900 Active 33 DOM
-
2026-06-15days on market $144,900 Active 32 DOM
-
2026-06-13days on market $144,900 Active 30 DOM
-
2026-06-10days on market $144,900 Active 27 DOM
-
2026-06-09days on market $144,900 Active 26 DOM
-
2026-06-08days on market $144,900 Active 25 DOM
-
2026-06-07pricedays on market $144,900 Active 24 DOM
-
2026-06-05days on market $149,900 Active 21 DOM
-
2026-06-03days on market $149,900 Active 20 DOM
-
2026-06-03days on market $149,900 Active 19 DOM
-
2026-06-01days on market $149,900 Active 18 DOM
-
2026-05-31days on market $149,900 Active 17 DOM
-
2026-05-14$149,900 Active
-
2000-03-22soldstatus $175,000
ⓘ Source: listings_history table (triggers on properties + properties_extension) + one-shot
backfill from property_details.listing_events for pre-trigger history.
Tax reassessment forecast SC · Resets to sale price
- Current annual tax
- $1,045 · $87/mo
- Projected year-2 tax
- $1,045 · $87/mo
- Expected delta
- $0/yr ($0/mo · 0.0%)
ⓘ Screening estimate from a state-policy table — verify with the county assessor before closing.
Climate risk First Street
- Flood 1/10 Low FEMA zone X (unshaded) · 0% chance over 30 yrs
- Wildfire 4/10 Moderate
- Heat 5/10 Major 7 d/yr ≥105°F today · 16 d/yr by 30 yrs out
- Wind 2/10 Low 0% chance of damaging wind over 30 yrs
- Air quality 4/10 Moderate 3 unhealthy d/yr today · 4 by 30 yrs out
Nearby sold comps map
Loading sold comps map…
Walkable amenities ~0.75 mi
Loading nearby amenities…
Taxation est. · year 1
- Rental income
- $17,297
- − Mortgage interest
- −$8,117
- − Property taxes
- −$1,045
- − Insurance
- −$724
- − Repairs & maintenance
- −$1,384
- − Management
- −$1,384
- − Depreciation
- −$4,215
- Taxable income
- $428
- Est. tax owed @ 24.0%
- −$103
- After-tax cash flow
- $2,674/yr
For passive investors: Depreciation is non-cash, so a rental often shows a tax loss while cash-flowing — sheltering income. Rental losses are passive: they offset passive income freely, and up to $25,000/yr can offset ordinary (W-2) income if you actively participate and your MAGI is under $100k (phasing out to $0 by $150k); unused losses carry forward. On sale, claimed depreciation is recaptured at up to 25%, and gains may owe capital-gains tax (a 1031 exchange can defer both). Figures are a year-1 estimate at your 24.0% rate — not tax advice; consult a CPA.
Schools (NCES district)
- District
- Pickens 01
- NCES district ID
- 4503330
- Math proficiency
- 42% ▼ -11.00%
- Reading proficiency
- 50% ▼ -2.00%
- Median HH income
- $42,534
- Composite
- 38.73/100
- National rank
- #4130
- State rank
- #21 of 80 in SC
Livability — Easley
- Score
- 71/100
- State rank
- #47
- US rank
- #6783
Category grades
Schools grade is shown separately in the Schools card above.
Census & demographics
- Census place
- Easley, SC
- County
- Pickens County · 102,825 people
- City population
- 69,994
- Metro
- Greenville-Anderson, SC
- Population (ZIP)
- 36,852
- Household income
- $78,221
- Rent vs Own
- Severe rent burden
- 915.0
Population outlook (Pickens County) Hauer SSP2
- Today (2025)
- 126,530 people
- By 2030
- 128,780 · +1.8%
- By 2040
- 132,151 · +4.4%
- By 2050
- 133,800 · +5.7%
- By 2075
- 137,594 · +8.7%
- By 2100
- 139,784 · +10.5%
Race, ethnicity, and origin ACS 2023
- Neighborhood character
- Predominantly White (82%)
- Race & ethnicity
- White 82% Black 7% Two or more races 7% Hispanic / Latino 6%
- Hispanic origin (detail)
- Mexican 2%
- Common ancestry
- Slovak 4% Serbian 3% Italian 2%
- Foreign-born
- 4% · Canada, Jamaica
- Languages at home
- 95% English-only · Spanish 3% Other Indo-European 1%
Political lean MEDSL · Pickens
- 2024 margin
- Solid R (+52.7) · D 23.0% · R 75.6% · Other 1.4%
- 2008→2024 swing
- -6.4pp toward R · 2008: -46.2pp · 2024: -52.7pp
- All cycles
- 2024: R+52.7 2020: R+50.9 2016: R+52.7 2012: R+49.0 2008: R+46.2
Not yet ingested
- Civics
- —
Market trends
- HPI YoY
- ▼ -103.03%
- Current HPI
- 222.4976
- Rent YoY
- ▲ 5.30%
- Metro
- Greenville-Anderson, SC
- State GDP YoY
- ▲ 4.51%
- F500 in state
- 2
Industry mix (Fortune 500 HQ in SC)
| Industry | F500 HQs | Revenue |
|---|---|---|
| Packaging | 1 | $7B |
|
||
Price history
-14.3% since first listed2 events — show timeline
- 2026-05-14 Listed $149,900 WUMLS
- 2000-03-22 Sold (Public Records) $175,000 Public Records
Property tax history
+4.0%/yrLatest (2025): $1,045 · +39.4% YoY. Source: county tax records.
Cash-flow waterfall
monthlySold comps — $/sqft
last 12 mo · ≤1 miLoading sold comps…