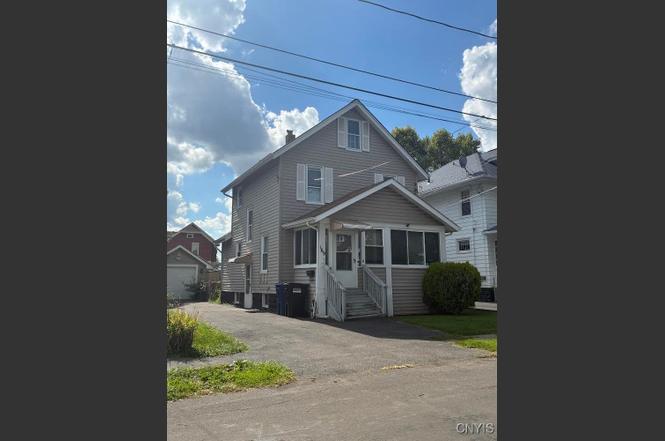
169 Martin St · Syracuse, NY
Flood risk 1/10 · Minimal
- FEMA flood zone
- X (unshaded)
- Chance of flooding over 30 yrs
- 0.0%
- Est. flood insurance / yr
- $473 – $860
Fire risk 1/10 · Minimal
- Est. fire insurance / yr
- $691 – $1,283
Heat risk 3/10 · Minor
- Hot days now (above 95°F)
- 7 days/yr
- Hot days in 30 yrs
- 16 days/yr
Wind risk 1/10 · Minimal
- Chance of severe wind over 30 yrs
- 0.0%
Air-quality risk 2/10 · Minimal
- Unhealthy air days now
- 0 days/yr
- Unhealthy air days in 30 yrs
- 1 days/yr
Risk factors via First Street. Map © Google.
Why this score? — see what drove the C+ grade
The composite is a weighted blend of 9 inputs, each scored 0–100. Each bar is that input's sub-score; the figure is the points it added to the 100-point composite (weight × sub-score).
- Cash flow +23.9/30.0
- Appreciation +10.0/10.0
- DSCR +7.7/10.0
- ARV discount +6.0/15.0
- 1% rule +5.1/10.0
- Livability +3.9/5.0
- Rent growth +2.5/5.0
- Condition / age +2.5/5.0
- Schools +1.8/10.0
$149,900
🖨 Deal sheet (PDF) 📄 Offer letter ✓ Due diligence
Listing remarks
Charming 3-bedroom, 1-bath, two-story home featuring a spacious layout with some tasteful updates inside. The property offers a 1-car garage for convenient parking or storage, and a fully fenced backyard that’s perfect for outdoor gatherings, pets, or gardening. With its classic two-story design and cozy living spaces, this home combines comfort and functionality, making it a great option for anyone looking for a property to make it their own.
Key facts
- 1 car garage
- 5,016 sq ft lot
- Garage
Tags
Neighborhood map
What this means for you Summary
Snapshot
- This is a 3-bed/1.0-bath single-family listed at $150k.
Deal economics
- At list price, monthly cash flow is $292 ($4k/yr) — positive.
- The deal already cash-flows at list — no discount required.
- Meets the 1% rule at list price ($2k rent vs $150k).
- Recommended offer: $148k (1.5% below list) — sets the bar for market timing.
Location & tenants
- Location reads 77/100 on livability (#187 in NY, #2,869 nationally) — a middle-class / working-renter tenant base. Strengths: amenities A+, commute A+, cost of living A+; Watch: schools D+, crime F, employment D-.
- Syracuse City School District (urban): math 18% / reading 26% proficiency, ranked #590 of 590 in NY (top 100%) — low school quality limits family demand, transient renter base, plan for 1-2y turnover; 74% free/reduced lunch — lower-income household profile, screen leases tightly.
- Market conditions: 100 active listings in the ZIP; 21 comparable units currently listed for rent nearby; rentals lingering (median 45d on market — plan ~5-8 weeks vacancy on turnover, expect pricing pressure); 71% of comp listings sitting > 30 days — soft ceiling on asking rent; lower-income renter base — watch delinquency; 616 units permitted in Onondaga County in 2024 (256 in 5+ unit buildings).
- This rent runs 41% of the median local income ($45k/yr) — at the standard rent-burdened threshold; future hikes will face affordability resistance.
Forward outlook
- In year one you build about $16k of equity ($1k loan paydown + $15k appreciation (10.0% local appreciation)).
- Onondaga County population projected to shrink 9% by 2050 — rents likely to lag national; underwrite the cash flow, not the appreciation.
- At projected returns (10.0% appreciation + 3.0% rent growth), your $42k cash investment doubles in ~3 years — after that, you're playing with house money.
- By year 3, paydown + projected appreciation supports a ~$41k cash-out refi (75% LTV) — recoverable capital for the next deal without selling this one.
Negotiation context
- It's been on market 27 days — a 2% lower offer ($148k) is reasonable based on typical stale-listing flexibility.
Risks & watch-outs
- Watch-outs: built in 1950 — expect roof / HVAC / electrical / plumbing capex.
Questions for the listing agent
- Built in 1950 — when were the roof, HVAC, electrical panel, plumbing, and water heater last replaced?
- Is there a deadline driving the sale (1031 exchange, divorce, estate, relocation)? That informs how much negotiation room exists.
- Schools are D-rated, which usually means shorter tenancies and higher turnover. Who's the typical renter profile here, and what's been the actual vacancy rate?
- Crime grade is F in this area — have there been break-ins, vandalism, or insurance claims at this property in the last 3 years? What carrier currently insures it and at what premium?
- What's the average days-on-market for RENTAL listings here right now (not sales)? A rising rental-DOM trend means longer vacancies and softer asking-rent achievability than the comps imply.
- What's the recent tenant-quality profile in this submarket — average credit score on applications, eviction rate, late-payment / NSF rate, and stable-employment percentage? A property-management company in the area should have these aggregated.
- How much new for-sale + rental construction is in the pipeline within 1–3 miles? Heavy new supply typically softens prices + rents 12–24 months out; constrained supply supports both.
Investment metrics
- 1% rule
- 1.01% ✓
- Cap rate
- 8.63%
- Cash-on-cash
- 8.35%
- DSCR
- 1.37
- GRM
- 8.3
CMA / ARV
- ARV (on-the-fly)
- $144,948
- Comps found
- 12
Show comp detail 12 sales within ~0.75 mi
| Address | Dist | Beds/Ba | Sqft | Sold | Price | $/sf | Match |
|---|---|---|---|---|---|---|---|
| 307 Malverne Dr | 0.22mi | 2/1.0 (-1) | 1,056 (+3%) | 4mo | $170,000 | $161 | 77 |
| 232 Malverne Dr | 0.26mi | 3/1.5 | 1,142 (+11%) | 1mo | $224,900 | $197 | 67 |
| 164 Berkshire Ave | 0.52mi | 3/1.0 | 1,073 (+4%) | 2mo | $116,900 | $109 | 67 |
| 211 Merrill St | 0.25mi | 2/1.0 (-1) | 1,125 (+9%) | 3mo | $180,000 | $160 | 65 |
| 1108 Wadsworth St | 0.29mi | 3/1.0 | 1,168 (+14%) | 2mo | $165,000 | $141 | 63 |
| 119 Lawrence St | 0.70mi | 3/1.0 | 1,008 (-2%) | 3mo | $130,000 | $129 | 62 |
| 113 Bellshire Ln | 0.21mi | 4/2.0 (+1) | 924 (-10%) | 3mo | $179,000 | $194 | 61 |
| 497 Pleasantview Ave | 0.73mi | 3/1.5 | 1,056 (+3%) | 1mo | $189,900 | $180 | 59 |
| 819 Lemoyne Ave | 0.55mi | 2/1.5 (-1) | 986 (-4%) | 2mo | $125,000 | $127 | 58 |
| 3137 Grant Blvd | 0.63mi | 4/1.0 (+1) | 996 (-3%) | 2mo | $104,500 | $105 | 58 |
| 126 Delong Ave | 0.54mi | 2/1.0 (-1) | 912 (-11%) | 3mo | $90,000 | $99 | 49 |
| 1212 Spring St | 0.68mi | 4/1.5 (+1) | 1,115 (+8%) | 4mo | $71,000 | $64 | 44 |
Match score weights: distance 35% · size 25% · config 20% · recency 20%. Top-matched comps best support the ARV.
Projected returns pro-forma
10.0% appreciation · 3.0% rent growth · sell at horizon
- IRR
- 30.3%
- Equity multiple
- 3.39×
- Total profit
- $100,176
- Equity at exit
- $135,042
- IRR
- 26.3%
- Equity multiple
- 7.68×
- Total profit
- $280,264
- Equity at exit
- $291,223
Cash invested: $41,972 (down + closing). Projections, not guarantees.
Landlord ↔ Tenant lean methodology
- Overall (STATE)
- 15 Strongly Tenant-Friendly
- State New York
- 15 Strongly Tenant-Friendly · D+10
- County
- — inherits STATE
- City
- — inherits STATE
ZIP-level market 13208
- Home prices YoY
- 8.4%
- Active inventory
- 100
- Price-to-rent
- 8.3×
Monthly cashflow live
- Estimated rent
- $1,514 high interval (Pro) →
- Mortgage (P&I)
- −$786
- Tax from tax record
- −$55 /mo · $666/yr
- Insurance
- −$62
- HOA
- −$0
- Vacancy / Maint / Mgmt
- −$318
- Net cashflow
- $292
Break-even live
Sensitivity live
| Price | -10% $377 | -5% $334 | +0% $292 | +5% $250 | +10% $207 |
|---|---|---|---|---|---|
| Rent | -10% $172 | -5% $232 | +0% $292 | +5% $352 | +10% $412 |
| Rate | -1.0pp $367 | -0.5pp $330 | base $292 | +0.5pp $253 | +1.0pp $214 |
UW: 25.0% down · 7.5% · 30yr · 1.5% tax · 5.0% vac · 8.0% maint · 8.0% mgmt
Financing live
Cash to close
- Down payment
- $37,475
- Closing costs
- $4,497
- Reserves months
- —
- Total cash needed
- —
Loan-product check · same deal, 3 products live
Conventional
25% down · 7.5% · 30yr
- Down + closing
- —
- Monthly P&I
- —
- Monthly cashflow
- —
- DSCR
- —
- Eligible?
- —
Personal DTI + credit; lowest rate.
DSCR
20% down · 8.5% · 30yr
- Down + closing
- —
- Monthly P&I
- —
- Monthly cashflow
- —
- DSCR
- —
- Eligible?
- —
No personal income docs; deal must DSCR.
Hard money
10% down · 12.0% · 12mo
- Down + closing
- —
- Monthly P&I
- —
- Monthly cashflow
- —
- DSCR
- —
- Eligible?
- —
Short-term bridge; refi at stabilization.
Rent comps 21 comps
| Address | Beds | Baths | Sqft | Rent | $/sqft | DOM | Units | Dist |
|---|---|---|---|---|---|---|---|---|
| 286 Ross Park Syracuse, NY | 3.0 | 1.0 | 1100 | $1,500 | $1.36 | 45d | 1 | 0.15mi |
| 1140 Wolf St Apt 3 Syracuse, NY | 2.0 | 1.0 | 800 | $1,200 | $1.50 | 44d | 1 | 0.39mi |
| 1132 Wolf St Unit 4 Syracuse, NY | 3.0 | 1.0 | 1041 | $1,350 | $1.30 | 44d | 1 | 0.40mi |
| 126 Woodruff Ave Syracuse, NY | 3.0 | 1.0 | 1200 | $1,675 | $1.40 | 44d | 1 | 0.89mi |
| 106 Harrington St Syracuse, NY | 3.0 | 1.0 | 1168 | $1,875 | $1.61 | 44d | 1 | 0.96mi |
| 912 Park St Unit 1 Syracuse, NY | 3.0 | 1.0 | 1040 | $1,200 | $1.15 | 44d | 1 | 1.00mi |
| 1507 N Salina St Unit 3 Syracuse, NY | 3.0 | 2.0 | 1030 | $1,350 | $1.31 | 44d | 1 | 1.00mi |
| 423 Wendell Ter Syracuse, NY | 4.0 | 1.0 | 1312 | $2,500 | $1.91 | 14d | 1 | 1.13mi |
| 610 E Division St Unit F2 Syracuse, NY | 2.0 | 1.0 | 900 | $1,150 | $1.28 | 44d | 1 | 1.16mi |
| 2802 Lemoyne Ave Unit 1 Syracuse, NY | 3.0 | 1.0 | 988 | $1,700 | $1.72 | 14d | 1 | 1.21mi |
| 807-13 N Salina St Unit 809A Syracuse, NY | 2.0 | 1.0 | 1020 | $1,325 | $1.30 | 44d | 1 | 1.21mi |
| 746 E Laurel St Unit 1 Syracuse, NY | 4.0 | 2.0 | 1400 | $1,500 | $1.07 | 44d | 1 | 1.27mi |
| 746 E Laurel St Unit 2F Syracuse, NY | 2.0 | 1.0 | 800 | $1,100 | $1.38 | 44d | 1 | 1.27mi |
| 205 Beecher St Unit 3 Syracuse, NY | 2.0 | 1.0 | 815 | $1,100 | $1.35 | 44d | 1 | 1.32mi |
| 100 Buckley Rd Liverpool, NY | 1.0–2.0 | 1.0–2.0 | 985 | $3,850 | $3.91 | 14d | 1 | 1.35mi |
| 212 Dorchester Ave Syracuse, NY | 1.0–2.0 | 1.0 | 640 | $1,420 | $2.22 | 14d | 15 | 1.38mi |
| 721 N Clinton St Unit 105 Syracuse, NY | 2.0 | 2.0 | 1000 | $1,475 | $1.48 | 44d | 1 | 1.38mi |
| 721 N Clinton St Unit 213 Syracuse, NY | 2.0 | 2.0 | 1000 | $1,550 | $1.55 | 44d | 1 | 1.38mi |
| 210 W Division St Unit 24 Syracuse, NY | 2.0 | 2.0 | 1200 | $1,850 | $1.54 | 22d | 1 | 1.41mi |
| 210 W Division St Unit 87 Syracuse, NY | 2.0 | 2.0 | 1200 | $1,750 | $1.46 | 44d | 1 | 1.43mi |
| 517 N Salina St Unit 4 Syracuse, NY | 2.0 | 1.0 | 700 | $1,050 | $1.50 | 14d | 1 | 1.45mi |
Listing history 4 events
-
2025-12-08soldstatus $149,900
-
2025-10-10status Pending
-
2025-09-19historical Active Under Contract
-
2025-09-13$149,900 Active
ⓘ Source: listings_history table (triggers on properties + properties_extension) + one-shot
backfill from property_details.listing_events for pre-trigger history.
Tax reassessment forecast NY · Partial reset (capped growth)
- Current annual tax
- $666 · $55/mo
- Projected year-2 tax
- $1,600 · $133/mo
- Expected delta
- +$934/yr (+$78/mo · 140.2%)
ⓘ Screening estimate from a state-policy table — verify with the county assessor before closing.
Climate risk First Street
- Flood 1/10 Low FEMA zone X (unshaded) · 0% chance over 30 yrs
- Wildfire 1/10 Low
- Heat 3/10 Moderate 7 d/yr ≥95°F today · 16 d/yr by 30 yrs out
- Wind 1/10 Low 0% chance of damaging wind over 30 yrs
- Air quality 2/10 Low 0 unhealthy d/yr today · 1 by 30 yrs out
Nearby sold comps map
Loading sold comps map…
Walkable amenities ~0.75 mi
Loading nearby amenities…
Taxation est. · year 1
- Rental income
- $18,167
- − Mortgage interest
- −$8,397
- − Property taxes
- −$666
- − Insurance
- −$750
- − Repairs & maintenance
- −$1,453
- − Management
- −$1,453
- − Depreciation
- −$4,361
- Taxable income
- $1,087
- Est. tax owed @ 24.0%
- −$261
- After-tax cash flow
- $3,242/yr
For passive investors: Depreciation is non-cash, so a rental often shows a tax loss while cash-flowing — sheltering income. Rental losses are passive: they offset passive income freely, and up to $25,000/yr can offset ordinary (W-2) income if you actively participate and your MAGI is under $100k (phasing out to $0 by $150k); unused losses carry forward. On sale, claimed depreciation is recaptured at up to 25%, and gains may owe capital-gains tax (a 1031 exchange can defer both). Figures are a year-1 estimate at your 24.0% rate — not tax advice; consult a CPA.
Schools (NCES district)
- District
- Syracuse City School District
- NCES district ID
- 3628590
- Math proficiency
- 18% ▼ -5.00%
- Reading proficiency
- 26% ▬ 0.00%
- Median HH income
- $32,097
- Composite
- 17.83/100
- National rank
- #9007
- State rank
- #590 of 590 in NY
Livability — Syracuse
- Score
- 77/100
- State rank
- #187
- US rank
- #2869
Category grades
Schools grade is shown separately in the Schools card above.
Census & demographics
- Census place
- Syracuse, NY
- County
- Onondaga County · 247,257 people
- City population
- 152,627
- Metro
- Syracuse, NY
- Population (ZIP)
- 22,993
- Household income
- $44,712
- Rent vs Own
- Severe rent burden
- 1437.0
Population outlook (Onondaga County) Hauer SSP2
- Today (2025)
- 467,894 people
- By 2030
- 463,381 · -1.0%
- By 2040
- 447,697 · -4.3%
- By 2050
- 426,399 · -8.9%
- By 2075
- 373,661 · -20.1%
- By 2100
- 307,967 · -34.2%
Race, ethnicity, and origin ACS 2023
- Neighborhood character
- Highly diverse neighborhood (Simpson 0.70)
- Race & ethnicity
- White 46% Black 24% Asian 14% Two or more races 10% Hispanic / Latino 6%
- Hispanic origin (detail)
- Puerto Rican 4% Dominican 1%
- Common ancestry
- Romanian 3% Swedish 3% Italian 1%
- Foreign-born
- 22% · Vietnam, Philippines, Canada
- Languages at home
- 70% English-only · Spanish 6% Other Asian/Pacific 5% Vietnamese 4%
Political lean MEDSL · Onondaga
- 2024 margin
- D (+17.3) · D 58.6% · R 41.4%
- 2008→2024 swing
- -3.0pp toward R · 2008: 20.3pp · 2024: 17.3pp
- All cycles
- 2024: D+17.3 2020: D+20.6 2016: D+12.8 2012: D+21.1 2008: D+20.3
Not yet ingested
- Civics
- —
Market trends
- HPI YoY
- ▲ 30.91%
- Current HPI
- 399.3284
- Rent YoY
- —
- Metro
- Syracuse, NY
- State GDP YoY
- ▲ 2.60%
- F500 in state
- 92
Industry mix (Fortune 500 HQ in NY)
| Industry | F500 HQs | Revenue |
|---|---|---|
| Financial Services | 10 | $950B |
|
||
| Consumer Goods | 9 | $162B |
|
||
| Insurance | 4 | $225B |
|
||
| Telecommunications | 2 | $144B |
|
||
| Pharmaceuticals | 2 | $112B |
|
||
| Media / Entertainment | 2 | $69B |
|
||
Price history
+0.0% since first listed4 events — show timeline
- 2025-12-08 Sold (Public Records) $149,900 Public Records
- 2025-10-10 Pending — CNYIS
- 2025-09-19 Contingent — CNYIS
- 2025-09-13 Listed $149,900 CNYIS
Property tax history
-0.9%/yrLatest (2025): $666 · +0.0% YoY. Source: county tax records.
Cash-flow waterfall
monthlySold comps — $/sqft
last 12 mo · ≤1 miLoading sold comps…