10351 Lejean Dr · Midwest City, OK
Flood risk 1/10 · Minimal
- FEMA flood zone
- X (unshaded)
- Chance of flooding over 30 yrs
- 0.0%
- Est. flood insurance / yr
- $507 – $1,088
Fire risk 1/10 · Minimal
- Est. fire insurance / yr
- $2,463 – $4,575
Heat risk 5/10 · Moderate
- Hot days now (above 107°F)
- 7 days/yr
- Hot days in 30 yrs
- 19 days/yr
Wind risk 3/10 · Minor
- Chance of severe wind over 30 yrs
- 5.0%
Air-quality risk 2/10 · Minimal
- Unhealthy air days now
- 1 days/yr
- Unhealthy air days in 30 yrs
- 2 days/yr
Risk factors via First Street. Map © Google.
Why this score? — see what drove the B grade
The composite is a weighted blend of 9 inputs, each scored 0–100. Each bar is that input's sub-score; the figure is the points it added to the 100-point composite (weight × sub-score).
- Cash flow +30.0/30.0
- ARV discount +15.0/15.0
- DSCR +10.0/10.0
- 1% rule +7.5/10.0
- Rent growth +3.9/5.0
- Livability +3.6/5.0
- Condition / age +2.5/5.0
- Schools +1.2/10.0
- Appreciation +0.0/10.0
$115,000
🖨 Deal sheet (PDF) 📄 Offer letter ✓ Due diligence
Listing remarks
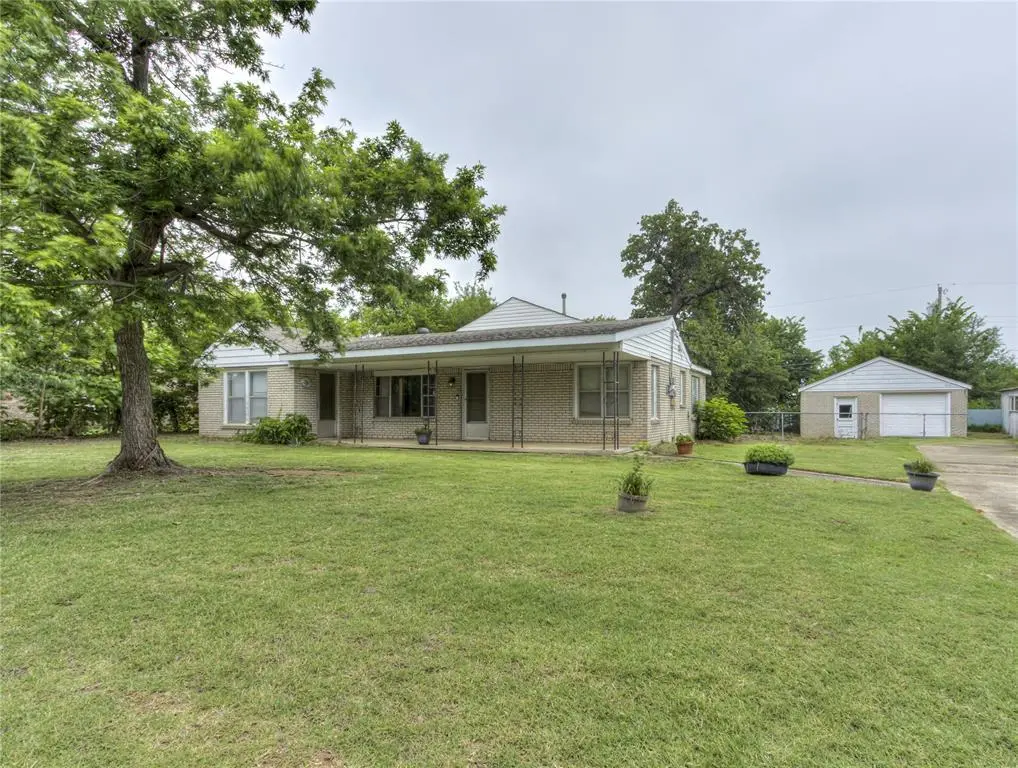
Investor opportunity in the Carl Albert School District! This 3 bed, 2 bath home (1,184 sq ft) sits on a . 32-acre lot in Midwest City and offers the kind of potential investors are always looking for. With a split floor plan, large windows, and a covered front porch, the home has a functional layout and a solid foundation for your next project. The spacious lot provides plenty of room to work with, whether you're planning improvements, adding value, or simply taking advantage of the extra outdoor space. Recent cleanup has helped showcase the property's potential and makes it easier to see the possibilities. Located in the Carl Albert School District with convenient access to Tinker AFB, s
Key facts
- Covered front porch
- Access to shopping
- Spacious lot
Tags
Property features AI
Finance
- Other: Court approval required for sale; Vacant and available; Living area recorded as 1,184 (assessor)
- Financial info: Loan qualification allowed; Not assumable
- HOA & community: No mandatory association dues
Exterior
- Parking: Concrete parking; 1-car garage
- Utilities: Electricity available; Natural gas available; Public utilities (water/sewer)
- Home design: Single family residence; One level; Faces south; Residential property, existing
- Construction: Brick and brick & frame construction; Shingle roof (roof replaced/installed in 2016); Conventional foundation
- Exterior features: Covered patio; Covered porch; Interior lot
Interior
- Kitchen: Free-standing electric range/oven
- Bedrooms: 3 bedrooms
- Flooring: Combination flooring; Carpet
- Bathrooms: 2 full bathrooms
- Heating & cooling: Zoned heating; Window unit(s) for cooling; Smoke alarm
- Interior features: Ceiling fan(s); In-law floor plan; Water heater
- Laundry & utility: Washer/dryer connections (utility not explicitly listed, water heater present)
Neighborhood map
What this means for you Summary
Snapshot
- This is a 3-bed/2.0-bath single-family listed at $115k.
Deal economics
- At list price, monthly cash flow is $459 ($6k/yr) — positive.
- The deal already cash-flows at list — no discount required.
- Meets the 1% rule at list price ($1k rent vs $115k).
- Cap rate 11.1% vs local median 5.6% in Midwest City — top-decile yield for the area; either an underpriced asset or a hidden risk that comps aren't pricing in. Stress-test before assuming the spread holds.
Location & tenants
- Location reads 71/100 on livability (#30 in OK) — a middle-class / working-renter tenant base. Strengths: cost of living A+, housing A+, health & safety A; Watch: crime D+, employment D, amenities F.
- Midwest City-Del City (suburban): math 10% / reading 17% proficiency, ranked #231 of 270 in OK (top 86%) — low school quality limits family demand, transient renter base, plan for 1-2y turnover.
- Zoned schools: Soldier Creek Es (math 17% / reading 20%, grade F, #530 of 845 statewide, top 63%, 910 students, 0% FRL); Carl Albert Hs (math 16% / reading 33%, grade F, #150 of 447 statewide, top 48%, 1,115 students, 0% FRL) — zoned schools average 0% FRL vs 57% district-wide (57 pts lower); this property's tenant base skews higher-income than the district average.
- Market conditions: Rents rising fast (+5.7%/yr); 167 active listings in the ZIP; 10 comparable units currently listed for rent nearby; rentals leasing fast (median 12d on market — plan ~1-2 weeks tenant-placement turnaround); 5,365 units permitted in Oklahoma County in 2024 (569 in 5+ unit buildings).
Forward outlook
- Local home prices are declining (-3.0%/yr); year-one equity from $795 of loan paydown is wiped out by about $3k of value loss. Plan a longer hold.
- Oklahoma County population projected at +41% by 2050 — long-run rental-demand tailwind backs the buy-and-hold thesis.
- At projected returns (-3.0% appreciation + 5.7% rent growth), your $32k cash investment doubles in ~7 years — after that, you're playing with house money.
Negotiation context
- Only 6 days on market — expect competitive offers; lowballing is unlikely to land.
- 4 sale attempts with the ask held roughly flat each time — persistent listings suggest the price (not the market) is what's stuck; bring a comps-based counter.
Risks & watch-outs
- Watch-outs: built in 1950 — expect roof / HVAC / electrical / plumbing capex.
- Climate carrying-cost: extreme-heat days projected 7→19/yr by 2055 (HVAC capex compounding) — expect insurance premiums to compound above CPI over the hold.
Questions for the listing agent
- Built in 1950 — when were the roof, HVAC, electrical panel, plumbing, and water heater last replaced?
- Is there a deadline driving the sale (1031 exchange, divorce, estate, relocation)? That informs how much negotiation room exists.
- Schools are D-rated, which usually means shorter tenancies and higher turnover. Who's the typical renter profile here, and what's been the actual vacancy rate?
- Crime grade is D in this area — have there been break-ins, vandalism, or insurance claims at this property in the last 3 years? What carrier currently insures it and at what premium?
- What's the average days-on-market for RENTAL listings here right now (not sales)? A rising rental-DOM trend means longer vacancies and softer asking-rent achievability than the comps imply.
- What's the recent tenant-quality profile in this submarket — average credit score on applications, eviction rate, late-payment / NSF rate, and stable-employment percentage? A property-management company in the area should have these aggregated.
- How much new for-sale + rental construction is in the pipeline within 1–3 miles? Heavy new supply typically softens prices + rents 12–24 months out; constrained supply supports both.
Investment metrics
- 1% rule
- 1.25% ✓
- Cap rate
- 11.08%
- Cash-on-cash
- 17.10%
- DSCR
- 1.76
- GRM
- 6.7
CMA / ARV
- ARV (on-the-fly)
- $171,680
- Comps found
- 12
Show comp detail 12 sales within ~0.75 mi
| Address | Dist | Beds/Ba | Sqft | Sold | Price | $/sf | Match |
|---|---|---|---|---|---|---|---|
| 10344 Lejean Dr | 0.03mi | 3/1.0 | 1,113 (-6%) | 1mo | $62,000 | $56 | 84 |
| 10305 1/2 Saint Patrick Dr | 0.12mi | 3/2.0 | 1,304 (+10%) | 1mo | $245,000 | $188 | 76 |
| 10624 Bellview Dr | 0.28mi | 3/1.0 | 1,264 (+7%) | 0mo | $152,000 | $120 | 71 |
| 938 Travis Ct | 0.34mi | 3/2.0 | 1,298 (+10%) | 3mo | $180,000 | $139 | 66 |
| 10200 SE 14th St | 0.55mi | 3/1.5 | 1,187 (+0%) | 17mo | $230,000 | $194 | 58 |
| 10116 Oak Park Dr | 0.58mi | 3/2.0 | 1,280 (+8%) | 3mo | $190,000 | $148 | 57 |
| 10813 SE 9th St | 0.43mi | 2/1.0 (-1) | 1,103 (-7%) | 6mo | $165,000 | $150 | 54 |
| 10545 Kristie Ln | 0.27mi | 3/2.0 | 1,324 (+12%) | 18mo | $200,000 | $151 | 52 |
| 10329 E Reno Ave | 0.41mi | 2/1.0 (-1) | 1,058 (-11%) | 8mo | $120,000 | $113 | 47 |
| 617 S Saint Paul Ave | 0.67mi | 3/1.0 | 1,332 (+12%) | 2mo | $120,000 | $90 | 43 |
| 129 Oak Tree Dr | 0.72mi | 3/2.0 | 1,309 (+11%) | 7mo | $190,000 | $145 | 43 |
| 608 S Friendly Rd | 0.75mi | 3/2.0 | 1,353 (+14%) | 18mo | $159,900 | $118 | 26 |
Match score weights: distance 35% · size 25% · config 20% · recency 20%. Top-matched comps best support the ARV.
Projected returns pro-forma
-3.0% appreciation · 5.73% rent growth · sell at horizon
- IRR
- 11.1%
- Equity multiple
- 1.45×
- Total profit
- $14,592
- Equity at exit
- $17,147
- IRR
- 22.1%
- Equity multiple
- 3.10×
- Total profit
- $67,738
- Equity at exit
- $9,943
Cash invested: $32,200 (down + closing). Projections, not guarantees.
Landlord ↔ Tenant lean methodology
- Overall (STATE)
- 83 Strongly Landlord-Friendly
- State Oklahoma
- 83 Strongly Landlord-Friendly · R+20
- County
- — inherits STATE
- City
- — inherits STATE
ZIP-level market 73130
- Home prices YoY
- -21.0%
- Rents YoY
- 5.7%
- Active inventory
- 167
- Price-to-rent
- 6.7×
Monthly cashflow live
- Estimated rent
- $1,438 high interval (Pro) →
- Mortgage (P&I)
- −$603
- Tax from tax record
- −$26 /mo · $318/yr
- Insurance
- −$48
- HOA
- −$0
- Vacancy / Maint / Mgmt
- −$302
- Net cashflow
- $459
Break-even live
Sensitivity live
| Price | -10% $524 | -5% $491 | +0% $459 | +5% $426 | +10% $394 |
|---|---|---|---|---|---|
| Rent | -10% $345 | -5% $402 | +0% $459 | +5% $516 | +10% $572 |
| Rate | -1.0pp $517 | -0.5pp $488 | base $459 | +0.5pp $429 | +1.0pp $399 |
UW: 25.0% down · 7.5% · 30yr · 1.5% tax · 5.0% vac · 8.0% maint · 8.0% mgmt
Financing live
Cash to close
- Down payment
- $28,750
- Closing costs
- $3,450
- Reserves months
- —
- Total cash needed
- —
Loan-product check · same deal, 3 products live
Conventional
25% down · 7.5% · 30yr
- Down + closing
- —
- Monthly P&I
- —
- Monthly cashflow
- —
- DSCR
- —
- Eligible?
- —
Personal DTI + credit; lowest rate.
DSCR
20% down · 8.5% · 30yr
- Down + closing
- —
- Monthly P&I
- —
- Monthly cashflow
- —
- DSCR
- —
- Eligible?
- —
No personal income docs; deal must DSCR.
Hard money
10% down · 12.0% · 12mo
- Down + closing
- —
- Monthly P&I
- —
- Monthly cashflow
- —
- DSCR
- —
- Eligible?
- —
Short-term bridge; refi at stabilization.
Rent comps 10 comps
| Address | Beds | Baths | Sqft | Rent | $/sqft | DOM | Units | Dist |
|---|---|---|---|---|---|---|---|---|
| 9705 Oak Tree Ter Oklahoma City, OK | 3.0 | 2.0 | 1100 | $1,410 | $1.28 | 11d | 1 | 0.90mi |
| 405 Lotus Ave Oklahoma City, OK | 3.0 | 2.0 | 1300 | $1,611 | $1.24 | 2d | 1 | 0.99mi |
| 217 Saint Charles Way Oklahoma City, OK | 4.0 | 2.0 | 1448 | $1,525 | $1.05 | 24d | 1 | 1.15mi |
| 629 Lloyd Ave Oklahoma City, OK | 4.0 | 1.5 | 1213 | $1,095 | $0.90 | 5d | 1 | 1.19mi |
| 604 Moraine Ave Oklahoma City, OK | 3.0 | 1.5 | 1181 | $1,395 | $1.18 | 2d | 1 | 1.22mi |
| 645 Lloyd Ave Oklahoma City, OK | 4.0 | 1.5 | 1186 | $1,650 | $1.39 | 2d | 1 | 1.24mi |
| 633 Lotus Ave Oklahoma City, OK | 3.0 | 1.0 | 1038 | $1,300 | $1.25 | 11d | 1 | 1.26mi |
| 9225 Stonegate Oklahoma City, OK | 2.0 | 1.0 | 870 | $1,025 | $1.18 | 3d | 1 | 1.30mi |
| 801 Royal Ave Oklahoma City, OK | 3.0 | 1.0 | 951 | $1,200 | $1.26 | 18d | 1 | 1.37mi |
| 9409 Rhythm Rd Oklahoma City, OK | 3.0 | 1.5 | 1087 | $1,250 | $1.15 | 22d | 1 | 1.40mi |
Listing history 5 events
-
2026-06-08statusdays on market $115,000 Pending 6 DOM
-
2026-06-07days on market $115,000 Active 5 DOM
-
2026-06-05days on market $115,000 Active 2 DOM
-
2026-06-02remarks 699-char remark
-
2026-06-02$115,000 Active 1 DOM
ⓘ Source: listings_history table (triggers on properties + properties_extension) + one-shot
backfill from property_details.listing_events for pre-trigger history.
Tax reassessment forecast OK · Resets to sale price
- Current annual tax
- $318 · $26/mo
- Projected year-2 tax
- $1,035 · $86/mo
- Expected delta
- +$717/yr (+$60/mo · 225.6%)
ⓘ Screening estimate from a state-policy table — verify with the county assessor before closing.
Climate risk First Street
- Flood 1/10 Low FEMA zone X (unshaded) · 0% chance over 30 yrs
- Wildfire 1/10 Low
- Heat 5/10 Major 7 d/yr ≥107°F today · 19 d/yr by 30 yrs out
- Wind 3/10 Moderate 5% chance of damaging wind over 30 yrs
- Air quality 2/10 Low 1 unhealthy d/yr today · 2 by 30 yrs out
Nearby sold comps map
Loading sold comps map…
Walkable amenities ~0.75 mi
Loading nearby amenities…
Taxation est. · year 1
- Rental income
- $17,259
- − Mortgage interest
- −$6,442
- − Property taxes
- −$318
- − Insurance
- −$575
- − Repairs & maintenance
- −$1,381
- − Management
- −$1,381
- − Depreciation
- −$3,345
- Taxable income
- $3,818
- Est. tax owed @ 24.0%
- −$916
- After-tax cash flow
- $4,589/yr
For passive investors: Depreciation is non-cash, so a rental often shows a tax loss while cash-flowing — sheltering income. Rental losses are passive: they offset passive income freely, and up to $25,000/yr can offset ordinary (W-2) income if you actively participate and your MAGI is under $100k (phasing out to $0 by $150k); unused losses carry forward. On sale, claimed depreciation is recaptured at up to 25%, and gains may owe capital-gains tax (a 1031 exchange can defer both). Figures are a year-1 estimate at your 24.0% rate — not tax advice; consult a CPA.
Schools (NCES district)
- District
- Midwest City-Del City
- NCES district ID
- 4019950
- Math proficiency
- 10% ▼ -11.00%
- Reading proficiency
- 17% ▼ -8.00%
- Median HH income
- $45,724
- Composite
- 12.09/100
- National rank
- #9658
- State rank
- #231 of 270 in OK
Livability — Midwest City
- Score
- 71/100
- State rank
- #30
- US rank
- #6637
Category grades
Schools grade is shown separately in the Schools card above.
Census & demographics
- Census place
- Midwest City, OK
- County
- Oklahoma County · 771,644 people
- City population
- 57,386
- Metro
- Oklahoma City, OK
- Population (ZIP)
- 21,476
- Household income
- $71,189
- Rent vs Own
- Severe rent burden
- 378.0
Population outlook (Oklahoma County) Hauer SSP2
- Today (2025)
- 911,875 people
- By 2030
- 982,413 · +7.7%
- By 2040
- 1,130,468 · +24.0%
- By 2050
- 1,288,422 · +41.3%
- By 2075
- 1,711,482 · +87.7%
- By 2100
- 2,088,448 · +129.0%
Race, ethnicity, and origin ACS 2023
- Neighborhood character
- Diverse neighborhood (Simpson 0.60)
- Race & ethnicity
- White 60% Black 18% Two or more races 14% Hispanic / Latino 7% Asian 2% Native American 2%
- Hispanic origin (detail)
- Mexican 6%
- Common ancestry
- Lithuanian 2% Slovak 2% Italian 2%
- Foreign-born
- 3% · Canada
- Languages at home
- 95% English-only · Spanish 3% Tagalog/Filipino 1%
Political lean MEDSL · Oklahoma
- 2024 margin
- Toss-up / Even · D 48.0% · R 49.7% · Other 2.3%
- 2008→2024 swing
- +15.1pp toward D · 2008: -16.8pp · 2024: -1.7pp
- All cycles
- 2024: R+1.7 2020: R+1.1 2016: R+10.5 2012: R+16.7 2008: R+16.8
Not yet ingested
- Civics
- —
Market trends
- HPI YoY
- ▼ -65.22%
- Current HPI
- 245.8385
- Rent YoY
- ▲ 5.73%
- Metro
- Oklahoma City, OK
- State GDP YoY
- ▲ 1.55%
- F500 in state
- 6
Industry mix (Fortune 500 HQ in OK)
| Industry | F500 HQs | Revenue |
|---|---|---|
| Energy | 3 | $48B |
|
||
Price history
-2.5% since first listed6 events — show timeline
- 2026-06-02 Listed $115,000 MLSOK
- 2026-05-25 Relisted — MLSOK
- 2026-05-25 Listing Removed — MLSOK
- 2026-05-11 Relisted — MLSOK
- 2026-03-23 Pending — MLSOK
- 2026-03-20 Listed $118,000 MLSOK
Property tax history
+0.6%/yrLatest (2025): $318 · -2.4% YoY. Source: county tax records.
Cash-flow waterfall
monthlySold comps — $/sqft
last 12 mo · ≤1 miLoading sold comps…