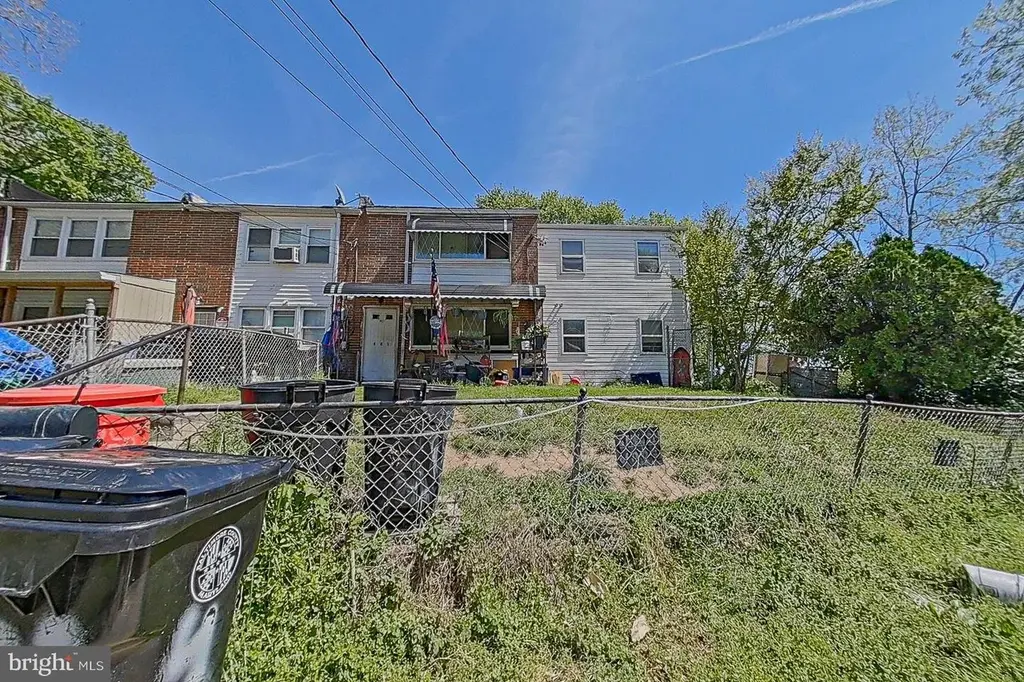
401 Burbank Ct · Lansdowne, MD
Flood risk 1/10 · Minimal
- FEMA flood zone
- X (unshaded)
- Chance of flooding over 30 yrs
- 0.0%
- Est. flood insurance / yr
- $507 – $1,088
Fire risk 1/10 · Minimal
- Est. fire insurance / yr
- $755 – $1,403
Heat risk 7/10 · Major
- Hot days now (above 103°F)
- 7 days/yr
- Hot days in 30 yrs
- 15 days/yr
Wind risk 6/10 · Moderate
- Chance of severe wind over 30 yrs
- 27.0%
Air-quality risk 4/10 · Minor
- Unhealthy air days now
- 5 days/yr
- Unhealthy air days in 30 yrs
- 6 days/yr
Risk factors via First Street. Map © Google.
Why this score? — see what drove the B grade
The composite is a weighted blend of 9 inputs, each scored 0–100. Each bar is that input's sub-score; the figure is the points it added to the 100-point composite (weight × sub-score).
- Cash flow +28.7/30.0
- ARV discount +15.0/15.0
- DSCR +10.0/10.0
- 1% rule +9.2/10.0
- Livability +3.3/5.0
- Rent growth +2.8/5.0
- Condition / age +2.5/5.0
- Schools +2.3/10.0
- Appreciation +0.0/10.0
$150,000
🖨 Deal sheet 📄 Offer letter ✓ Due diligence
Listing remarks
Strictly AS IS. Cash or Hard Money loan only. Buyer responsible for their due diligence. Huge corner lot and property has roughly double square footage compared to neighboring properties. Sellers will need some time to find new place to live
Key facts
- Built 1957
- Listed 19 days
Property features AI
Finance
- HOA & community: Other fees frequency: Unknown
Exterior
- Parking: On-street parking
- Utilities: Public water; Public sewer; Cable TV available; Electric cooling fuel
- Home design: End-of-row townhouse; Fee simple ownership
- Construction: Brick and vinyl siding exterior; Composite roof; Slab foundation; Built (year from assessor)
- Exterior features: Rear fencing; Corner lot
Interior
- Bedrooms: Three bedrooms on the upper level; One bedroom on the main level; Master bedroom
- Bathrooms: Two full bathrooms (both on upper level)
- Heating & cooling: Forced air heating; Central air conditioning; Natural gas heating and hot water
- Interior features: Family room; Utility room
- Laundry & utility: Laundry room
Neighborhood map
What this means for you Summary
Snapshot
- This is a 4-bed/2.0-bath townhouse listed at $150k.
Deal economics
- At list price, monthly cash flow is $499 ($6k/yr) — positive.
- The deal already cash-flows at list — no discount required.
- Meets the 1% rule at list price ($2k rent vs $150k).
- Recommended offer: $148k (1.5% below list) — sets the bar for market timing.
- Cap rate 10.3% vs local median 4.5% in Lansdowne — top-decile yield for the area; either an underpriced asset or a hidden risk that comps aren't pricing in. Stress-test before assuming the spread holds.
Location & tenants
- Location reads 66/100 on livability (#235 in MD) — a middle-class / working-renter tenant base. Strengths: commute A+, cost of living A, housing A-; Watch: employment D, schools F, crime F.
- Baltimore County Public Schools (suburban): math 15% / reading 34% proficiency, ranked #11 of 24 in MD (top 46%) — low school quality limits family demand, transient renter base, plan for 1-2y turnover.
- Market conditions: Rents rising (+1.2%/yr); 99 active listings in the ZIP; 3 comparable units currently listed for rent nearby; rentals lingering (median 44d on market — plan ~5-8 weeks vacancy on turnover, expect pricing pressure); 67% of comp listings sitting > 30 days — soft ceiling on asking rent; solid renter incomes; 1,511 units permitted in Baltimore County in 2024 (643 in 5+ unit buildings).
Forward outlook
- Local home prices are declining (-3.0%/yr); year-one equity from $1k of loan paydown is wiped out by about $4k of value loss. Plan a longer hold.
- Baltimore County population projected at +12% by 2050 — modest demand growth; plan on rents tracking national, not racing it.
Negotiation context
- It's been on market 20 days — a 2% lower offer ($148k) is reasonable based on typical stale-listing flexibility.
- 3 sale attempts since 30y ago; this cycle's ask has dropped $50k (25%) from the opening price — seller is motivated, your offer sets the floor, not the list.
- Current owner paid $85k; list at $150k implies a 76% gain — meaningful room to come down on a strong offer.
Risks & watch-outs
- Watch-outs: property tax is 2.7% of price; built in 1957 — expect roof / HVAC / electrical / plumbing capex.
- Climate carrying-cost: major wind risk, 27% chance of damaging wind over 30y; extreme-heat days projected 7→15/yr by 2055 (HVAC capex compounding) — expect insurance premiums to compound above CPI over the hold.
Questions for the listing agent
- Built in 1957 — when were the roof, HVAC, electrical panel, plumbing, and water heater last replaced?
- Property tax is high relative to price — has the assessment been appealed recently, and will the sale trigger a re-assessment?
- Is there a deadline driving the sale (1031 exchange, divorce, estate, relocation)? That informs how much negotiation room exists.
- Schools are F-rated, which usually means shorter tenancies and higher turnover. Who's the typical renter profile here, and what's been the actual vacancy rate?
- Crime grade is F in this area — have there been break-ins, vandalism, or insurance claims at this property in the last 3 years? What carrier currently insures it and at what premium?
- What's the average days-on-market for RENTAL listings here right now (not sales)? A rising rental-DOM trend means longer vacancies and softer asking-rent achievability than the comps imply.
- What's the recent tenant-quality profile in this submarket — average credit score on applications, eviction rate, late-payment / NSF rate, and stable-employment percentage? A property-management company in the area should have these aggregated.
- How much new for-sale + rental construction is in the pipeline within 1–3 miles? Heavy new supply typically softens prices + rents 12–24 months out; constrained supply supports both.
Investment metrics
- 1% rule
- 1.42% ✓
- Cap rate
- 10.28%
- Cash-on-cash
- 14.25%
- DSCR
- 1.63
- GRM
- 5.9
CMA / ARV
- ARV (median comp)
- $227,944
- List price
- $150,000
- Delta
- -34.19%
- Verdict
- UNDERPRICED
- Comps
- 20 within 1.0 mi
Show comp detail 2 sales within ~0.75 mi
| Address | Dist | Beds/Ba | Sqft | Sold | Price | $/sf | Match |
|---|---|---|---|---|---|---|---|
| 3225 Ryerson Cir | 0.32mi | 3/1.5 (-1) | 1,674 (-13%) | 1mo | $286,000 | $171 | 56 |
| 3147 Ryerson Cir | 0.28mi | 3/2.0 (-1) | 1,686 (-12%) | 18mo | $265,000 | $157 | 46 |
Match score weights: distance 35% · size 25% · config 20% · recency 20%. Top-matched comps best support the ARV.
Projected returns pro-forma
-3.0% appreciation · 1.17% rent growth · sell at horizon
- IRR
- 2.4%
- Equity multiple
- 1.09×
- Total profit
- $3,724
- Equity at exit
- $22,365
- IRR
- 9.9%
- Equity multiple
- 1.70×
- Total profit
- $29,401
- Equity at exit
- $12,969
Cash invested: $42,000 (down + closing). Projections, not guarantees.
Landlord ↔ Tenant lean methodology
- Overall (STATE)
- 27 Tenant-Leaning
- State Maryland
- 27 Tenant-Leaning · D+14
- County
- — inherits STATE
- City
- — inherits STATE
ZIP-level market 21227
- Rents YoY
- 1.2%
- Active inventory
- 99
- Price-to-rent
- 5.9×
Monthly cashflow live
- Estimated rent
- $2,130 medium interval (Pro) →
- Mortgage (P&I)
- −$787
- Tax from tax record
- −$335 /mo · $4,021/yr
- Insurance
- −$62
- HOA
- −$0
- Vacancy / Maint / Mgmt
- −$447
- Net cashflow
- $499
Break-even live
UW: 25.0% down · 7.5% · 30yr · 1.5% tax · 5.0% vac · 8.0% maint · 8.0% mgmt
Financing live
Cash to close
- Down payment
- $37,500
- Closing costs
- $4,500
- Reserves months
- —
- Total cash needed
- —
Loan-product check · same deal, 3 products live
Conventional
25% down · 7.5% · 30yr
- Down + closing
- —
- Monthly P&I
- —
- Monthly cashflow
- —
- DSCR
- —
- Eligible?
- —
Personal DTI + credit; lowest rate.
DSCR
20% down · 8.5% · 30yr
- Down + closing
- —
- Monthly P&I
- —
- Monthly cashflow
- —
- DSCR
- —
- Eligible?
- —
No personal income docs; deal must DSCR.
Hard money
10% down · 12.0% · 12mo
- Down + closing
- —
- Monthly P&I
- —
- Monthly cashflow
- —
- DSCR
- —
- Eligible?
- —
Short-term bridge; refi at stabilization.
Rent comps 3 comps
| Address | Beds | Baths | Sqft | Rent | $/sqft | DOM | Units | Dist |
|---|---|---|---|---|---|---|---|---|
| 3269 Ryerson Cir Halethorpe, MD | 3.0 | 2.0 | 1303 | $1,700 | $1.30 | 10d | 1 | 0.39mi |
| 2713 Hammonds Ferry Rd Lansdowne, MD | 3.0 | 2.0 | 1990 | $1,950 | $0.98 | 43d | 1 | 0.96mi |
| 3207 Bryant Ave Halethorpe, MD | 3.0 | 2.0 | 1808 | $2,350 | $1.30 | 43d | 1 | 1.32mi |
Listing history 10 events
-
2026-05-31days on market $150,000 Active 20 DOM
-
2026-05-11$200,000 Active 203-char remark
-
2026-04-29historical $200,000 203-char remark
-
1997-08-25soldstatus $85,000
-
1997-08-21soldstatus $85,000
-
1997-08-01historical
-
1997-05-29$87,500
-
1997-03-21historical
-
1996-09-22
-
1987-05-07soldstatus $55,800
ⓘ Source: listings_history table (triggers on properties + properties_extension) + one-shot
backfill from property_details.listing_events for pre-trigger history.
Tax reassessment forecast MD · Partial reset (capped growth)
- Current annual tax
- $4,021 · $335/mo
- Projected year-2 tax
- $4,021 · $335/mo
- Expected delta
- $0/yr ($0/mo · 0.0%)
ⓘ Screening estimate from a state-policy table — verify with the county assessor before closing.
Climate risk First Street
- Flood 1/10 Low FEMA zone X (unshaded) · 0% chance over 30 yrs
- Wildfire 1/10 Low
- Heat 7/10 Severe 7 d/yr ≥103°F today · 15 d/yr by 30 yrs out
- Wind 6/10 Major 27% chance of damaging wind over 30 yrs
- Air quality 4/10 Moderate 5 unhealthy d/yr today · 6 by 30 yrs out
Nearby sold comps map
Loading sold comps map…
Walkable amenities ~0.75 mi
Loading nearby amenities…
Taxation est. · year 1
- Rental income
- $25,563
- − Mortgage interest
- −$8,402
- − Property taxes
- −$4,021
- − Insurance
- −$750
- − Repairs & maintenance
- −$2,045
- − Management
- −$2,045
- − Depreciation
- −$4,364
- Taxable income
- $3,936
- Est. tax owed @ 24.0%
- −$945
- After-tax cash flow
- $5,039/yr
For passive investors: Depreciation is non-cash, so a rental often shows a tax loss while cash-flowing — sheltering income. Rental losses are passive: they offset passive income freely, and up to $25,000/yr can offset ordinary (W-2) income if you actively participate and your MAGI is under $100k (phasing out to $0 by $150k); unused losses carry forward. On sale, claimed depreciation is recaptured at up to 25%, and gains may owe capital-gains tax (a 1031 exchange can defer both). Figures are a year-1 estimate at your 24.0% rate — not tax advice; consult a CPA.
Schools (NCES district)
- District
- Baltimore County Public Schools
- NCES district ID
- 2400120
- Math proficiency
- 15% ▼ -16.00%
- Reading proficiency
- 34% ▼ -5.00%
- Median HH income
- $66,746
- Composite
- 23.17/100
- National rank
- #7948
- State rank
- #11 of 24 in MD
Livability — Lansdowne
- Score
- 66/100
- State rank
- #235
- US rank
- #11670
Category grades
Schools grade is shown separately in the Schools card above.
Census & demographics
- Census place
- Lansdowne, MD
- County
- Baltimore County · 769,527 people
- Metro
- Baltimore-Columbia-Towson, MD
- Population (ZIP)
- 34,907
- Household income
- $85,986
- Rent vs Own
- Severe rent burden
- 930.0
Population outlook (Baltimore County) Hauer SSP2
- Today (2025)
- 885,518 people
- By 2030
- 909,272 · +2.7%
- By 2040
- 951,547 · +7.5%
- By 2050
- 990,955 · +11.9%
- By 2075
- 1,086,411 · +22.7%
- By 2100
- 1,135,078 · +28.2%
Race, ethnicity, and origin ACS 2023
- Neighborhood character
- Diverse neighborhood (Simpson 0.59)
- Race & ethnicity
- White 61% Black 16% Hispanic / Latino 12% Two or more races 7% Asian 4%
- Hispanic origin (detail)
- Mexican 2%
- Common ancestry
- Romanian 2% Italian 2% Slovak 2%
- Foreign-born
- 13% · Canada, Philippines, China
- Languages at home
- 83% English-only · Spanish 10% Other Asian/Pacific 2% Other Indo-European 2%
Political lean MEDSL · Baltimore
- 2024 margin
- Strong D (+24.5) · D 61.0% · R 36.5% · Other 2.5%
- 2008→2024 swing
- +9.9pp toward D · 2008: 14.6pp · 2024: 24.5pp
- All cycles
- 2024: D+24.5 2020: D+27.0 2016: D+17.4 2012: D+16.4 2008: D+14.6
Not yet ingested
- Civics
- —
Market trends
- HPI YoY
- ▼ -294.07%
- Current HPI
- 281.9628
- Rent YoY
- ▲ 1.17%
- Metro
- Baltimore-Columbia-Towson, MD
- State GDP YoY
- ▲ 2.97%
- F500 in state
- 12
Industry mix (Fortune 500 HQ in MD)
| Industry | F500 HQs | Revenue |
|---|---|---|
| Aerospace / Defense | 1 | $71B |
|
||
| Utilities | 1 | $25B |
|
||
| Hotels | 1 | $24B |
|
||
| Consumer Goods | 1 | $7B |
|
||
| Real Estate | 1 | $6B |
|
||
| Chemicals | 1 | $2B |
|
||
Price history
+168.8% since first listed11 events — show timeline
- 2026-05-31 Listing Removed — BRIGHT MLS
- 2026-05-22 Price Changed $150,000 BRIGHT MLS
- 2026-05-11 Listed $200,000 BRIGHT MLS
- 2026-04-29 Coming Soon — BRIGHT MLS
- 1997-08-25 Sold (Public Records) $85,000 Public Records
- 1997-08-21 Sold (MLS) $85,000 MRIS
- 1997-08-01 Delisted — MRIS
- 1997-05-29 Listed $87,500 MRIS
- 1997-03-21 Delisted — MRIS
- 1996-09-22 Listed — MRIS
- 1987-05-07 Sold (Public Records) $55,800 Public Records
Property tax history
+4.3%/yrLatest (2025): $4,021 · -19.2% YoY. Source: county tax records.
Cash-flow waterfall
monthlySold comps — $/sqft
last 12 mo · ≤1 miLoading sold comps…