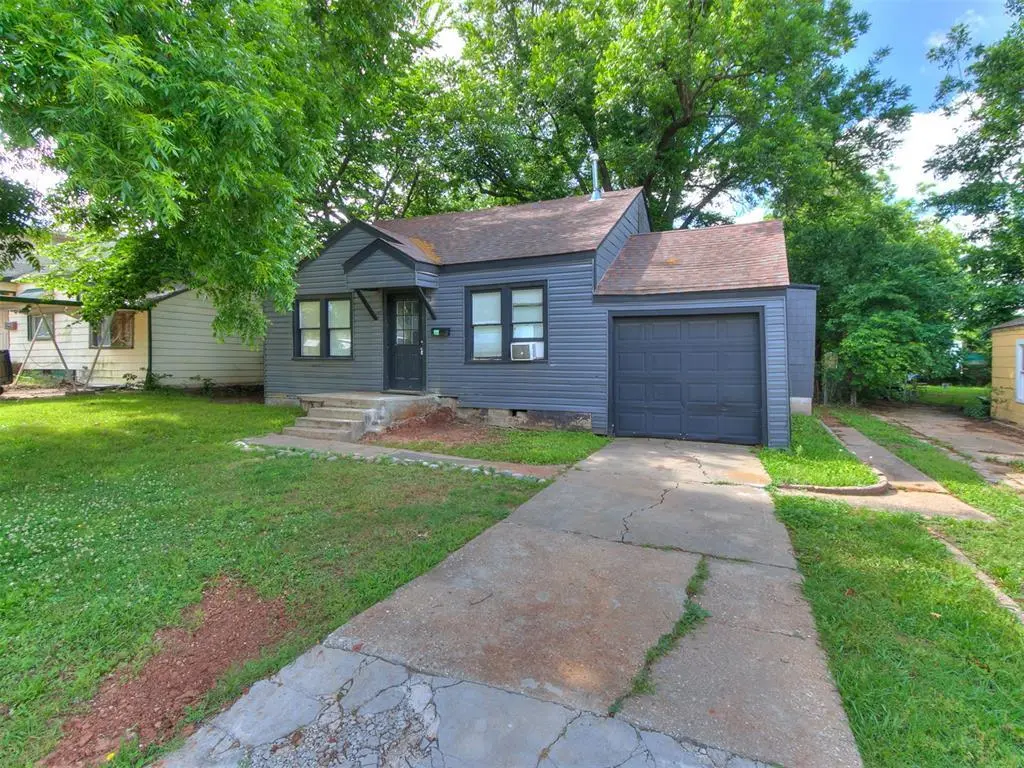
1132 SW Binkley St · Oklahoma City, OK
Flood risk 1/10 · Minimal
- FEMA flood zone
- X (unshaded)
- Chance of flooding over 30 yrs
- 0.0%
- Est. flood insurance / yr
- $507 – $1,088
Fire risk 1/10 · Minimal
- Est. fire insurance / yr
- $2,463 – $4,575
Heat risk 6/10 · Moderate
- Hot days now (above 107°F)
- 7 days/yr
- Hot days in 30 yrs
- 19 days/yr
Wind risk 3/10 · Minor
- Chance of severe wind over 30 yrs
- 4.0%
Air-quality risk 1/10 · Minimal
- Unhealthy air days now
- 0 days/yr
- Unhealthy air days in 30 yrs
- 0 days/yr
Risk factors via First Street. Map © Google.
Why this score? — see what drove the B- grade
The composite is a weighted blend of 9 inputs, each scored 0–100. Each bar is that input's sub-score; the figure is the points it added to the 100-point composite (weight × sub-score).
- Cash flow +18.9/30.0
- ARV discount +15.0/15.0
- Appreciation +10.0/10.0
- DSCR +6.0/10.0
- 1% rule +4.3/10.0
- Livability +4.0/5.0
- Rent growth +3.6/5.0
- Condition / age +2.5/5.0
- Schools +0.7/10.0
$109,500
🖨 Deal sheet 📄 Offer letter ✓ Due diligence
Listing remarks
Investor-Friendly South OKC Opportunity Investor-friendly opportunity in South Oklahoma City with a practical layout, manageable footprint, and strong rental potential. This 2 bed, 1 bath home offers approximately 1,052 square feet on a roughly 7,000 square foot lot, making it a straightforward option for a rental portfolio, first investment property, or value-add hold. The floor plan keeps things simple with defined living spaces, two bedrooms, one full bath, and a functional single-story layout. The lot provides usable outdoor space without being overly difficult to maintain, which can be a plus for long-term rental ownership. Located near Capitol Hill-area conveniences, major roads, sch
Key facts
- Usable outdoor space
- 7,000 sq ft lot
- Garage
Tags
Property features AI
Finance
- Other: Lot size approximately 0.1607 acre; Located in Academy Heights addition
- Financial info: Current listing price provided; Assumability unknown; Loan qualification unknown
- HOA & community: No mandatory association dues
Exterior
- Parking: 1-car garage
- Security: No storm shelter
- Utilities: No specific utilities listed
- Home design: Single-family residence; One-level home; Residential property
- Construction: Frame construction; Composition roof; Conventional foundation; Existing structure
- Exterior features: Front porch; Interior lot
Interior
- Kitchen: No specific appliances listed
- Bedrooms: 2 bedrooms
- Flooring: No flooring details provided
- Bathrooms: 1 full bathroom
- Heating & cooling: Floor furnace heating; Window air conditioning units
- Interior features: Living area with one living space; Dining area
- Laundry & utility: No laundry details provided
Neighborhood map
What this means for you Summary
Snapshot
- This is a 2-bed/1.0-bath single-family listed at $110k.
Deal economics
- At list price, monthly cash flow is $112 ($1k/yr) — positive.
- The deal already cash-flows at list — no discount required.
- To meet the 1% rule (rent ≥ 1% of price), the offer needs to be $102k (6.5% below list).
- Recommended offer: $102k (6.5% below list) — sets the bar for 1% rule.
- Cap rate 7.5% vs local median 3.7% in Oklahoma City — top-decile yield for the area; either an underpriced asset or a hidden risk that comps aren't pricing in. Stress-test before assuming the spread holds.
Location & tenants
- Location reads 80/100 on livability (#3 in OK, #1,635 nationally) — a professional / high-income tenant draw. Strengths: amenities A+, commute A+, cost of living A+; Watch: crime F.
- Oklahoma City (urban): math 7% / reading 10% proficiency, ranked #254 of 270 in OK (top 94%) — low school quality limits family demand, transient renter base, plan for 1-2y turnover; 82% free/reduced lunch — lower-income household profile, screen leases tightly.
- Zoned schools: Heronville Es (math 2% / reading 8%, grade F, #766 of 845 statewide, top 94%, 559 students, 0% FRL); Capitol Hill Hs (math 2% / reading 4%, grade F, #444 of 447 statewide, top 99%, 1,455 students, 0% FRL) — zoned schools average 0% FRL vs 82% district-wide (82 pts lower); this property's tenant base skews higher-income than the district average.
- Market conditions: Rents rising fast (+4.5%/yr); 83 active listings in the ZIP; 32 comparable units currently listed for rent nearby; rentals at typical pace (median 24d on market — plan ~3-4 weeks tenant-placement turnaround); lower-income renter base — watch delinquency; 5,365 units permitted in Oklahoma County in 2024 (569 in 5+ unit buildings).
Forward outlook
- In year one you build about $12k of equity ($757 loan paydown + $11k appreciation (10.0% local appreciation)).
- Oklahoma County population projected at +41% by 2050 — long-run rental-demand tailwind backs the buy-and-hold thesis.
- At projected returns (10.0% appreciation + 4.5% rent growth), your $31k cash investment doubles in ~3 years — after that, you're playing with house money.
- By year 4, paydown + projected appreciation supports a ~$42k cash-out refi (75% LTV) — recoverable capital for the next deal without selling this one.
Negotiation context
- Only 11 days on market — expect competitive offers; lowballing is unlikely to land.
- Current owner paid $62k; list at $110k implies a 75% gain — meaningful room to come down on a strong offer.
Risks & watch-outs
- Watch-outs: built in 1940 — expect roof / HVAC / electrical / plumbing capex.
- Climate carrying-cost: extreme-heat days projected 7→19/yr by 2055 (HVAC capex compounding) — expect insurance premiums to compound above CPI over the hold.
Questions for the listing agent
- Built in 1940 — when were the roof, HVAC, electrical panel, plumbing, and water heater last replaced?
- Is there a deadline driving the sale (1031 exchange, divorce, estate, relocation)? That informs how much negotiation room exists.
- Schools are F-rated, which usually means shorter tenancies and higher turnover. Who's the typical renter profile here, and what's been the actual vacancy rate?
- Crime grade is F in this area — have there been break-ins, vandalism, or insurance claims at this property in the last 3 years? What carrier currently insures it and at what premium?
- What's the average days-on-market for RENTAL listings here right now (not sales)? A rising rental-DOM trend means longer vacancies and softer asking-rent achievability than the comps imply.
- What's the recent tenant-quality profile in this submarket — average credit score on applications, eviction rate, late-payment / NSF rate, and stable-employment percentage? A property-management company in the area should have these aggregated.
- How much new for-sale + rental construction is in the pipeline within 1–3 miles? Heavy new supply typically softens prices + rents 12–24 months out; constrained supply supports both.
Investment metrics
- 1% rule
- 0.93% ✗
- Cap rate
- 7.52%
- Cash-on-cash
- 4.39%
- DSCR
- 1.20
- GRM
- 8.9
CMA / ARV
- ARV (on-the-fly)
- $134,656
- Comps found
- 12
Show comp detail 12 sales within ~0.75 mi
| Address | Dist | Beds/Ba | Sqft | Sold | Price | $/sf | Match |
|---|---|---|---|---|---|---|---|
| 1321 SW 31st St | 0.23mi | 3/2.0 (+1) | 1,059 (+1%) | 14mo | $165,000 | $156 | 67 |
| 1028 34th St | 0.22mi | 2/1.0 | 1,128 (+7%) | 14mo | $145,000 | $129 | 66 |
| 1128 SW 38th St | 0.45mi | 3/2.0 (+1) | 1,076 (+2%) | 0mo | $138,000 | $128 | 66 |
| 1216 SW 39th St | 0.52mi | 3/2.0 (+1) | 1,064 (+1%) | 2mo | $87,550 | $82 | 63 |
| 1233 SW 34th St | 0.19mi | 2/1.0 | 918 (-13%) | 9mo | $120,000 | $131 | 62 |
| 1440 SW 25th St | 0.61mi | 2/1.0 | 1,064 (+1%) | 9mo | $52,500 | $49 | 62 |
| 1428 Reding Dr | 0.58mi | 3/1.0 (+1) | 973 (-8%) | 4mo | $68,000 | $70 | 52 |
| 1325 SW 28th St | 0.37mi | 2/1.5 | 1,200 (+14%) | 8mo | $74,000 | $62 | 50 |
| 1134 SW 42nd St | 0.69mi | 3/1.0 (+1) | 1,154 (+10%) | 3mo | $175,000 | $152 | 44 |
| 717 SW 25th St | 0.74mi | 2/1.0 | 926 (-12%) | 2mo | $70,000 | $76 | 44 |
| 1353 Kinkaid Dr | 0.62mi | 3/1.0 (+1) | 1,172 (+11%) | 8mo | $150,000 | $128 | 41 |
| 1521 SW 25th St | 0.69mi | 3/2.0 (+1) | 916 (-13%) | 1mo | $162,000 | $177 | 36 |
Match score weights: distance 35% · size 25% · config 20% · recency 20%. Top-matched comps best support the ARV.
Projected returns pro-forma
10.0% appreciation · 4.51% rent growth · sell at horizon
- IRR
- 28.0%
- Equity multiple
- 3.23×
- Total profit
- $68,339
- Equity at exit
- $98,646
- IRR
- 24.8%
- Equity multiple
- 7.49×
- Total profit
- $198,989
- Equity at exit
- $212,734
Cash invested: $30,660 (down + closing). Projections, not guarantees.
Landlord ↔ Tenant lean methodology
- Overall (STATE)
- 83 Strongly Landlord-Friendly
- State Oklahoma
- 83 Strongly Landlord-Friendly · R+20
- County
- — inherits STATE
- City
- — inherits STATE
ZIP-level market 73109
- Home prices YoY
- 9.5%
- Rents YoY
- 4.5%
- Active inventory
- 83
- Price-to-rent
- 8.9×
Monthly cashflow live
- Estimated rent
- $1,023 high interval (Pro) →
- Mortgage (P&I)
- −$574
- Tax from tax record
- −$76 /mo · $916/yr
- Insurance
- −$46
- HOA
- −$0
- Vacancy / Maint / Mgmt
- −$215
- Net cashflow
- $112
Break-even live
UW: 25.0% down · 7.5% · 30yr · 1.5% tax · 5.0% vac · 8.0% maint · 8.0% mgmt
Financing live
Cash to close
- Down payment
- $27,375
- Closing costs
- $3,285
- Reserves months
- —
- Total cash needed
- —
Loan-product check · same deal, 3 products live
Conventional
25% down · 7.5% · 30yr
- Down + closing
- —
- Monthly P&I
- —
- Monthly cashflow
- —
- DSCR
- —
- Eligible?
- —
Personal DTI + credit; lowest rate.
DSCR
20% down · 8.5% · 30yr
- Down + closing
- —
- Monthly P&I
- —
- Monthly cashflow
- —
- DSCR
- —
- Eligible?
- —
No personal income docs; deal must DSCR.
Hard money
10% down · 12.0% · 12mo
- Down + closing
- —
- Monthly P&I
- —
- Monthly cashflow
- —
- DSCR
- —
- Eligible?
- —
Short-term bridge; refi at stabilization.
Rent comps 32 comps
| Address | Beds | Baths | Sqft | Rent | $/sqft | DOM | Units | Dist |
|---|---|---|---|---|---|---|---|---|
| 1329 SW Grand Blvd Oklahoma City, OK | 2.0 | 1.0 | 858 | $1,050 | $1.22 | 43d | 1 | 0.36mi |
| 1345 SW 27th St Oklahoma City, OK | 3.0 | 2.0 | 1153 | $1,095 | $0.95 | 2d | 1 | 0.48mi |
| 1132 SW 40th St Oklahoma City, OK | 3.0 | 2.0 | 1436 | $1,350 | $0.94 | 23d | 1 | 0.57mi |
| 3407 S Lee Ave Oklahoma City, OK | 2.0 | 1.0 | 900 | $980 | $1.09 | 43d | 1 | 0.69mi |
| 3616 S Lee Ave Oklahoma City, OK | 1.0 | 1.0 | 760 | $775 | $1.02 | 43d | 1 | 0.74mi |
| 3618 S Lee Ave Oklahoma City, OK | 1.0 | 1.0 | 760 | $850 | $1.12 | 43d | 1 | 0.74mi |
| 2140 SW 35th St Oklahoma City, OK | 3.0 | 2.0 | 976 | $1,300 | $1.33 | 43d | 1 | 0.81mi |
| 2119 SW 39th St Oklahoma City, OK | 1.0–2.0 | 1.0 | 675 | $909 | $1.35 | 43d | 1 | 0.85mi |
| 1004 SW 45th St Oklahoma City, OK | 2.0 | 1.0 | 756 | $950 | $1.26 | 23d | 1 | 0.88mi |
| 2125 SW 26th St Unit B Oklahoma City, OK | 1.0 | 1.0 | 800 | $700 | $0.88 | 23d | 1 | 0.88mi |
| 1056 Hangar Dr Oklahoma City, OK | 2.0 | 1.5 | 844 | $2,400 | $2.84 | 43d | 1 | 0.91mi |
| 4426 S Olie Ave Oklahoma City, OK | 2.0 | 2.0 | 1159 | $1,220 | $1.05 | 11d | 1 | 0.91mi |
| 540 SW 24th St #3 Oklahoma City, OK | 1.0 | 1.0 | 726 | $625 | $0.86 | 43d | 1 | 0.91mi |
| 934 Hangar Dr Unit 3 Oklahoma City, OK | 2.0 | 2.0 | 864 | $1,550 | $1.79 | 43d | 1 | 0.94mi |
| 2128 SW 41st St Oklahoma City, OK | 2.0 | 1.0 | 860 | $820 | $0.95 | 2d | 1 | 0.96mi |
| 900 Hangar Dr Oklahoma City, OK | 2.0 | 1.0–2.0 | 743 | $2,075 | $2.79 | 1d | 37 | 0.97mi |
| 3906 S Hudson Ave Oklahoma City, OK | 1.0 | 1.0 | 700 | $750 | $1.07 | 23d | 1 | 1.00mi |
| 632 SW 44th St Oklahoma City, OK | 2.0 | 1.0 | 958 | $1,000 | $1.04 | 4d | 1 | 1.00mi |
| 624 SW 44th St Oklahoma City, OK | 2.0 | 1.0 | 1206 | $1,500 | $1.24 | 43d | 1 | 1.01mi |
| 4330 S Barnes Ave Oklahoma City, OK | 1.0–3.0 | 1.0–2.0 | 860 | $937 | $1.09 | 4d | 9 | 1.02mi |
| 3312 S Harvey Ave Oklahoma City, OK | 2.0 | 1.0 | 840 | $1,100 | $1.31 | 20d | 1 | 1.02mi |
| 2336 SW Grand Blvd Oklahoma City, OK | 2.0 | 1.0 | 770 | $995 | $1.29 | 43d | 1 | 1.06mi |
| 733 SW 47th St Oklahoma City, OK | 3.0 | 1.5 | 1228 | $1,180 | $0.96 | 23d | 1 | 1.07mi |
| 1338 South Dr Oklahoma City, OK | 2.0 | 1.0 | 720 | $1,150 | $1.60 | 16d | 1 | 1.22mi |
| 620 SW 50th St Oklahoma City, OK | 2.0 | 1.0 | 977 | $1,100 | $1.13 | 2d | 1 | 1.33mi |
| 116 SW 23rd St Oklahoma City, OK | 1.0 | 1.0 | 700 | $650 | $0.93 | 43d | 1 | 1.34mi |
| 115 SW 23rd St Oklahoma City, OK | 1.0 | 1.0 | 750 | $575 | $0.77 | 16d | 1 | 1.36mi |
| 800 SW 52nd St Oklahoma City, OK | 2.0 | 1.0 | 920 | $995 | $1.08 | 23d | 1 | 1.39mi |
| 2612 SW 41st St Oklahoma City, OK | 3.0 | 1.0 | 1164 | $1,200 | $1.03 | 23d | 1 | 1.42mi |
| 2640 SW 38th St Oklahoma City, OK | 3.0 | 2.0 | 944 | $1,050 | $1.11 | 2d | 1 | 1.43mi |
| 1416 S Daugherty Ave Oklahoma City, OK | 3.0 | 1.0 | 1164 | $1,120 | $0.96 | 11d | 1 | 1.47mi |
| 1632 Birch St Oklahoma City, OK | 2.0 | 1.0 | 935 | $775 | $0.83 | 2d | 1 | 1.49mi |
Listing history 9 events
-
2026-06-07days on market $109,500 Active 11 DOM
-
2026-06-05days on market $109,500 Active 8 DOM
-
2026-06-03days on market $109,500 Active 7 DOM
-
2026-06-02days on market $109,500 Active 6 DOM
-
2026-06-01days on market $109,500 Active 5 DOM
-
2026-05-31days on market $109,500 Active 4 DOM
-
2026-05-27$109,500 Active
-
2022-05-27soldstatus $62,500
-
1993-04-20soldstatus $13,500
ⓘ Source: listings_history table (triggers on properties + properties_extension) + one-shot
backfill from property_details.listing_events for pre-trigger history.
Tax reassessment forecast OK · Resets to sale price
- Current annual tax
- $916 · $76/mo
- Projected year-2 tax
- $985 · $82/mo
- Expected delta
- +$69/yr (+$6/mo · 7.5%)
ⓘ Screening estimate from a state-policy table — verify with the county assessor before closing.
Climate risk First Street
- Flood 1/10 Low FEMA zone X (unshaded) · 0% chance over 30 yrs
- Wildfire 1/10 Low
- Heat 6/10 Major 7 d/yr ≥107°F today · 19 d/yr by 30 yrs out
- Wind 3/10 Moderate 4% chance of damaging wind over 30 yrs
- Air quality 1/10 Low 0 unhealthy d/yr today · 0 by 30 yrs out
Nearby sold comps map
Loading sold comps map…
Walkable amenities ~0.75 mi
Loading nearby amenities…
Taxation est. · year 1
- Rental income
- $12,280
- − Mortgage interest
- −$6,134
- − Property taxes
- −$916
- − Insurance
- −$548
- − Repairs & maintenance
- −$982
- − Management
- −$982
- − Depreciation
- −$3,185
- Taxable loss
- −$468
- Est. tax savings @ 24.0%
- +$112
- After-tax cash flow
- $1,459/yr
For passive investors: Depreciation is non-cash, so a rental often shows a tax loss while cash-flowing — sheltering income. Rental losses are passive: they offset passive income freely, and up to $25,000/yr can offset ordinary (W-2) income if you actively participate and your MAGI is under $100k (phasing out to $0 by $150k); unused losses carry forward. On sale, claimed depreciation is recaptured at up to 25%, and gains may owe capital-gains tax (a 1031 exchange can defer both). Figures are a year-1 estimate at your 24.0% rate — not tax advice; consult a CPA.
Schools (NCES district)
- District
- Oklahoma City
- NCES district ID
- 4022770
- Math proficiency
- 7% ▼ -5.00%
- Reading proficiency
- 10% ▼ -6.00%
- Median HH income
- $35,606
- Composite
- 7.0/100
- National rank
- #9970
- State rank
- #254 of 270 in OK
Livability — Oklahoma City
- Score
- 80/100
- State rank
- #3
- US rank
- #1635
Category grades
Schools grade is shown separately in the Schools card above.
Census & demographics
- Census place
- Oklahoma City, OK
- County
- Oklahoma County · 771,644 people
- City population
- 498,656
- Metro
- Oklahoma City, OK
- Population (ZIP)
- 21,378
- Household income
- $43,133
- Rent vs Own
- Severe rent burden
- 1473.0
Population outlook (Oklahoma County) Hauer SSP2
- Today (2025)
- 911,875 people
- By 2030
- 982,413 · +7.7%
- By 2040
- 1,130,468 · +24.0%
- By 2050
- 1,288,422 · +41.3%
- By 2075
- 1,711,482 · +87.7%
- By 2100
- 2,088,448 · +129.0%
Race, ethnicity, and origin ACS 2023
- Neighborhood character
- Diverse neighborhood (Simpson 0.55)
- Race & ethnicity
- Hispanic / Latino 62% Two or more races 24% White 23% Black 9% Native American 5%
- Hispanic origin (detail)
- Mexican 58%
- Common ancestry
- Italian 1% Hispanic 1% Scottish 1%
- Foreign-born
- 26% · Canada
- Languages at home
- 49% English-only · Spanish 50% Other Asian/Pacific 0%
Political lean MEDSL · Oklahoma
- 2024 margin
- Toss-up / Even · D 48.0% · R 49.7% · Other 2.3%
- 2008→2024 swing
- +15.1pp toward D · 2008: -16.8pp · 2024: -1.7pp
- All cycles
- 2024: R+1.7 2020: R+1.1 2016: R+10.5 2012: R+16.7 2008: R+16.8
Not yet ingested
- Civics
- —
Market trends
- HPI YoY
- ▲ 23.48%
- Current HPI
- 270.5333
- Rent YoY
- ▲ 4.51%
- Metro
- Oklahoma City, OK
- State GDP YoY
- ▲ 1.55%
- F500 in state
- 6
Industry mix (Fortune 500 HQ in OK)
| Industry | F500 HQs | Revenue |
|---|---|---|
| Energy | 3 | $48B |
|
||
Price history
+711.1% since first listed3 events — show timeline
- 2026-05-27 Listed $109,500 MLSOK
- 2022-05-27 Sold (Public Records) $62,500 Public Records
- 1993-04-20 Sold (Public Records) $13,500 Public Records
Property tax history
+4.8%/yrLatest (2025): $916 · +4.4% YoY. Source: county tax records.
Cash-flow waterfall
monthlySold comps — $/sqft
last 12 mo · ≤1 miLoading sold comps…