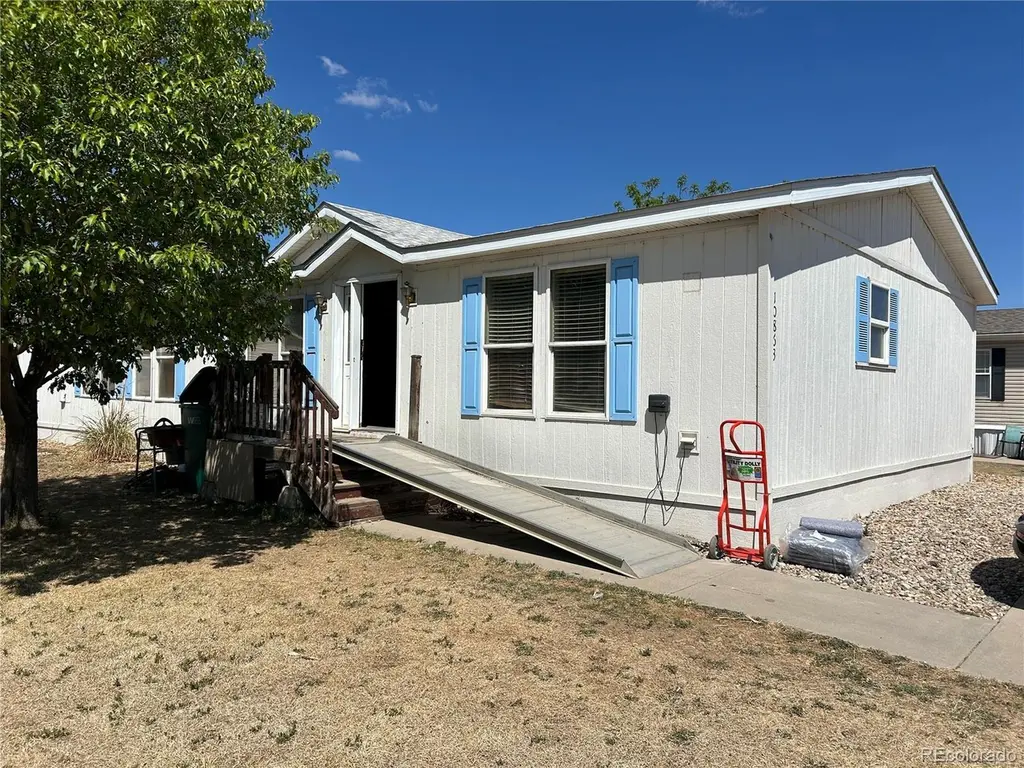
10863 Baily St · Firestone, CO
Flood risk No data
- FEMA flood zone
- —
- Chance of flooding over 30 yrs
- —
- Est. flood insurance / yr
- —
Fire risk No data
- Est. fire insurance / yr
- —
Heat risk No data
- Hot days now (above threshold)
- —
- Hot days in 30 yrs
- —
Wind risk No data
- Chance of severe wind over 30 yrs
- —
Air-quality risk No data
- Unhealthy air days now
- —
- Unhealthy air days in 30 yrs
- —
Risk factors via First Street. Map © Google.
Why this score? — see what drove the B+ grade
The composite is a weighted blend of 9 inputs, each scored 0–100. Each bar is that input's sub-score; the figure is the points it added to the 100-point composite (weight × sub-score).
- Cash flow +30.0/30.0
- ARV discount +15.0/15.0
- 1% rule +10.0/10.0
- DSCR +10.0/10.0
- Schools +3.8/10.0
- Livability +3.7/5.0
- Condition / age +2.2/5.0
- Rent growth +1.9/5.0
- Appreciation +0.0/10.0
$89,900
🖨 Deal sheet 📄 Offer letter ✓ Due diligence
Key facts
- Built 2001
- Listed 42 days
Property features AI
Finance
- HOA & community: Land lease in effect through December 31, 2026; Monthly land lease fee of $1,000
Exterior
- Utilities: Public water; Community sewer
- Home design: Manufactured in park (Manufactured Home); Individual ownership
- Construction: Vinyl siding construction; Approximately 1,792 above-grade finished living area
- Exterior features: Composition roof; Located in Eagle Crest Minor park; Lot designated as Lot 109
Interior
- Bedrooms: 3 bedrooms (all on the main level)
- Bathrooms: 2 full bathrooms (both on the main level)
- Heating & cooling: Forced air heating; Central air conditioning
- Interior features: Three bedrooms located on the main level; Two full bathrooms on the main level
Neighborhood map
What this means for you Summary
Snapshot
- This is a 3-bed/2.0-bath manufactured listed at $90k. Condition is rated fair.
Deal economics
- At list price, monthly cash flow is $2k ($18k/yr) — positive.
- The deal already cash-flows at list — no discount required.
- Meets the 1% rule at list price ($3k rent vs $90k).
- Recommended offer: $87k (3.0% below list) — sets the bar for market timing.
- Cap rate 26.3% vs local median 2.9% in Firestone — top-decile yield for the area; either an underpriced asset or a hidden risk that comps aren't pricing in. Stress-test before assuming the spread holds.
Location & tenants
- Location reads 73/100 on livability (#44 in CO) — a middle-class / working-renter tenant base. Strengths: employment A+, housing A+, crime A; Watch: amenities F, commute F, cost of living F.
- St. Vrain Valley School District No. Re1J (suburban): math 32% / reading 51% proficiency, ranked #23 of 86 in CO (top 27%) — families likely to look elsewhere, expect single-tenant / working-renter base with shorter leases.
- Zoned schools: Centennial Elementary (math 32% / reading 47%, grade F, #357 of 966 statewide, top 40%, 468 students, 33% FRL); Coal Ridge Middle School (math 23% / reading 46%, grade F, #106 of 270 statewide, top 42%, 800 students, 32% FRL); Mead High School (math 34% / reading 59%, grade D-, #137 of 381 statewide, top 36%, 1,119 students, 25% FRL) — zoned schools at 30% FRL track the district average.
- Market conditions: Rents soft (-2.3%/yr); 534 active listings in the ZIP; 7 comparable units currently listed for rent nearby; rentals at typical pace (median 21d on market — plan ~3-4 weeks tenant-placement turnaround); high-income renter base; 3,170 units permitted in Weld County in 2024 (278 in 5+ unit buildings).
Forward outlook
- Local home prices are declining (-3.0%/yr); year-one equity from $622 of loan paydown is wiped out by about $3k of value loss. Plan a longer hold.
- Weld County population projected at +46% by 2050 — long-run rental-demand tailwind backs the buy-and-hold thesis.
- At projected returns (-3.0% appreciation + 0.0% rent growth), your $25k cash investment doubles in ~2 years — after that, you're playing with house money.
Negotiation context
- It's been on market 43 days — a 3% lower offer ($87k) is reasonable based on typical stale-listing flexibility.
Questions for the listing agent
- It's been on market 43 days. Have you received any prior offers? Is the seller open to a 3% concession, seller financing, or rate buy-down credit?
- Have any recent inspections been done? Can we get a copy of the seller's disclosures and any deferred-maintenance estimates?
- Is there a deadline driving the sale (1031 exchange, divorce, estate, relocation)? That informs how much negotiation room exists.
- What's the average days-on-market for RENTAL listings here right now (not sales)? A rising rental-DOM trend means longer vacancies and softer asking-rent achievability than the comps imply.
- What's the recent tenant-quality profile in this submarket — average credit score on applications, eviction rate, late-payment / NSF rate, and stable-employment percentage? A property-management company in the area should have these aggregated.
- How much new for-sale + rental construction is in the pipeline within 1–3 miles? Heavy new supply typically softens prices + rents 12–24 months out; constrained supply supports both.
Investment metrics
- 1% rule
- 2.99% ✓
- Cap rate
- 26.31%
- Cash-on-cash
- 71.49%
- DSCR
- 4.18
- GRM
- 2.8
CMA / ARV
- ARV (on-the-fly)
- $164,864
- Comps found
- 5
Show comp detail 5 sales within ~0.75 mi
| Address | Dist | Beds/Ba | Sqft | Sold | Price | $/sf | Match |
|---|---|---|---|---|---|---|---|
| 4899 Barron Cir | 0.33mi | 4/2.0 (+1) | 1,944 (+8%) | 2mo | $103,000 | $53 | 64 |
| 4892 Barron Cir | 0.35mi | 4/2.0 (+1) | 1,680 (-6%) | 9mo | $163,400 | $97 | 60 |
| 10545 Bedford St #235 | 0.32mi | 4/2.0 (+1) | 1,680 (-6%) | 18mo | $140,000 | $83 | 55 |
| 10655 Titan Ave | 0.35mi | 4/2.0 (+1) | 1,568 (-12%) | 18mo | $145,000 | $92 | 43 |
| 10655 Titan Ave #324 | 0.35mi | 4/2.0 (+1) | 1,528 (-15%) | 18mo | $145,000 | $95 | 40 |
Match score weights: distance 35% · size 25% · config 20% · recency 20%. Top-matched comps best support the ARV.
Projected returns pro-forma
-3.0% appreciation · 0.0% rent growth · sell at horizon
- IRR
- 67.7%
- Equity multiple
- 3.90×
- Total profit
- $73,115
- Equity at exit
- $13,404
- IRR
- 71.0%
- Equity multiple
- 7.21×
- Total profit
- $156,410
- Equity at exit
- $7,773
Cash invested: $25,172 (down + closing). Projections, not guarantees.
Landlord ↔ Tenant lean methodology
- Overall (STATE)
- 38 Tenant-Leaning
- State Colorado
- 38 Tenant-Leaning · D+4
- County
- — inherits STATE
- City
- — inherits STATE
ZIP-level market 80504
- Rents YoY
- -2.3%
- Active inventory
- 534
- Price-to-rent
- 2.8×
Monthly cashflow live
- Estimated rent
- $2,685 high interval (Pro) →
- Mortgage (P&I)
- −$471
- Tax est. 1.5%
- −$112 /mo · $1,348/yr
- Insurance
- −$37
- HOA
- −$0
- Vacancy / Maint / Mgmt
- −$564
- Net cashflow
- $1,500
Break-even live
UW: 25.0% down · 7.5% · 30yr · 1.5% tax · 5.0% vac · 8.0% maint · 8.0% mgmt
Financing live
Cash to close
- Down payment
- $22,475
- Closing costs
- $2,697
- Reserves months
- —
- Total cash needed
- —
Loan-product check · same deal, 3 products live
Conventional
25% down · 7.5% · 30yr
- Down + closing
- —
- Monthly P&I
- —
- Monthly cashflow
- —
- DSCR
- —
- Eligible?
- —
Personal DTI + credit; lowest rate.
DSCR
20% down · 8.5% · 30yr
- Down + closing
- —
- Monthly P&I
- —
- Monthly cashflow
- —
- DSCR
- —
- Eligible?
- —
No personal income docs; deal must DSCR.
Hard money
10% down · 12.0% · 12mo
- Down + closing
- —
- Monthly P&I
- —
- Monthly cashflow
- —
- DSCR
- —
- Eligible?
- —
Short-term bridge; refi at stabilization.
Rent comps 7 comps
| Address | Beds | Baths | Sqft | Rent | $/sqft | DOM | Units | Dist |
|---|---|---|---|---|---|---|---|---|
| 10670 Jake Jabs Blvd Firestone, CO | 1.0–3.0 | 1.0–2.0 | 1036 | $2,595 | $2.50 | 13d | 26 | 0.49mi |
| 5620 Tumbleweed Ave Firestone, CO | 3.0 | 2.0 | 1747 | $3,200 | $1.83 | 20d | 1 | 0.75mi |
| 10818 Cimarron St #1202 Firestone, CO | 2.0 | 2.0 | 1823 | $2,500 | $1.37 | 20d | 1 | 1.00mi |
| 10692 Durango Pl Longmont, CO | 3.0 | 2.0 | 1500 | $2,395 | $1.60 | 20d | 1 | 1.24mi |
| 10426 Durango Pl Longmont, CO | 3.0 | 2.0 | 1500 | $2,350 | $1.57 | 20d | 1 | 1.32mi |
| 4347 Rangeview Cir Longmont, CO | 3.0–5.0 | 2.0–3.0 | 2143 | $2,995 | $1.40 | 13d | 4 | 1.36mi |
| 10489 Taylor Ave Firestone, CO | 3.0 | 2.0 | 1386 | $2,499 | $1.80 | 13d | 1 | 1.47mi |
Listing history 16 events
-
2026-06-18days on market $89,900 Active 43 DOM
-
2026-06-17days on market $89,900 Active 42 DOM
-
2026-06-16days on market $89,900 Active 41 DOM
-
2026-06-15days on market $89,900 Active 40 DOM
-
2026-06-14days on market $89,900 Active 38 DOM
-
2026-06-13days on market $89,900 Active 37 DOM
-
2026-06-09days on market $89,900 Active 34 DOM
-
2026-06-09days on market $89,900 Active 33 DOM
-
2026-06-07days on market $89,900 Active 32 DOM
-
2026-06-03price $89,900 Active 27 DOM
-
2026-06-02days on market $97,900 Active 27 DOM
-
2026-06-01days on market $97,900 Active 26 DOM
-
2026-05-31days on market $97,900 Active 25 DOM
-
2026-05-30days on market $97,900 Active 24 DOM
-
2026-05-12price $109,900
-
2026-05-06$119,900 Active
ⓘ Source: listings_history table (triggers on properties + properties_extension) + one-shot
backfill from property_details.listing_events for pre-trigger history.
Nearby sold comps map
Loading sold comps map…
Walkable amenities ~0.75 mi
Loading nearby amenities…
Taxation est. · year 1
- Rental income
- $32,216
- − Mortgage interest
- −$5,036
- − Property taxes
- −$1,348
- − Insurance
- −$450
- − Repairs & maintenance
- −$2,577
- − Management
- −$2,577
- − Depreciation
- −$2,615
- Taxable income
- $17,612
- Est. tax owed @ 24.0%
- −$4,227
- After-tax cash flow
- $13,768/yr
For passive investors: Depreciation is non-cash, so a rental often shows a tax loss while cash-flowing — sheltering income. Rental losses are passive: they offset passive income freely, and up to $25,000/yr can offset ordinary (W-2) income if you actively participate and your MAGI is under $100k (phasing out to $0 by $150k); unused losses carry forward. On sale, claimed depreciation is recaptured at up to 25%, and gains may owe capital-gains tax (a 1031 exchange can defer both). Figures are a year-1 estimate at your 24.0% rate — not tax advice; consult a CPA.
Condition & rehab AI · 12 photos
This manufactured home requires moderate renovations, focusing on exterior siding, kitchen cabinets, and bathroom fixtures. Fresh paint and updated fixtures will significantly enhance its curb appeal and interior aesthetics, making it more attractive for both resale and rental.
Repairs flagged
- Major exterior siding — Significant weathering and discoloration
- Major kitchen cabinets — Older style, in need of updating
- Minor bathroom fixtures — Standard fixtures, some wear
Value-add opportunities
- Both Paint interior walls — Fresh paint enhances curb appeal and interior aesthetics
- Both Replace kitchen cabinets — Modern cabinets improve functionality and aesthetics
- Both Update bathroom fixtures — Modern fixtures enhance functionality and aesthetics
Renovation cost estimate screening
| Repair item | Severity | Est. cost |
|---|---|---|
| exterior siding · Significant weathering and discoloration | Major | $15,000–50,000 |
| kitchen cabinets · Older style, in need of updating | Major | $15,000–50,000 |
| bathroom fixtures · Standard fixtures, some wear | Minor | $500–3,000 |
| Total estimated repair cost · 3 items | $30,500–103,000 |
Value-add ROI direction
- Both Paint interior walls — Fresh paint enhances curb appeal and interior aesthetics ↑
- Both Replace kitchen cabinets — Modern cabinets improve functionality and aesthetics ↑
- Both Update bathroom fixtures — Modern fixtures enhance functionality and aesthetics ↑
ⓘ Cost ranges are severity-bucket heuristics (US national rule-of-thumb). Get contractor quotes + a written scope before underwriting a rehab budget.
Schools (NCES district)
- District
- St. Vrain Valley School District No. Re1J
- NCES district ID
- 0805370
- Math proficiency
- 32% ▼ -8.00%
- Reading proficiency
- 51% ▬ 0.00%
- Median HH income
- $71,571
- Composite
- 37.73/100
- National rank
- #4353
- State rank
- #23 of 86 in CO
Livability — Firestone
- Score
- 73/100
- State rank
- #44
- US rank
- #5060
Category grades
Schools grade is shown separately in the Schools card above.
Census & demographics
- Census place
- Firestone, CO
- County
- Weld County · 332,652 people
- City population
- 1,684
- Metro
- Greeley, CO
- Population (ZIP)
- 63,451
- Household income
- $113,643
- Rent vs Own
- Severe rent burden
- 1028.0
Population outlook (Weld County) Hauer SSP2
- Today (2025)
- 351,957 people
- By 2030
- 385,304 · +9.5%
- By 2040
- 451,818 · +28.4%
- By 2050
- 514,478 · +46.2%
- By 2075
- 648,733 · +84.3%
- By 2100
- 720,400 · +104.7%
Race, ethnicity, and origin ACS 2023
- Neighborhood character
- Predominantly White (68%)
- Race & ethnicity
- White 68% Hispanic / Latino 24% Two or more races 13% Asian 3%
- Hispanic origin (detail)
- Mexican 18%
- Common ancestry
- Lithuanian 3% Italian 2% Iranian 2%
- Foreign-born
- 8% · Canada, Vietnam
- Languages at home
- 84% English-only · Spanish 13% Other Asian/Pacific 1%
Political lean MEDSL · Weld
- 2024 margin
- Strong R (+21.0) · D 38.2% · R 59.2% · Other 2.6%
- 2008→2024 swing
- -12.2pp toward R · 2008: -8.7pp · 2024: -21.0pp
- All cycles
- 2024: R+21.0 2020: R+18.0 2016: R+22.4 2012: R+13.2 2008: R+8.7
Not yet ingested
- Civics
- —
Market trends
- HPI YoY
- ▼ -534.45%
- Current HPI
- 245.1351
- Rent YoY
- ▼ -2.34%
- Metro
- Greeley, CO
- State GDP YoY
- ▲ 1.95%
- F500 in state
- 14
Industry mix (Fortune 500 HQ in CO)
| Industry | F500 HQs | Revenue |
|---|---|---|
| Technology Distribution | 1 | $31B |
|
||
| Food / Agriculture | 1 | $18B |
|
||
| Packaging | 1 | $14B |
|
||
| Healthcare | 1 | $13B |
|
||
| Energy | 1 | $10B |
|
||
| Technology | 1 | $4B |
|
||
Price history
-8.3% since first listed2 events — show timeline
- 2026-05-12 Price Changed $109,900 REColorado as Distributed by MLS Grid
- 2026-05-06 Listed $119,900 REColorado as Distributed by MLS Grid
Cash-flow waterfall
monthlySold comps — $/sqft
last 12 mo · ≤1 miLoading sold comps…