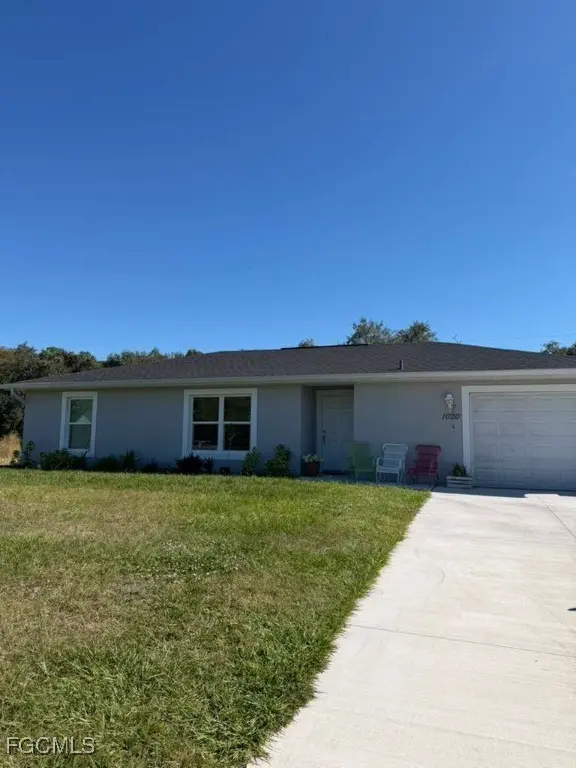
1020 Bucknell Ln · Port LaBelle, FL
Flood risk 1/10 · Minimal
- FEMA flood zone
- X (unshaded)
- Chance of flooding over 30 yrs
- 0.0%
- Est. flood insurance / yr
- $507 – $1,088
Fire risk 4/10 · Minor
- Est. fire insurance / yr
- $947 – $1,759
Heat risk 9/10 · Severe
- Hot days now (above 108°F)
- 7 days/yr
- Hot days in 30 yrs
- 26 days/yr
Wind risk 10/10 · Severe
- Chance of severe wind over 30 yrs
- 99.0%
Air-quality risk 2/10 · Minimal
- Unhealthy air days now
- 2 days/yr
- Unhealthy air days in 30 yrs
- 2 days/yr
Risk factors via First Street. Map © Google.
Why this score? — see what drove the D+ grade
The composite is a weighted blend of 9 inputs, each scored 0–100. Each bar is that input's sub-score; the figure is the points it added to the 100-point composite (weight × sub-score).
- Cash flow +10.4/30.0
- Appreciation +10.0/10.0
- ARV discount +9.6/15.0
- Schools +3.3/10.0
- Livability +3.1/5.0
- DSCR +3.0/10.0
- 1% rule +2.9/10.0
- Rent growth +2.5/5.0
- Condition / age +2.5/5.0
$280,000
🖨 Deal sheet 📄 Offer letter ✓ Due diligence
Listing remarks MLS
Beautiful move-in ready home located in LaBelle. No HOA and no CDD tax. Situated on a quiet cul-de-sac, this property offers a large backyard and a peaceful environment. Great opportunity — motivated seller.
Key facts
- Move-in ready
- Quiet cul-de-sac
- Large backyard
Tags
Neighborhood map
What this means for you Summary
Snapshot
- This is a 3-bed/2.0-bath single-family listed at $280k.
Deal economics
- At list price, monthly cash flow is $-151 ($-2k/yr) — negative.
- To cash-flow at today's rent, offer at most $253k (9.5% below list).
- To meet the 1% rule (rent ≥ 1% of price), the offer needs to be $220k (21.4% below list).
- Recommended offer: $220k (21.4% below list) — sets the bar for 1% rule.
Location & tenants
- Location reads 62/100 on livability (#750 in FL) — a middle-class / working-renter tenant base. Strengths: cost of living A+, housing A+; Watch: schools F, amenities F, commute F.
- Glades (town): math 38% / reading 41% proficiency, ranked #63 of 73 in FL (top 86%) — families likely to look elsewhere, expect single-tenant / working-renter base with shorter leases.
- Market conditions: 942 active listings in the ZIP; 6 comparable units currently listed for rent nearby; rentals at typical pace (median 20d on market — plan ~3-4 weeks tenant-placement turnaround); 65 units permitted in Glades County in 2024 (0 in 5+ unit buildings).
- At $2,200/mo this rent would consume 46% of the median local household income ($57k/yr) (locally 498% of renters already pay >50% of income on rent) — very limited rent-growth headroom before tenants either downsize or default.
Forward outlook
- In year one you build about $30k of equity ($2k loan paydown + $28k appreciation (10.0% local appreciation)).
- Glades County population projected at +15% by 2050 — long-run rental-demand tailwind backs the buy-and-hold thesis.
- By year 2, paydown + projected appreciation supports a ~$48k cash-out refi (75% LTV) — recoverable capital for the next deal without selling this one.
Negotiation context
- It's been on market 134 days — a 12% lower offer ($246k) is reasonable based on typical stale-listing flexibility.
- Current owner paid $15k; list at $280k implies a 1767% gain — meaningful room to come down on a strong offer.
Risks & watch-outs
- Climate carrying-cost: severe wind risk, 99% chance of damaging wind over 30y; extreme-heat days projected 7→26/yr by 2055 (HVAC capex compounding) — expect insurance premiums to compound above CPI over the hold.
Questions for the listing agent
- What do current leases actually rent for vs. the listed asking? Can we see a recent rent roll and the last 12 months of T-12 income?
- It's been on market 134 days. Have you received any prior offers? Is the seller open to a 21% concession, seller financing, or rate buy-down credit?
- Why hasn't it sold? Are there any deal-killer items the seller is aware of (foundation, flood, title, zoning, code violations)?
- Is there a deadline driving the sale (1031 exchange, divorce, estate, relocation)? That informs how much negotiation room exists.
- Schools are F-rated, which usually means shorter tenancies and higher turnover. Who's the typical renter profile here, and what's been the actual vacancy rate?
- The area grade is low — what's the realistic commute time and amenity access for the typical tenant pool here? Any planned neighborhood developments (good or bad) we should know about?
- What's the average days-on-market for RENTAL listings here right now (not sales)? A rising rental-DOM trend means longer vacancies and softer asking-rent achievability than the comps imply.
- What's the recent tenant-quality profile in this submarket — average credit score on applications, eviction rate, late-payment / NSF rate, and stable-employment percentage? A property-management company in the area should have these aggregated.
- How much new for-sale + rental construction is in the pipeline within 1–3 miles? Heavy new supply typically softens prices + rents 12–24 months out; constrained supply supports both.
Investment metrics
- 1% rule
- 0.79% ✗
- Cap rate
- 5.65%
- Cash-on-cash
- -2.31%
- DSCR
- 0.90
- GRM
- 10.6
CMA / ARV
- ARV (median comp)
- $293,950
- List price
- $280,000
- Delta
- -4.75%
- Verdict
- FAIR
- Comps
- 20 within 1.0 mi
Show comp detail 7 sales within ~0.75 mi
| Address | Dist | Beds/Ba | Sqft | Sold | Price | $/sf | Match |
|---|---|---|---|---|---|---|---|
| 1047 Jabara Ln | 0.38mi | 3/2.0 | 1,212 (0%) | 12mo | $261,250 | $216 | 72 |
| 1081 Jupiter Loop | 0.52mi | 3/2.0 | 1,191 (-2%) | 15mo | $240,000 | $202 | 61 |
| 1421 Jabara Cir | 0.29mi | 3/2.0 | 1,380 (+14%) | 10mo | $285,000 | $207 | 55 |
| 1429 Jabara Cir | 0.31mi | 3/2.0 | 1,390 (+15%) | 11mo | $270,000 | $194 | 52 |
| 1065 Jabara Cir | 0.39mi | 3/2.0 | 1,362 (+12%) | 15mo | $295,000 | $217 | 48 |
| 1035 March Ln | 0.56mi | 3/2.0 | 1,362 (+12%) | 9mo | $325,000 | $239 | 46 |
| 8013 Sandalwood Cir | 0.75mi | 3/2.0 | 1,356 (+12%) | 23mo | $303,750 | $224 | 26 |
Match score weights: distance 35% · size 25% · config 20% · recency 20%. Top-matched comps best support the ARV.
Projected returns pro-forma
10.0% appreciation · 3.0% rent growth · sell at horizon
- IRR
- 22.6%
- Equity multiple
- 2.82×
- Total profit
- $142,908
- Equity at exit
- $252,246
- IRR
- 20.3%
- Equity multiple
- 6.46×
- Total profit
- $428,394
- Equity at exit
- $543,978
Cash invested: $78,400 (down + closing). Projections, not guarantees.
Landlord ↔ Tenant lean methodology
- Overall (STATE)
- 87 Strongly Landlord-Friendly
- State Florida
- 87 Strongly Landlord-Friendly · R+3
- County
- — inherits STATE
- City
- — inherits STATE
ZIP-level market 33935
- Home prices YoY
- 16.3%
- Active inventory
- 942
- Price-to-rent
- 10.6×
Monthly cashflow live
- Estimated rent
- $2,200 high interval (Pro) →
- Mortgage (P&I)
- −$1,468
- Tax from tax record
- −$304 /mo · $3,645/yr
- Insurance
- −$117
- HOA
- −$0
- Vacancy / Maint / Mgmt
- −$462
- Net cashflow
- $-151
Break-even live
UW: 25.0% down · 7.5% · 30yr · 1.5% tax · 5.0% vac · 8.0% maint · 8.0% mgmt
Financing live
Cash to close
- Down payment
- $70,000
- Closing costs
- $8,400
- Reserves months
- —
- Total cash needed
- —
Loan-product check · same deal, 3 products live
Conventional
25% down · 7.5% · 30yr
- Down + closing
- —
- Monthly P&I
- —
- Monthly cashflow
- —
- DSCR
- —
- Eligible?
- —
Personal DTI + credit; lowest rate.
DSCR
20% down · 8.5% · 30yr
- Down + closing
- —
- Monthly P&I
- —
- Monthly cashflow
- —
- DSCR
- —
- Eligible?
- —
No personal income docs; deal must DSCR.
Hard money
10% down · 12.0% · 12mo
- Down + closing
- —
- Monthly P&I
- —
- Monthly cashflow
- —
- DSCR
- —
- Eligible?
- —
Short-term bridge; refi at stabilization.
Rent comps 6 comps
| Address | Beds | Baths | Sqft | Rent | $/sqft | DOM | Units | Dist |
|---|---|---|---|---|---|---|---|---|
| 1173 E Benbow Cir Labelle, FL | 3.0 | 2.0 | 1212 | $2,000 | $1.65 | 3d | 1 | 0.10mi |
| 1209 Banjo Ct Labelle, FL | 3.0 | 2.0 | 1440 | $2,050 | $1.42 | 23d | 1 | 0.29mi |
| 1088 Saturn Ct Labelle, FL | 4.0 | 2.0 | 1439 | $2,200 | $1.53 | 19d | 1 | 0.69mi |
| 8002 Vega Ct Labelle, FL | 3.0 | 2.0 | 1389 | $1,900 | $1.37 | 23d | 1 | 1.01mi |
| 8004 Spice Ct Labelle, FL | 3.0 | 2.0 | 1292 | $2,000 | $1.55 | 19d | 1 | 1.30mi |
| 8033 Melody Cir Labelle, FL | 3.0 | 2.0 | 1215 | $1,999 | $1.65 | 16d | 1 | 1.48mi |
Listing history 7 events
-
2026-06-02days on market $280,000 Active 134 DOM
-
2026-06-01days on market $280,000 Active 133 DOM
-
2026-05-31days on market $280,000 Active 132 DOM
-
2026-05-30days on market $280,000 Active 131 DOM
-
2026-01-29price $280,000 213-char remark
Show marketing remark (213 chars)
Beautiful move-in ready home located in LaBelle. No HOA and no CDD tax. Situated on a quiet cul-de-sac, this property offers a large backyard and a peaceful environment. Great opportunity — motivated seller.
-
2026-01-19$300,000 Active 213-char remark
Show marketing remark (213 chars)
Beautiful move-in ready home located in LaBelle. No HOA and no CDD tax. Situated on a quiet cul-de-sac, this property offers a large backyard and a peaceful environment. Great opportunity — motivated seller.
-
2020-11-06soldstatus $15,000
ⓘ Source: listings_history table (triggers on properties + properties_extension) + one-shot
backfill from property_details.listing_events for pre-trigger history.
Tax reassessment forecast FL · Resets to sale price
- Current annual tax
- $3,645 · $304/mo
- Projected year-2 tax
- $3,645 · $304/mo
- Expected delta
- $0/yr ($0/mo · 0.0%)
ⓘ Screening estimate from a state-policy table — verify with the county assessor before closing.
Climate risk First Street
- Flood 1/10 Low FEMA zone X (unshaded) · 0% chance over 30 yrs
- Wildfire 4/10 Moderate
- Heat 9/10 Extreme 7 d/yr ≥108°F today · 26 d/yr by 30 yrs out
- Wind 10/10 Extreme 99% chance of damaging wind over 30 yrs
- Air quality 2/10 Low 2 unhealthy d/yr today · 2 by 30 yrs out
Nearby sold comps map
Loading sold comps map…
Walkable amenities ~0.75 mi
Loading nearby amenities…
Taxation est. · year 1
- Rental income
- $26,402
- − Mortgage interest
- −$15,684
- − Property taxes
- −$3,645
- − Insurance
- −$1,400
- − Repairs & maintenance
- −$2,112
- − Management
- −$2,112
- − Depreciation
- −$8,145
- Taxable loss
- −$6,697
- Est. tax savings @ 24.0%
- +$1,607
- After-tax cash flow
- $-200/yr
For passive investors: Depreciation is non-cash, so a rental often shows a tax loss while cash-flowing — sheltering income. Rental losses are passive: they offset passive income freely, and up to $25,000/yr can offset ordinary (W-2) income if you actively participate and your MAGI is under $100k (phasing out to $0 by $150k); unused losses carry forward. On sale, claimed depreciation is recaptured at up to 25%, and gains may owe capital-gains tax (a 1031 exchange can defer both). Figures are a year-1 estimate at your 24.0% rate — not tax advice; consult a CPA.
Schools (NCES district)
- District
- Glades
- NCES district ID
- 1200660
- Math proficiency
- 38% ▼ -15.00%
- Reading proficiency
- 41% ▼ -5.00%
- Median HH income
- $36,758
- Composite
- 32.81/100
- National rank
- #5622
- State rank
- #63 of 73 in FL
Livability — Port LaBelle
- Score
- 62/100
- State rank
- #750
- US rank
- #16264
Category grades
Schools grade is shown separately in the Schools card above.
Census & demographics
- Census place
- Port LaBelle, FL
- County
- Hendry County · 23,186 people
- Metro
- Clewiston, FL
- Population (ZIP)
- 23,186
- Household income
- $57,009
- Rent vs Own
- Severe rent burden
- 498.0
Population outlook (Glades County) Hauer SSP2
- Today (2025)
- 14,901 people
- By 2030
- 15,463 · +3.8%
- By 2040
- 16,341 · +9.7%
- By 2050
- 17,158 · +15.1%
- By 2075
- 18,881 · +26.7%
- By 2100
- 19,164 · +28.6%
Race, ethnicity, and origin ACS 2023
- Neighborhood character
- Majority Hispanic (56%)
- Race & ethnicity
- Hispanic / Latino 56% White 39% Two or more races 21% Black 2% Native American 2%
- Hispanic origin (detail)
- Mexican 40% Puerto Rican 3% Cuban 5%
- Common ancestry
- Lithuanian 2% Serbian 2% Slovak 1%
- Foreign-born
- 27% · Canada, Jamaica
- Languages at home
- 50% English-only · Spanish 50%
Political lean MEDSL · Glades
- 2024 margin
- Solid R (+53.3) · D 23.1% · R 76.4%
- 2008→2024 swing
- -36.7pp toward R · 2008: -16.6pp · 2024: -53.3pp
- All cycles
- 2024: R+53.3 2020: R+46.2 2016: R+39.6 2012: R+18.6 2008: R+16.6
Not yet ingested
- Civics
- —
Market trends
- HPI YoY
- ▲ 75.20%
- Current HPI
- 537.4928
- Rent YoY
- —
- Metro
- Clewiston, FL
- State GDP YoY
- ▲ 3.28%
- F500 in state
- 36
Industry mix (Fortune 500 HQ in FL)
| Industry | F500 HQs | Revenue |
|---|---|---|
| Industrial Technology | 2 | $29B |
|
||
| Insurance | 2 | $17B |
|
||
| Retail | 1 | $60B |
|
||
| Technology Distribution | 1 | $58B |
|
||
| Homebuilding | 1 | $35B |
|
||
| Technology Manufacturing | 1 | $35B |
|
||
Price history
+1766.7% since first listed3 events — show timeline
- 2026-01-29 Price Changed $280,000 FORTMLS
- 2026-01-19 Listed $300,000 FORTMLS
- 2020-11-06 Sold (Public Records) $15,000 Public Records
Property tax history
+38.7%/yrLatest (2025): $3,645 · +1305.7% YoY. Source: county tax records.
Cash-flow waterfall
monthlySold comps — $/sqft
last 12 mo · ≤1 miLoading sold comps…