 Duplex
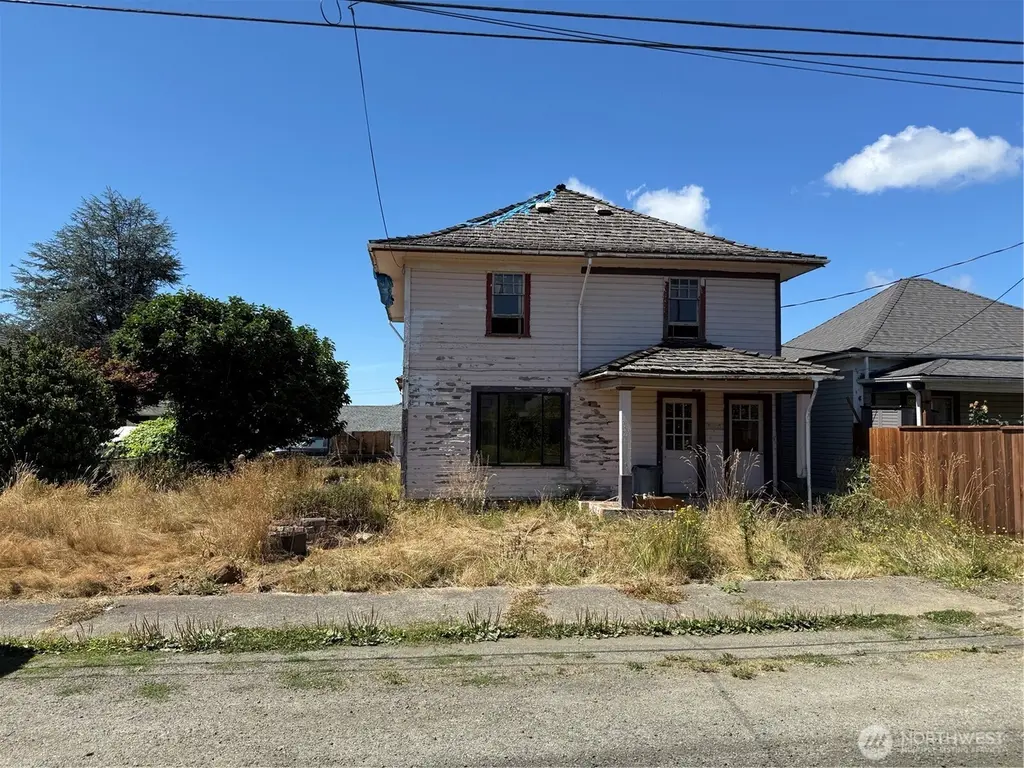
222 12th St · Raymond, WA
Flood risk 1/10 · Minimal
- FEMA flood zone
- X (unshaded)
- Chance of flooding over 30 yrs
- 0.0%
- Est. flood insurance / yr
- $507 – $1,088
Fire risk 1/10 · Minimal
- Est. fire insurance / yr
- $604 – $1,122
Heat risk 1/10 · Minimal
- Hot days now (above 82°F)
- 7 days/yr
- Hot days in 30 yrs
- 15 days/yr
Wind risk 1/10 · Minimal
- Chance of severe wind over 30 yrs
- —
Air-quality risk 6/10 · Moderate
- Unhealthy air days now
- 6 days/yr
- Unhealthy air days in 30 yrs
- 7 days/yr
Risk factors via First Street. Map © Google.
Why this score? — see what drove the B grade
The composite is a weighted blend of 9 inputs, each scored 0–100. Each bar is that input's sub-score; the figure is the points it added to the 100-point composite (weight × sub-score).
- Cash flow +30.0/30.0
- 1% rule +10.0/10.0
- DSCR +10.0/10.0
- ARV discount +7.5/15.0
- Livability +3.6/5.0
- Schools +3.5/10.0
- Rent growth +2.5/5.0
- Condition / age +2.5/5.0
- Appreciation +1.1/10.0
$139,000
🖨 Deal sheet (PDF) 📄 Offer letter ✓ Due diligence
Multi-family units
County records classify this as Multi-Family (2-4 Unit). Listing-text estimate: 2 units. confirmed
Listing remarks
Investment opportunity in Raymond! This two-story duplex sits on a double lot on the hill just above the city schools, and only a short walk to downtown Raymond and the Willapa River. The building has been taken down to the studs by the current owner, and will require some serious elbow grease before it's habitable again. But to a buyer willing to put the work in, this could once again become an income-producing property. Both units were rented on a steady basis for many years. Property is listed below Pacific County assessed value. Property is being sold "as-is. "
Key facts
- Double lot
- Two story duplex
- 6,098 sq ft lot
Tags
Property features AI
Finance
- Other: Lot size ~0.14 acres (60 x 100); Lot composed of lots 5 and 6; Possible uses: Multi-family, Residential
- Financial info: Listing requires cash; Total expenses reported: $1,330.48; Gross adjusted income and total monthly income reported as 0; Vacancy rate listed at 100%; Two units total
Exterior
- Parking: Five uncovered parking spaces
- Utilities: Public water (City of Raymond); Sewer connected (City of Raymond); Electric service (Pacific County PUD #2); energy source listed as electric (see remarks)
- Home design: Duplex (residential income, multi-family); Fixer condition; 2 stories; Built on pillar/post/pier foundation; Style code indicates duplex
- Construction: Wood construction; Shake roof
- Exterior features: Wood exterior; Alley access; Paved lot; Sidewalk
Interior
- Kitchen: No range/oven included in either unit; No refrigerator included in either unit; No dishwasher included in either unit
- Bedrooms: Two 2-bedroom units (one unit approx. 1,088 sq ft, one unit approx. 728 sq ft)
- Flooring: Softwood
- Bathrooms: Each unit has 1 bathroom
- Heating & cooling: No heating; No cooling
- Interior features: Softwood flooring
- Laundry & utility: No washer/dryer included in either unit
Neighborhood map
What this means for you Summary
Snapshot
- This is a 2 × 2-bed/1.0-bath units multifamily listed at $139k.
Deal economics
- At list price, monthly cash flow is $1k ($16k/yr) — positive. Per door: $656/mo.
- The deal already cash-flows at list — no discount required.
- Meets the 1% rule at list price ($3k rent vs $139k).
- Recommended offer: $135k (3.0% below list) — sets the bar for market timing.
- Cap rate 17.6% vs local median 4.0% in Raymond — top-decile yield for the area; either an underpriced asset or a hidden risk that comps aren't pricing in. Stress-test before assuming the spread holds.
Location & tenants
- Location reads 72/100 on livability (#212 in WA) — a middle-class / working-renter tenant base. Strengths: crime A+, cost of living A+, housing A+; Watch: schools D+, commute F.
- Raymond School District (rural): math 30% / reading 48% proficiency, ranked #231 of 291 in WA (top 79%) — families likely to look elsewhere, expect single-tenant / working-renter base with shorter leases.
- Market conditions: 92 active listings in the ZIP; 1 comparable units currently listed for rent nearby; 90 units permitted in Pacific County in 2024 (0 in 5+ unit buildings).
Forward outlook
- Local home prices are declining (-3.0%/yr); year-one equity from $961 of loan paydown is wiped out by about $4k of value loss. Plan a longer hold.
- Pacific County population projected at -10% by 2050 — secular population decline; favor cash flow + early exit over multi-decade hold.
- At projected returns (-3.0% appreciation + 3.0% rent growth), your $39k cash investment doubles in ~3 years — after that, you're playing with house money.
Negotiation context
- It's been on market 38 days — a 3% lower offer ($135k) is reasonable based on typical stale-listing flexibility.
- 3 sale attempts since 21y ago; this cycle's ask has dropped $10k (7%) from the opening price — seller is motivated, your offer sets the floor, not the list.
- Current owner paid $69k; list at $139k implies a 101% gain — meaningful room to come down on a strong offer.
Risks & watch-outs
- Watch-outs: built in 1904 — expect roof / HVAC / electrical / plumbing capex.
Questions for the listing agent
- It's been on market 38 days. Have you received any prior offers? Is the seller open to a 3% concession, seller financing, or rate buy-down credit?
- Can we see the unit-by-unit rent roll, current vacancy, and any below-market leases? What's the average tenancy length?
- What capital expenditures (roof, boiler, parking lot, exteriors) have been made in the last 5 years, and what's planned in the next 2?
- Built in 1904 — when were the roof, HVAC, electrical panel, plumbing, and water heater last replaced?
- Is there a deadline driving the sale (1031 exchange, divorce, estate, relocation)? That informs how much negotiation room exists.
- Schools are D-rated, which usually means shorter tenancies and higher turnover. Who's the typical renter profile here, and what's been the actual vacancy rate?
- What's the average days-on-market for RENTAL listings here right now (not sales)? A rising rental-DOM trend means longer vacancies and softer asking-rent achievability than the comps imply.
- What's the recent tenant-quality profile in this submarket — average credit score on applications, eviction rate, late-payment / NSF rate, and stable-employment percentage? A property-management company in the area should have these aggregated.
- How much new apartment / multifamily construction is in the pipeline within 1–3 miles? Heavy new supply (>2% of stock underway) typically softens rents 12–24 months out; light construction supports rent growth.
Investment metrics
- 1% rule
- 2.01% ✓
- Cap rate
- 17.62%
- Cash-on-cash
- 40.45%
- DSCR
- 2.80
- GRM
- 4.1
CMA / ARV
No comps found within radius.
Projected returns pro-forma
-3.0% appreciation · 3.0% rent growth · sell at horizon
- IRR
- 36.9%
- Equity multiple
- 2.57×
- Total profit
- $61,036
- Equity at exit
- $20,725
- IRR
- 43.5%
- Equity multiple
- 5.13×
- Total profit
- $160,755
- Equity at exit
- $12,018
Cash invested: $38,920 (down + closing). Projections, not guarantees.
Landlord ↔ Tenant lean methodology
- Overall (STATE)
- 28 Tenant-Leaning
- State Washington
- 28 Tenant-Leaning · D+8
- County
- — inherits STATE
- City
- — inherits STATE
ZIP-level market 98577
- Home prices YoY
- -2.8%
- Active inventory
- 92
- Price-to-rent
- 8.3×
Monthly cashflow live
- Estimated rent
- $2,797 medium interval (Pro) →
- Mortgage (P&I)
- −$729
- Tax from tax record
- −$111 /mo · $1,330/yr
- Insurance
- −$58
- HOA
- −$0
- Vacancy / Maint / Mgmt
- −$587
- Net cashflow
- $1,312
Break-even live
Sensitivity live
| Price | -10% $1,391 | -5% $1,351 | +0% $1,312 | +5% $1,273 | +10% $1,233 |
|---|---|---|---|---|---|
| Rent | -10% $1,091 | -5% $1,201 | +0% $1,312 | +5% $1,422 | +10% $1,533 |
| Rate | -1.0pp $1,382 | -0.5pp $1,347 | base $1,312 | +0.5pp $1,276 | +1.0pp $1,239 |
2-unit breakdown (identical units grouped — click to expand)
| Units | Beds | Baths | Est. rent |
|---|---|---|---|
| 2× units | 2 | 1 | $2,798 |
| #1 | 2 | 1 | $1,399 |
| #2 | 2 | 1 | $1,399 |
| Total (2 units) | $2,797 | ||
UW: 25.0% down · 7.5% · 30yr · 1.5% tax · 5.0% vac · 8.0% maint · 8.0% mgmt
Financing live
Cash to close
- Down payment
- $34,750
- Closing costs
- $4,170
- Reserves months
- —
- Total cash needed
- —
Loan-product check · same deal, 3 products live
Conventional
25% down · 7.5% · 30yr
- Down + closing
- —
- Monthly P&I
- —
- Monthly cashflow
- —
- DSCR
- —
- Eligible?
- —
Personal DTI + credit; lowest rate.
DSCR
20% down · 8.5% · 30yr
- Down + closing
- —
- Monthly P&I
- —
- Monthly cashflow
- —
- DSCR
- —
- Eligible?
- —
No personal income docs; deal must DSCR.
Hard money
10% down · 12.0% · 12mo
- Down + closing
- —
- Monthly P&I
- —
- Monthly cashflow
- —
- DSCR
- —
- Eligible?
- —
Short-term bridge; refi at stabilization.
Rent comps 1 comps
| Address | Beds | Baths | Sqft | Rent | $/sqft | DOM | Units | Dist |
|---|---|---|---|---|---|---|---|---|
| 945 Fowler St Raymond, WA | 4.0 | 1.5 | 1792 | $2,500 | $1.40 | 44d | 1 | 1.08mi |
Listing history 21 events
-
2026-06-21days on market $139,000 Active 38 DOM
-
2026-06-18days on market $139,000 Active 36 DOM
-
2026-06-17days on market $139,000 Active 35 DOM
-
2026-06-16days on market $139,000 Active 34 DOM
-
2026-06-15days on market $139,000 Active 33 DOM
-
2026-06-15days on market $139,000 Active 32 DOM
-
2026-06-13pricedays on market $139,000 Active 31 DOM
-
2026-06-12days on market $149,000 Active 30 DOM
-
2026-06-09days on market $149,000 Active 27 DOM
-
2026-06-08days on market $149,000 Active 26 DOM
-
2026-06-08days on market $149,000 Active 25 DOM
-
2026-06-05days on market $149,000 Active 23 DOM
-
2026-06-03days on market $149,000 Active 21 DOM
-
2026-06-02days on market $149,000 Active 20 DOM
-
2026-06-01days on market $149,000 Active 19 DOM
-
2026-05-31days on market $149,000 Active 18 DOM
-
2026-05-13$149,000 Active
-
2026-05-13$149,000 Active
-
2006-09-26soldstatus $69,000
-
2006-09-21soldstatus $66,000
-
2005-03-06$72,000
ⓘ Source: listings_history table (triggers on properties + properties_extension) + one-shot
backfill from property_details.listing_events for pre-trigger history.
Tax reassessment forecast WA · Resets to sale price
- Current annual tax
- $1,330 · $111/mo
- Projected year-2 tax
- $1,362 · $114/mo
- Expected delta
- +$32/yr (+$3/mo · 2.4%)
ⓘ Screening estimate from a state-policy table — verify with the county assessor before closing.
Climate risk First Street
- Flood 1/10 Low FEMA zone X (unshaded) · 0% chance over 30 yrs
- Wildfire 1/10 Low
- Heat 1/10 Low 7 d/yr ≥82°F today · 15 d/yr by 30 yrs out
- Wind 1/10 Low
- Air quality 6/10 Major 6 unhealthy d/yr today · 7 by 30 yrs out
Nearby sold comps map
Loading sold comps map…
Walkable amenities ~0.75 mi
Loading nearby amenities…
Taxation est. · year 1
- Rental income
- $33,564
- − Mortgage interest
- −$7,786
- − Property taxes
- −$1,330
- − Insurance
- −$695
- − Repairs & maintenance
- −$2,685
- − Management
- −$2,685
- − Depreciation
- −$4,044
- Taxable income
- $14,338
- Est. tax owed @ 24.0%
- −$3,441
- After-tax cash flow
- $12,302/yr
For passive investors: Depreciation is non-cash, so a rental often shows a tax loss while cash-flowing — sheltering income. Rental losses are passive: they offset passive income freely, and up to $25,000/yr can offset ordinary (W-2) income if you actively participate and your MAGI is under $100k (phasing out to $0 by $150k); unused losses carry forward. On sale, claimed depreciation is recaptured at up to 25%, and gains may owe capital-gains tax (a 1031 exchange can defer both). Figures are a year-1 estimate at your 24.0% rate — not tax advice; consult a CPA.
Schools (NCES district)
- District
- Raymond School District
- NCES district ID
- 5307140
- Math proficiency
- 30% ▲ 5.00%
- Reading proficiency
- 48% ▲ 2.00%
- Median HH income
- $38,441
- Composite
- 34.99/100
- National rank
- #9951
- State rank
- #231 of 291 in WA
Livability — Raymond
- Score
- 72/100
- State rank
- #212
- US rank
- #6045
Category grades
Schools grade is shown separately in the Schools card above.
Census & demographics
- Census place
- Raymond, WA
- Population (ZIP)
- 7,458
Population outlook (Pacific County) Hauer SSP2
- Today (2025)
- 20,636 people
- By 2030
- 20,137 · -2.4%
- By 2040
- 19,041 · -7.7%
- By 2050
- 18,504 · -10.3%
- By 2075
- 17,403 · -15.7%
- By 2100
- 16,241 · -21.3%
Race, ethnicity, and origin ACS 2023
- Neighborhood character
- Predominantly White (78%)
- Race & ethnicity
- White 78% Hispanic / Latino 11% Two or more races 7% Native American 2% Asian 1%
- Hispanic origin (detail)
- Mexican 11%
- Common ancestry
- Portuguese 5% Scotch-Irish 3% Romanian 3%
- Foreign-born
- 7% · Canada, South Korea
- Languages at home
- 89% English-only · Spanish 8% German/W. Germanic 2%
Political lean MEDSL · Pacific
- 2024 margin
- Toss-up / Even · D 48.1% · R 49.4% · Other 2.4%
- 2008→2024 swing
- -15.4pp toward R · 2008: 14.1pp · 2024: -1.3pp
- All cycles
- 2024: R+1.3 2020: R+1.1 2016: R+6.9 2012: D+11.4 2008: D+14.1
Not yet ingested
- Civics
- —
Market trends
- HPI YoY
- ▼ -7.88%
- Current HPI
- 271.0583
- Rent YoY
- —
- Metro
- —
- State GDP YoY
- ▲ 4.65%
- F500 in state
- 22
Industry mix (Fortune 500 HQ in WA)
| Industry | F500 HQs | Revenue |
|---|---|---|
| Retail | 2 | $269B |
|
||
| Technology / Retail | 1 | $638B |
|
||
| Technology | 1 | $245B |
|
||
| Telecommunications | 1 | $38B |
|
||
| Food / Beverage | 1 | $36B |
|
||
| Automotive / Trucks | 1 | $34B |
|
||
Price history
+106.9% since first listed5 events — show timeline
- 2026-05-13 Listed $149,000 NWMLS as Distributed by MLS Grid
- 2026-05-13 Listed $149,000 NWMLS as Distributed by MLS Grid
- 2006-09-26 Sold (MLS) $69,000 NWMLS as Distributed by MLS Grid
- 2006-09-21 Sold (Public Records) $66,000 Public Records
- 2005-03-06 Listed $72,000 NWMLS as Distributed by MLS Grid
Property tax history
+1.0%/yrLatest (2026): $1,330 · +3.4% YoY. Source: county tax records.
Cash-flow waterfall
monthlySold comps — $/sqft
last 12 mo · ≤1 miLoading sold comps…