 Duplex
96-18 Shore Front Pkwy · New York, NY
Flood risk 5/10 · Moderate
- FEMA flood zone
- X (unshaded)
- Chance of flooding over 30 yrs
- 0.51%
- Est. flood insurance / yr
- $507 – $1,088
Fire risk 1/10 · Minimal
- Est. fire insurance / yr
- $691 – $1,283
Heat risk 6/10 · Moderate
- Hot days now (above 96°F)
- 7 days/yr
- Hot days in 30 yrs
- 16 days/yr
Wind risk 8/10 · Major
- Chance of severe wind over 30 yrs
- 80.0%
Air-quality risk 3/10 · Minor
- Unhealthy air days now
- 4 days/yr
- Unhealthy air days in 30 yrs
- 4 days/yr
Risk factors via First Street. Map © Google.
Why this score? — see what drove the F grade
The composite is a weighted blend of 9 inputs, each scored 0–100. Each bar is that input's sub-score; the figure is the points it added to the 100-point composite (weight × sub-score).
- Appreciation +10.0/10.0
- Cash flow +7.8/30.0
- Schools +5.0/10.0
- Livability +3.8/5.0
- Rent growth +2.5/5.0
- Condition / age +2.5/5.0
- DSCR +1.9/10.0
- 1% rule +1.4/10.0
- ARV discount +0.0/15.0
$1,198,000
🖨 Deal sheet (PDF) 📄 Offer letter ✓ Due diligence
Multi-family units
County records classify this as Multi-Family (2-4 Unit). Listing-text estimate: 2 units. confirmed
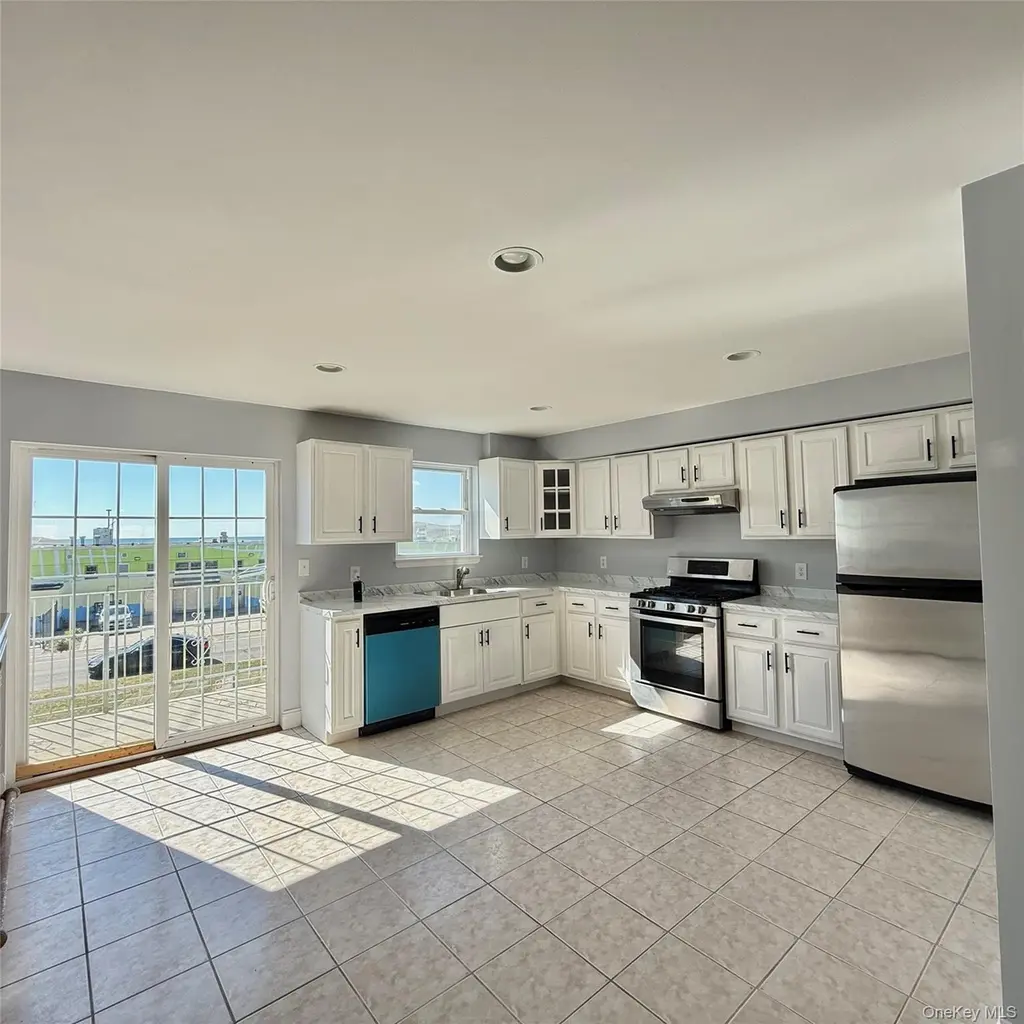
Listing remarks
Welcome to beautiful Rockaway Beach view house. close to train . Huge 2 -family 4000 building size with 3000 sqft living area and 1000 sqft basement . 1 fl - 2 bedroom 2 bathroom and living room with own heating system and thermostat . perfect income. 2 fl duplex 3 fl 4 bedroom with 3 bathroom . expansive balcony with beautiful ocean viewing sea breezes. Must see.
Key facts
- Own heating system
- Expansive balcony
- Basement
Tags
Property features AI
Finance
- Financial info: Tax year 2025
Exterior
- Parking: Driveway; One garage space
- Utilities: Public sewer; Electricity connected; Natural gas connected
- Home design: Duplex; 3,000 total building area (per appraiser)
- Construction: Aluminum siding construction
- Exterior features: Waterfront property; Aluminum siding
Interior
- Bedrooms: One 4-bedroom unit
- Bathrooms: Five full bathrooms
- Heating & cooling: Electric cooling; Heating via baseboard and natural gas
- Interior features: Other interior features; Basement with walk-out access
Neighborhood map
What this means for you Summary
Snapshot
- This is a 2 × 3-bed/2.5-bath units multifamily listed at $1.20M.
Deal economics
- At list price, monthly cash flow is $-1k ($-16k/yr) — negative. Per door: $-664/mo.
- To cash-flow at today's rent, offer at most $963k (19.6% below list).
- To meet the 1% rule (rent ≥ 1% of price), the offer needs to be $764k (36.3% below list).
- Recommended offer: $764k (36.3% below list) — sets the bar for 1% rule.
- Cap rate 5.0% vs local median 2.6% in New York — top-decile yield for the area; either an underpriced asset or a hidden risk that comps aren't pricing in. Stress-test before assuming the spread holds.
Location & tenants
- Location reads 75/100 on livability (#268 in NY, #4,188 nationally) — a middle-class / working-renter tenant base. Strengths: amenities A+, commute A+, health & safety A; Watch: crime F, cost of living F.
- Zoned schools: Elm Tree Elementary School (math 27% / reading 52%, grade F, #1,444 of 2,108 statewide, top 71%, 806 students, 94% FRL); Is 227 Louis Armstrong (math 52% / reading 69%, grade B+, #153 of 729 statewide, top 21%, 1,528 students, 68% FRL); Midwood High School (math 94% / reading 96%, grade A+, #83 of 1,100 statewide, top 8%, 4,062 students, 73% FRL).
- Market conditions: 67 active listings in the ZIP; 5,302 units permitted in Queens County in 2024 (4,918 in 5+ unit buildings).
Forward outlook
- In year one you build about $128k of equity ($8k loan paydown + $120k appreciation (10.0% local appreciation)).
- Queens County population projected at +16% by 2050 — long-run rental-demand tailwind backs the buy-and-hold thesis.
- By year 2, paydown + projected appreciation supports a ~$206k cash-out refi (75% LTV) — recoverable capital for the next deal without selling this one.
Negotiation context
- It's been on market 82 days — a 6% lower offer ($1.13M) is reasonable based on typical stale-listing flexibility.
- Current owner paid $431k; list at $1.20M implies a 178% gain — meaningful room to come down on a strong offer.
Risks & watch-outs
- Climate carrying-cost: moderate flood risk; severe wind risk, 80% chance of damaging wind over 30y; extreme-heat days projected 7→16/yr by 2055 (HVAC capex compounding) — expect insurance premiums to compound above CPI over the hold.
Questions for the listing agent
- What do current leases actually rent for vs. the listed asking? Can we see a recent rent roll and the last 12 months of T-12 income?
- It's been on market 82 days. Have you received any prior offers? Is the seller open to a 36% concession, seller financing, or rate buy-down credit?
- Can we see the unit-by-unit rent roll, current vacancy, and any below-market leases? What's the average tenancy length?
- What capital expenditures (roof, boiler, parking lot, exteriors) have been made in the last 5 years, and what's planned in the next 2?
- Why hasn't it sold? Are there any deal-killer items the seller is aware of (foundation, flood, title, zoning, code violations)?
- Is there a deadline driving the sale (1031 exchange, divorce, estate, relocation)? That informs how much negotiation room exists.
- Schools are B-rated — typically a magnet for longer-tenancy family renters. What's the average tenant stay here, and is there a school-zone premium baked into asking?
- Crime grade is F in this area — have there been break-ins, vandalism, or insurance claims at this property in the last 3 years? What carrier currently insures it and at what premium?
- The area grade is low — what's the realistic commute time and amenity access for the typical tenant pool here? Any planned neighborhood developments (good or bad) we should know about?
- What's the average days-on-market for RENTAL listings here right now (not sales)? A rising rental-DOM trend means longer vacancies and softer asking-rent achievability than the comps imply.
- What's the recent tenant-quality profile in this submarket — average credit score on applications, eviction rate, late-payment / NSF rate, and stable-employment percentage? A property-management company in the area should have these aggregated.
- How much new apartment / multifamily construction is in the pipeline within 1–3 miles? Heavy new supply (>2% of stock underway) typically softens rents 12–24 months out; light construction supports rent growth.
Investment metrics
- 1% rule
- 0.64% ✗
- Cap rate
- 4.96%
- Cash-on-cash
- -4.75%
- DSCR
- 0.79
- GRM
- 13.1
CMA / ARV
- ARV (on-the-fly)
- $939,000
- Comps found
- 1
Show comp detail 1 sale within ~0.75 mi
| Address | Dist | Beds/Ba | Sqft | Sold | Price | $/sf | Match |
|---|---|---|---|---|---|---|---|
| 2-16 Beach 98 St | 0.15mi | 5/3.0 (-1) | 2,902 (-3%) | 5mo | $907,000 | $313 | 70 |
Match score weights: distance 35% · size 25% · config 20% · recency 20%. Top-matched comps best support the ARV.
Projected returns pro-forma
10.0% appreciation · 3.0% rent growth · sell at horizon
- IRR
- 20.9%
- Equity multiple
- 2.69×
- Total profit
- $567,396
- Equity at exit
- $1,079,253
- IRR
- 18.9%
- Equity multiple
- 6.18×
- Total profit
- $1,736,539
- Equity at exit
- $2,327,451
Cash invested: $335,440 (down + closing). Projections, not guarantees.
Landlord ↔ Tenant lean methodology
- Overall (CITY)
- 0 Strongly Tenant-Friendly
- State New York
- 15 Strongly Tenant-Friendly · D+10
- County
- — inherits STATE
- City New York
- 0 Strongly Tenant-Friendly · D+34
ZIP-level market 11693
- Home prices YoY
- 17.7%
- Active inventory
- 67
- Price-to-rent
- 26.1×
Monthly cashflow live
- Estimated rent
- $7,637 high interval (Pro) →
- Mortgage (P&I)
- −$6,282
- Tax from tax record
- −$580 /mo · $6,962/yr
- Insurance
- −$499
- HOA
- −$0
- Vacancy / Maint / Mgmt
- −$1,604
- Net cashflow
- $-1,329
Break-even live
Sensitivity live
| Price | -10% $-650 | -5% $-989 | +0% $-1,329 | +5% $-1,668 | +10% $-2,007 |
|---|---|---|---|---|---|
| Rent | -10% $-1,932 | -5% $-1,630 | +0% $-1,329 | +5% $-1,027 | +10% $-725 |
| Rate | -1.0pp $-725 | -0.5pp $-1,024 | base $-1,329 | +0.5pp $-1,639 | +1.0pp $-1,955 |
2-unit breakdown (identical units grouped — click to expand)
| Units | Beds | Baths | Est. rent |
|---|---|---|---|
| 2× units | 3 | 2.5 | $7,636 |
| #1 | 3 | 2.5 | $3,818 |
| #2 | 3 | 2.5 | $3,818 |
| Total (2 units) | $7,637 | ||
UW: 25.0% down · 7.5% · 30yr · 1.5% tax · 5.0% vac · 8.0% maint · 8.0% mgmt
Financing live
Cash to close
- Down payment
- $299,500
- Closing costs
- $35,940
- Reserves months
- —
- Total cash needed
- —
Loan-product check · same deal, 3 products live
Conventional
25% down · 7.5% · 30yr
- Down + closing
- —
- Monthly P&I
- —
- Monthly cashflow
- —
- DSCR
- —
- Eligible?
- —
Personal DTI + credit; lowest rate.
DSCR
20% down · 8.5% · 30yr
- Down + closing
- —
- Monthly P&I
- —
- Monthly cashflow
- —
- DSCR
- —
- Eligible?
- —
No personal income docs; deal must DSCR.
Hard money
10% down · 12.0% · 12mo
- Down + closing
- —
- Monthly P&I
- —
- Monthly cashflow
- —
- DSCR
- —
- Eligible?
- —
Short-term bridge; refi at stabilization.
Listing history 16 events
-
2026-06-21days on market $1,198,000 Active 82 DOM
-
2026-06-18days on market $1,198,000 Active 79 DOM
-
2026-06-17days on market $1,198,000 Active 78 DOM
-
2026-06-15days on market $1,198,000 Active 76 DOM
-
2026-06-13days on market $1,198,000 Active 74 DOM
-
2026-06-10pricedays on market $1,198,000 Active 70 DOM
-
2026-06-08days on market $1,298,000 Active 69 DOM
-
2026-06-08days on market $1,298,000 Active 68 DOM
-
2026-06-04days on market $1,298,000 Active 65 DOM
-
2026-06-03days on market $1,298,000 Active 64 DOM
-
2026-06-01days on market $1,298,000 Active 62 DOM
-
2026-05-31remarks 368-char remark
-
2026-05-31days on market $1,298,000 Active 61 DOM
-
2026-05-11price $1,298,000
-
2026-03-31$1,398,000 Active
-
2003-11-18soldstatus $431,059
ⓘ Source: listings_history table (triggers on properties + properties_extension) + one-shot
backfill from property_details.listing_events for pre-trigger history.
Tax reassessment forecast NY · Partial reset (capped growth)
- Current annual tax
- $6,962 · $580/mo
- Projected year-2 tax
- $13,604 · $1,134/mo
- Expected delta
- +$6,642/yr (+$553/mo · 95.4%)
ⓘ Screening estimate from a state-policy table — verify with the county assessor before closing.
Climate risk First Street
- Flood 5/10 Major FEMA zone X (unshaded) · 51% chance over 30 yrs
- Wildfire 1/10 Low
- Heat 6/10 Major 7 d/yr ≥96°F today · 16 d/yr by 30 yrs out
- Wind 8/10 Severe 80% chance of damaging wind over 30 yrs
- Air quality 3/10 Moderate 4 unhealthy d/yr today · 4 by 30 yrs out
Nearby sold comps map
Loading sold comps map…
Walkable amenities ~0.75 mi
Loading nearby amenities…
Taxation est. · year 1
- Rental income
- $91,644
- − Mortgage interest
- −$67,107
- − Property taxes
- −$6,962
- − Insurance
- −$5,990
- − Repairs & maintenance
- −$7,332
- − Management
- −$7,332
- − Depreciation
- −$34,851
- Taxable loss
- −$37,929
- Est. tax savings @ 24.0%
- +$9,103
- After-tax cash flow
- $-6,840/yr
For passive investors: Depreciation is non-cash, so a rental often shows a tax loss while cash-flowing — sheltering income. Rental losses are passive: they offset passive income freely, and up to $25,000/yr can offset ordinary (W-2) income if you actively participate and your MAGI is under $100k (phasing out to $0 by $150k); unused losses carry forward. On sale, claimed depreciation is recaptured at up to 25%, and gains may owe capital-gains tax (a 1031 exchange can defer both). Figures are a year-1 estimate at your 24.0% rate — not tax advice; consult a CPA.
Schools (NCES district)
No district data.
Livability — New York
- Score
- 75/100
- State rank
- #268
- US rank
- #4188
Category grades
Schools grade is shown separately in the Schools card above.
Census & demographics
- Census place
- New York, NY
- City population
- 7,731,280
- Population (ZIP)
- 13,066
Population outlook (Queens County) Hauer SSP2
- Today (2025)
- 2,546,320 people
- By 2030
- 2,643,059 · +3.8%
- By 2040
- 2,815,563 · +10.6%
- By 2050
- 2,944,423 · +15.6%
- By 2075
- 3,123,338 · +22.7%
- By 2100
- 3,098,688 · +21.7%
Race, ethnicity, and origin ACS 2023
- Neighborhood character
- Diverse neighborhood (Simpson 0.70)
- Race & ethnicity
- White 44% Black 24% Hispanic / Latino 22% Two or more races 11% Asian 5%
- Hispanic origin (detail)
- Puerto Rican 8% Dominican 4% Salvadoran 1%
- Common ancestry
- Romanian 5% Scotch-Irish 4% Subsaharan African 2%
- Foreign-born
- 25% · Canada, Jamaica, China
- Languages at home
- 67% English-only · Spanish 16% Russian/Polish/Slavic 8% Other Indo-European 3%
Political lean MEDSL · Queens
- 2024 margin
- Strong D (+24.6) · D 62.3% · R 37.7%
- 2008→2024 swing
- -26.2pp toward R · 2008: 50.8pp · 2024: 24.6pp
- All cycles
- 2024: D+24.6 2020: D+45.2 2016: D+53.4 2012: D+58.5 2008: D+50.8
Not yet ingested
- Civics
- —
Market trends
- HPI YoY
- ▲ 121.58%
- Current HPI
- 807.44
- Rent YoY
- —
- Metro
- —
- State GDP YoY
- ▲ 2.60%
- F500 in state
- 92
Industry mix (Fortune 500 HQ in NY)
| Industry | F500 HQs | Revenue |
|---|---|---|
| Financial Services | 10 | $950B |
|
||
| Consumer Goods | 9 | $162B |
|
||
| Insurance | 4 | $225B |
|
||
| Telecommunications | 2 | $144B |
|
||
| Pharmaceuticals | 2 | $112B |
|
||
| Media / Entertainment | 2 | $69B |
|
||
Price history
+201.1% since first listed3 events — show timeline
- 2026-05-11 Price Changed $1,298,000 OneKey® MLS as Distributed by MLS Grid
- 2026-03-31 Listed $1,398,000 OneKey® MLS as Distributed by MLS Grid
- 2003-11-18 Sold (Public Records) $431,059 Public Records
Property tax history
+6.1%/yrLatest (2025): $6,962 · +2.2% YoY. Source: county tax records.
Cash-flow waterfall
monthlySold comps — $/sqft
last 12 mo · ≤1 miLoading sold comps…