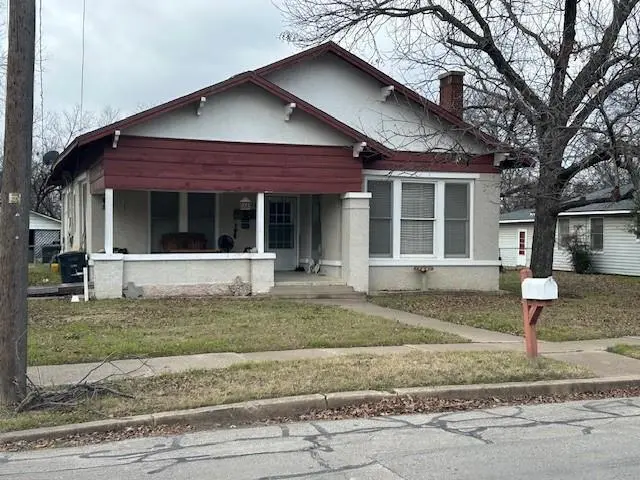
1313 N Robinson St · Cleburne, TX
Flood risk 1/10 · Minimal
- FEMA flood zone
- X (unshaded)
- Chance of flooding over 30 yrs
- 0.0%
- Est. flood insurance / yr
- $507 – $1,088
Fire risk 5/10 · Moderate
- Est. fire insurance / yr
- $1,222 – $2,270
Heat risk 7/10 · Major
- Hot days now (above 109°F)
- 7 days/yr
- Hot days in 30 yrs
- 24 days/yr
Wind risk 6/10 · Moderate
- Chance of severe wind over 30 yrs
- 27.0%
Air-quality risk 2/10 · Minimal
- Unhealthy air days now
- 1 days/yr
- Unhealthy air days in 30 yrs
- 2 days/yr
Risk factors via First Street. Map © Google.
Why this score? — see what drove the C grade
The composite is a weighted blend of 9 inputs, each scored 0–100. Each bar is that input's sub-score; the figure is the points it added to the 100-point composite (weight × sub-score).
- Cash flow +18.9/30.0
- ARV discount +14.5/15.0
- DSCR +5.9/10.0
- 1% rule +5.1/10.0
- Livability +3.4/5.0
- Schools +2.9/10.0
- Rent growth +2.5/5.0
- Condition / age +2.5/5.0
- Appreciation +0.0/10.0
$175,000
🖨 Deal sheet (PDF) 📄 Offer letter ✓ Due diligence
Listing remarks MLS
Come see this cute home with a large front porch. This would be a good starter or a perfect rental for income.
Key facts
- Large front porch
- 0.23 acre lot
- Built 1940
Tags
Neighborhood map
What this means for you Summary
Snapshot
- This is a 3-bed/1.0-bath single-family listed at $175k.
Deal economics
- At list price, monthly cash flow is $178 ($2k/yr) — positive.
- The deal already cash-flows at list — no discount required.
- Meets the 1% rule at list price ($2k rent vs $175k).
- Recommended offer: $154k (12.0% below list) — sets the bar for market timing.
- Cap rate 7.5% vs local median 3.6% in Cleburne — top-decile yield for the area; either an underpriced asset or a hidden risk that comps aren't pricing in. Stress-test before assuming the spread holds.
Location & tenants
- Location reads 68/100 on livability (#460 in TX) — a middle-class / working-renter tenant base. Strengths: cost of living A+, housing A+, health & safety A+; Watch: employment C-, amenities F, commute F.
- Cleburne ISD (town): math 34% / reading 33% proficiency, ranked #537 of 826 in TX (top 65%) — families likely to look elsewhere, expect single-tenant / working-renter base with shorter leases.
- Zoned schools: Irving El (math 26% / reading 26%, grade F, #2,954 of 4,322 statewide, top 69%, 521 students, 83% FRL); Ad Wheat Middle (math 31% / reading 29%, grade F, #1,056 of 1,662 statewide, top 65%, 703 students, 76% FRL); Cleburne H S (math 46% / reading 38%, grade F, #730 of 1,632 statewide, top 47%, 1,976 students, 67% FRL) — zoned schools average 75% FRL vs 56% district-wide (20 pts higher); higher-poverty schools than district average — tighter screening recommended.
- Market conditions: 338 active listings in the ZIP; 34 comparable units currently listed for rent nearby; rentals at typical pace (median 26d on market — plan ~3-4 weeks tenant-placement turnaround); 2,152 units permitted in Johnson County in 2024 (76 in 5+ unit buildings).
Forward outlook
- Local home prices are declining (-3.0%/yr); year-one equity from $1k of loan paydown is wiped out by about $5k of value loss. Plan a longer hold.
- Johnson County population projected at +24% by 2050 — long-run rental-demand tailwind backs the buy-and-hold thesis.
Negotiation context
- It's been on market 150 days — a 12% lower offer ($154k) is reasonable based on typical stale-listing flexibility.
- 2 sale attempts since 23y ago with the ask held roughly flat each time — persistent listings suggest the price (not the market) is what's stuck; bring a comps-based counter.
Risks & watch-outs
- Watch-outs: built in 1940 — expect roof / HVAC / electrical / plumbing capex.
- Climate carrying-cost: major wind risk, 27% chance of damaging wind over 30y; moderate wildfire risk; extreme-heat days projected 7→24/yr by 2055 (HVAC capex compounding) — expect insurance premiums to compound above CPI over the hold.
Questions for the listing agent
- It's been on market 150 days. Have you received any prior offers? Is the seller open to a 12% concession, seller financing, or rate buy-down credit?
- Built in 1940 — when were the roof, HVAC, electrical panel, plumbing, and water heater last replaced?
- Why hasn't it sold? Are there any deal-killer items the seller is aware of (foundation, flood, title, zoning, code violations)?
- Is there a deadline driving the sale (1031 exchange, divorce, estate, relocation)? That informs how much negotiation room exists.
- Schools are F-rated, which usually means shorter tenancies and higher turnover. Who's the typical renter profile here, and what's been the actual vacancy rate?
- What's the average days-on-market for RENTAL listings here right now (not sales)? A rising rental-DOM trend means longer vacancies and softer asking-rent achievability than the comps imply.
- What's the recent tenant-quality profile in this submarket — average credit score on applications, eviction rate, late-payment / NSF rate, and stable-employment percentage? A property-management company in the area should have these aggregated.
- How much new for-sale + rental construction is in the pipeline within 1–3 miles? Heavy new supply typically softens prices + rents 12–24 months out; constrained supply supports both.
Investment metrics
- 1% rule
- 1.01% ✓
- Cap rate
- 7.51%
- Cash-on-cash
- 4.36%
- DSCR
- 1.19
- GRM
- 8.2
CMA / ARV
- ARV (median comp)
- $207,454
- List price
- $175,000
- Delta
- -15.64%
- Verdict
- UNDERPRICED
- Comps
- 20 within 1.0 mi
Show comp detail 12 sales within ~0.75 mi
| Address | Dist | Beds/Ba | Sqft | Sold | Price | $/sf | Match |
|---|---|---|---|---|---|---|---|
| 1203 N Anglin St | 0.08mi | 3/1.0 | 1,407 (-7%) | 1mo | $150,000 | $107 | 84 |
| 1307 N Robinson St | 0.04mi | 3/2.0 | 1,444 (-4%) | 8mo | $232,900 | $161 | 80 |
| 822 N Robinson St | 0.36mi | 3/1.0 | 1,575 (+4%) | 2mo | $100,000 | $63 | 74 |
| 1510 N Wilhite St | 0.20mi | 3/2.0 | 1,421 (-6%) | 3mo | $249,000 | $175 | 74 |
| 1304 N Wood St | 0.49mi | 3/2.0 | 1,521 (+1%) | 3mo | $65,000 | $43 | 70 |
| 1802 N Wilhite St | 0.40mi | 3/2.0 | 1,364 (-10%) | 2mo | $195,000 | $143 | 60 |
| 707 Cedar St | 0.64mi | 3/2.0 | 1,424 (-6%) | 1mo | $269,000 | $189 | 56 |
| 741 N Robinson St | 0.52mi | 3/2.0 | 1,356 (-10%) | 4mo | $200,000 | $147 | 51 |
| 206 Williams Ave | 0.66mi | 3/2.0 | 1,630 (+8%) | 8mo | $325,000 | $199 | 46 |
| 214 Rose Ave | 0.47mi | 3/2.0 | 1,719 (+14%) | 7mo | $289,000 | $168 | 45 |
| 609 W Lone Star Ave | 0.66mi | 4/2.0 (+1) | 1,376 (-9%) | 8mo | $203,000 | $148 | 39 |
| 417 Rose Ave | 0.72mi | 4/2.0 (+1) | 1,643 (+9%) | 8mo | $300,000 | $183 | 36 |
Match score weights: distance 35% · size 25% · config 20% · recency 20%. Top-matched comps best support the ARV.
Projected returns pro-forma
-3.0% appreciation · 3.0% rent growth · sell at horizon
- IRR
- -9.5%
- Equity multiple
- 0.65×
- Total profit
- $-16,973
- Equity at exit
- $26,093
- IRR
- -0.0%
- Equity multiple
- 1.00×
- Total profit
- $-24
- Equity at exit
- $15,131
Cash invested: $49,000 (down + closing). Projections, not guarantees.
Landlord ↔ Tenant lean methodology
- Overall (STATE)
- 87 Strongly Landlord-Friendly
- State Texas
- 87 Strongly Landlord-Friendly · R+5
- County
- — inherits STATE
- City
- — inherits STATE
ZIP-level market 76031
- Home prices YoY
- -17.6%
- Active inventory
- 338
- Price-to-rent
- 8.2×
Monthly cashflow live
- Estimated rent
- $1,773 high interval (Pro) →
- Mortgage (P&I)
- −$918
- Tax from tax record
- −$232 /mo · $2,787/yr
- Insurance
- −$73
- HOA
- −$0
- Vacancy / Maint / Mgmt
- −$372
- Net cashflow
- $178
Break-even live
Sensitivity live
| Price | -10% $277 | -5% $228 | +0% $178 | +5% $129 | +10% $79 |
|---|---|---|---|---|---|
| Rent | -10% $38 | -5% $108 | +0% $178 | +5% $248 | +10% $318 |
| Rate | -1.0pp $266 | -0.5pp $223 | base $178 | +0.5pp $133 | +1.0pp $87 |
UW: 25.0% down · 7.5% · 30yr · 1.5% tax · 5.0% vac · 8.0% maint · 8.0% mgmt
Financing live
Cash to close
- Down payment
- $43,750
- Closing costs
- $5,250
- Reserves months
- —
- Total cash needed
- —
Loan-product check · same deal, 3 products live
Conventional
25% down · 7.5% · 30yr
- Down + closing
- —
- Monthly P&I
- —
- Monthly cashflow
- —
- DSCR
- —
- Eligible?
- —
Personal DTI + credit; lowest rate.
DSCR
20% down · 8.5% · 30yr
- Down + closing
- —
- Monthly P&I
- —
- Monthly cashflow
- —
- DSCR
- —
- Eligible?
- —
No personal income docs; deal must DSCR.
Hard money
10% down · 12.0% · 12mo
- Down + closing
- —
- Monthly P&I
- —
- Monthly cashflow
- —
- DSCR
- —
- Eligible?
- —
Short-term bridge; refi at stabilization.
Rent comps 34 comps
| Address | Beds | Baths | Sqft | Rent | $/sqft | DOM | Units | Dist |
|---|---|---|---|---|---|---|---|---|
| 114 Scurlock Ave Cleburne, TX | 4.0 | 2.0 | 1457 | $1,770 | $1.21 | 45d | 1 | 0.23mi |
| 226 Seclusion Dr Cleburne, TX | 3.0–4.0 | 2.0 | 1641 | $2,205 | $1.34 | 0d | 1 | 0.44mi |
| 1705 N Robinson St Cleburne, TX | 3.0 | 2.0 | 1076 | $1,450 | $1.35 | 26d | 1 | 0.52mi |
| 1705 N Robinson St Cleburne, TX | 3.0 | 1.5 | 1076 | $1,450 | $1.35 | 0d | 1 | 0.52mi |
| 1005 N Buffalo Ave Cleburne, TX | 3.0 | 1.0 | 1146 | $1,500 | $1.31 | 45d | 1 | 0.55mi |
| 1005 N Buffalo Ave Cleburne, TX | 3.0 | 1.0 | 1146 | $1,500 | $1.31 | 4d | 1 | 0.55mi |
| 1005 N Buffalo Ave Cleburne, TX | 3.0 | 1.0 | 1146 | $1,500 | $1.31 | 26d | 1 | 0.55mi |
| 514 Euclid St Cleburne, TX | 3.0 | 2.0 | 1152 | $1,595 | $1.38 | 45d | 1 | 0.62mi |
| 404 Rose Ave Cleburne, TX | 4.0 | 2.0 | 1763 | $2,225 | $1.26 | 0d | 1 | 0.69mi |
| 103 May Ave Cleburne, TX | 3.0 | 2.0 | 1262 | $1,795 | $1.42 | 8d | 1 | 0.72mi |
| 414 Rose Ave Cleburne, TX | 4.0 | 2.0 | 1763 | $2,214 | $1.26 | 3d | 1 | 0.73mi |
| 104 May Ave Cleburne, TX | 3.0 | 2.0 | 1164 | $1,550 | $1.33 | 45d | 1 | 0.74mi |
| 303 Eastland St Cleburne, TX | 3.0 | 3.0 | 1254 | $1,950 | $1.56 | 45d | 1 | 0.76mi |
| 1606 Granbury St Unit A Cleburne, TX | 3.0 | 2.0 | 1289 | $1,650 | $1.28 | 14d | 1 | 0.78mi |
| 1405 Granbury St Cleburne, TX | 3.0 | 1.0 | 1278 | $1,545 | $1.21 | 26d | 1 | 0.79mi |
| 612 N Robinson St Cleburne, TX | 3.0 | 2.5 | 1311 | $2,200 | $1.68 | 45d | 1 | 0.80mi |
| 1507 Granbury St Cleburne, TX | 3.0 | 2.0 | 1140 | $1,811 | $1.59 | 26d | 1 | 0.80mi |
| 438 Sabine Ave Cleburne, TX | 3.0 | 2.0 | 1230 | $1,650 | $1.34 | 14d | 1 | 0.81mi |
| 1005 Granbury St Unit A Cleburne, TX | 3.0 | 2.0 | 1362 | $2,050 | $1.51 | 26d | 1 | 0.86mi |
| 110 E Wilson St Unit B Cleburne, TX | 3.0 | 2.5 | 1400 | $1,900 | $1.36 | 26d | 1 | 0.90mi |
| 405 Madison St Unit Na Cleburne, TX | 3.0 | 2.0 | 1645 | $1,975 | $1.20 | 45d | 1 | 1.00mi |
| 1108 Poindexter Ave Cleburne, TX | 3.0 | 1.0 | 1300 | $1,550 | $1.19 | 45d | 1 | 1.11mi |
| 115 Cleburne Station Pkwy Cleburne, TX | 1.0–3.0 | 1.0–2.0 | 977 | $2,708 | $2.77 | 0d | 1 | 1.14mi |
| 413 Shaw St Cleburne, TX | 4.0 | 2.0 | 1713 | $2,100 | $1.23 | 45d | 1 | 1.15mi |
| 805 N Douglas Ave Cleburne, TX | 3.0 | 2.0 | 1460 | $1,999 | $1.37 | 45d | 1 | 1.16mi |
| 2205 Pipeline Rd Cleburne, TX | 2.0 | 1.0–2.0 | 949 | $1,308 | $1.38 | 0d | 53 | 1.17mi |
| 1315 Joslin St Cleburne, TX | 3.0 | 2.0 | 1294 | $1,595 | $1.23 | 9d | 1 | 1.17mi |
| 521 Woodard Ave Unit One Cleburne, TX | 2.0 | 1.0 | 1350 | $1,000 | $0.74 | 45d | 1 | 1.27mi |
| 1311 Manor Dr Cleburne, TX | 3.0 | 2.0 | 1492 | $1,825 | $1.22 | 26d | 1 | 1.35mi |
| 318 College St Unit B Cleburne, TX | 2.0 | 1.0 | 1256 | $1,150 | $0.92 | 26d | 1 | 1.40mi |
| 805 Bluffview Dr Cleburne, TX | 4.0 | 2.5 | 2203 | $2,245 | $1.02 | 45d | 1 | 1.41mi |
| 405 College St Cleburne, TX | 3.0 | 2.0 | 1396 | $1,650 | $1.18 | 8d | 1 | 1.44mi |
| 605 Mayfield Dr Cleburne, TX | 3.0 | 3.0 | 2140 | $2,340 | $1.09 | 45d | 1 | 1.47mi |
| 1434 Trail Creek Dr Cleburne, TX | 3.0–4.0 | 2.0 | 2129 | $2,350 | $1.10 | 23d | 1 | 1.50mi |
Listing history 19 events
-
2026-06-21days on market $175,000 Active 150 DOM
-
2026-06-18days on market $175,000 Active 147 DOM
-
2026-06-17days on market $175,000 Active 146 DOM
-
2026-06-16days on market $175,000 Active 145 DOM
-
2026-06-15days on market $175,000 Active 144 DOM
-
2026-06-13days on market $175,000 Active 142 DOM
-
2026-06-09days on market $175,000 Active 138 DOM
-
2026-06-08statusdays on market $175,000 Active 137 DOM
-
2026-06-07days on market $175,000 Active Option Contract 136 DOM
-
2026-06-04days on market $175,000 Active Option Contract 133 DOM
-
2026-06-03days on market $175,000 Active Option Contract 132 DOM
-
2026-06-02days on market $175,000 Active Option Contract 131 DOM
-
2026-06-02status $175,000 Active Option Contract 130 DOM
-
2026-06-01days on market $175,000 Active 130 DOM
-
2026-05-31days on market $175,000 Active 129 DOM
-
2026-01-19$175,000 Active 110-char remark
Show marketing remark (110 chars)
Come see this cute home with a large front porch. This would be a good starter or a perfect rental for income.
-
2003-06-18soldstatus
-
2003-05-22historical
-
2003-04-19$42,500
ⓘ Source: listings_history table (triggers on properties + properties_extension) + one-shot
backfill from property_details.listing_events for pre-trigger history.
Tax reassessment forecast TX · Resets to sale price
- Current annual tax
- $2,787 · $232/mo
- Projected year-2 tax
- $3,202 · $267/mo
- Expected delta
- +$416/yr (+$35/mo · 14.9%)
ⓘ Screening estimate from a state-policy table — verify with the county assessor before closing.
Climate risk First Street
- Flood 1/10 Low FEMA zone X (unshaded) · 0% chance over 30 yrs
- Wildfire 5/10 Major
- Heat 7/10 Severe 7 d/yr ≥109°F today · 24 d/yr by 30 yrs out
- Wind 6/10 Major 27% chance of damaging wind over 30 yrs
- Air quality 2/10 Low 1 unhealthy d/yr today · 2 by 30 yrs out
Nearby sold comps map
Loading sold comps map…
Walkable amenities ~0.75 mi
Loading nearby amenities…
Taxation est. · year 1
- Rental income
- $21,282
- − Mortgage interest
- −$9,803
- − Property taxes
- −$2,787
- − Insurance
- −$875
- − Repairs & maintenance
- −$1,703
- − Management
- −$1,703
- − Depreciation
- −$5,091
- Taxable loss
- −$679
- Est. tax savings @ 24.0%
- +$163
- After-tax cash flow
- $2,301/yr
For passive investors: Depreciation is non-cash, so a rental often shows a tax loss while cash-flowing — sheltering income. Rental losses are passive: they offset passive income freely, and up to $25,000/yr can offset ordinary (W-2) income if you actively participate and your MAGI is under $100k (phasing out to $0 by $150k); unused losses carry forward. On sale, claimed depreciation is recaptured at up to 25%, and gains may owe capital-gains tax (a 1031 exchange can defer both). Figures are a year-1 estimate at your 24.0% rate — not tax advice; consult a CPA.
Schools (NCES district)
- District
- Cleburne ISD
- NCES district ID
- 4814310
- Math proficiency
- 34% ▼ -2.00%
- Reading proficiency
- 33% ▼ -2.00%
- Median HH income
- $48,788
- Composite
- 29.0/100
- National rank
- #6618
- State rank
- #537 of 826 in TX
Livability — Cleburne
- Score
- 68/100
- State rank
- #460
- US rank
- #9292
Category grades
Schools grade is shown separately in the Schools card above.
Census & demographics
- Census place
- Cleburne, TX
- City population
- 29,538
- Population (ZIP)
- 18,697
Population outlook (Johnson County) Hauer SSP2
- Today (2025)
- 179,678 people
- By 2030
- 189,208 · +5.3%
- By 2040
- 207,261 · +15.4%
- By 2050
- 223,064 · +24.1%
- By 2075
- 259,979 · +44.7%
- By 2100
- 275,395 · +53.3%
Race, ethnicity, and origin ACS 2023
- Neighborhood character
- Predominantly White (66%)
- Race & ethnicity
- White 66% Hispanic / Latino 28% Two or more races 12% Black 3%
- Hispanic origin (detail)
- Mexican 23% Puerto Rican 3%
- Common ancestry
- Italian 1% Lithuanian 1% Slovak 1%
- Foreign-born
- 5% · Canada, Vietnam
- Languages at home
- 77% English-only · Spanish 22% Vietnamese 0%
Political lean MEDSL · Johnson
- 2024 margin
- Solid R (+51.4) · D 23.9% · R 75.3%
- 2008→2024 swing
- -3.9pp toward R · 2008: -47.5pp · 2024: -51.4pp
- All cycles
- 2024: R+51.4 2020: R+53.0 2016: R+58.3 2012: R+55.6 2008: R+47.5
Not yet ingested
- Civics
- —
Market trends
- HPI YoY
- ▼ -59.43%
- Current HPI
- 277.598
- Rent YoY
- —
- Metro
- —
- State GDP YoY
- ▲ 3.95%
- F500 in state
- 110
Industry mix (Fortune 500 HQ in TX)
| Industry | F500 HQs | Revenue |
|---|---|---|
| Energy | 16 | $1,198B |
|
||
| Technology | 5 | $198B |
|
||
| Engineering / Construction | 4 | $72B |
|
||
| Energy Services | 3 | $60B |
|
||
| Utilities | 3 | $41B |
|
||
| Healthcare | 2 | $330B |
|
||
Price history
+311.8% since first listed4 events — show timeline
- 2026-01-19 Listed $175,000 NTREIS
- 2003-06-18 Sold (Public Records) — Public Records
- 2003-05-22 Listing Removed — NTREIS
- 2003-04-19 Listed $42,500 NTREIS
Property tax history
+5.9%/yrLatest (2025): $2,787 · +1.5% YoY. Source: county tax records.
Cash-flow waterfall
monthlySold comps — $/sqft
last 12 mo · ≤1 miLoading sold comps…