 Duplex
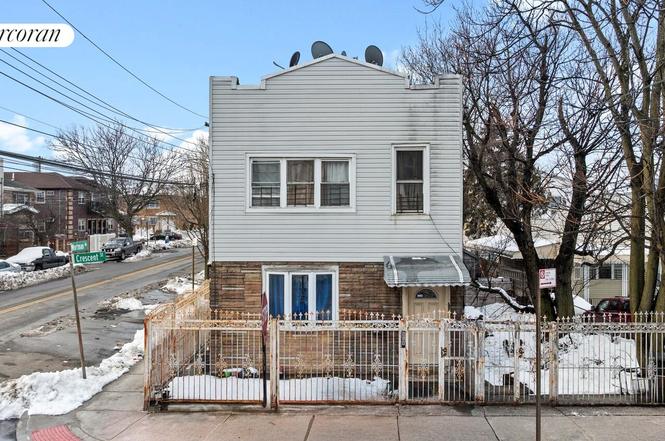
958 Crescent St · New York, NY
Flood risk 7/10 · Major
- FEMA flood zone
- X (unshaded)
- Chance of flooding over 30 yrs
- 0.78%
- Est. flood insurance / yr
- $507 – $1,088
Fire risk 2/10 · Minimal
- Est. fire insurance / yr
- $691 – $1,283
Heat risk 7/10 · Major
- Hot days now (above 99°F)
- 7 days/yr
- Hot days in 30 yrs
- 15 days/yr
Wind risk 6/10 · Moderate
- Chance of severe wind over 30 yrs
- 65.0%
Air-quality risk 5/10 · Moderate
- Unhealthy air days now
- 6 days/yr
- Unhealthy air days in 30 yrs
- 8 days/yr
Risk factors via First Street. Map © Google.
Why this score? — see what drove the C+ grade
The composite is a weighted blend of 9 inputs, each scored 0–100. Each bar is that input's sub-score; the figure is the points it added to the 100-point composite (weight × sub-score).
- Cash flow +21.3/30.0
- ARV discount +15.0/15.0
- DSCR +6.8/10.0
- Schools +5.0/10.0
- 1% rule +4.7/10.0
- Rent growth +4.0/5.0
- Livability +3.8/5.0
- Condition / age +2.5/5.0
- Appreciation +0.0/10.0
$815,000
🖨 Deal sheet (PDF) 📄 Offer letter ✓ Due diligence
Multi-family units
County records classify this as Multi-Family (2-4 Unit). Listing-text estimate: 2 units. confirmed
Listing remarks
958 Crescent Street Oversized Corner Lot 3 Units 4,000 Buildable Sq Ft Parking for 2 Cars Sitting proudly on a sprawling 40 x 100 corner lot, 958 Crescent Street presents a rare opportunity to reimagine and maximize a substantial Brooklyn property with approximately 4,000 square feet of buildable potential. The existing structure spans 20 x 65 and is currently built out to roughly 2,600 square feet, offering significant upside for expansion and redevelopment. This three-unit home is ideal for investors, developers, or end-users looking to create a custom multi-generational residence or high-yield income property. Current Configuration Owner's Duplex + Basement Main level: 3.5 bed
Key facts
- Oversized corner lot
- Corner exposure
- Gated entry
Tags
Property features AI
Finance
- Other: Property listed by Corcoran Group
Exterior
- Parking: Has garage
- Home design: 2-story building; Entry level on first floor; Green building
- Exterior features: Private outdoor space (over 60 sqft); Lot approximately 4,000 sq ft (100 x 40)
Interior
- Bedrooms: Total of 3 dwelling units (multi-unit property)
- Bathrooms: 4 full bathrooms; 1 half bathroom
- Interior features: Smoke-free property; Basement (other type)
- Laundry & utility: In-unit washer hookup
Neighborhood map
What this means for you Summary
Snapshot
- This is a 2 × 4-bed/?-bath units multifamily listed at $815k.
Deal economics
- At list price, monthly cash flow is $1k ($14k/yr) — positive. Per door: $565/mo.
- The deal already cash-flows at list — no discount required.
- To meet the 1% rule (rent ≥ 1% of price), the offer needs to be $793k (2.7% below list).
- Recommended offer: $742k (9.0% below list) — sets the bar for market timing.
- Cap rate 8.1% vs local median 2.6% in New York — top-decile yield for the area; either an underpriced asset or a hidden risk that comps aren't pricing in. Stress-test before assuming the spread holds.
Location & tenants
- Location reads 75/100 on livability (#268 in NY, #4,188 nationally) — a middle-class / working-renter tenant base. Strengths: amenities A+, commute A+, health & safety A; Watch: crime F, cost of living F.
- Zoned schools: Elm Tree Elementary School (math 27% / reading 52%, grade F, #1,444 of 2,108 statewide, top 71%, 806 students, 94% FRL); Jhs 383 Philippa Schuyler (math 32% / reading 67%, grade C, #280 of 729 statewide, top 40%, 822 students, 85% FRL); Midwood High School (math 94% / reading 96%, grade A+, #83 of 1,100 statewide, top 8%, 4,062 students, 73% FRL).
- Market conditions: Rents rising fast (+6.1%/yr); 193 active listings in the ZIP; 10,063 units permitted in Kings County in 2024 (9,789 in 5+ unit buildings).
- At $7,933/mo this rent would consume 153% of the median local household income ($62k/yr) (locally 7574% of renters already pay >50% of income on rent) — very limited rent-growth headroom before tenants either downsize or default.
Forward outlook
- Local home prices are declining (-3.0%/yr); year-one equity from $6k of loan paydown is wiped out by about $24k of value loss. Plan a longer hold.
- Kings County population projected at +13% by 2050 — modest demand growth; plan on rents tracking national, not racing it.
- At projected returns (-3.0% appreciation + 6.1% rent growth), your $228k cash investment doubles in ~10 years — after that, you're playing with house money.
Negotiation context
- It's been on market 113 days — a 9% lower offer ($742k) is reasonable based on typical stale-listing flexibility.
Risks & watch-outs
- Watch-outs: flood insurance adds $66/mo; built in 1920 — expect roof / HVAC / electrical / plumbing capex.
- Climate carrying-cost: major flood risk; major wind risk, 65% chance of damaging wind over 30y; extreme-heat days projected 7→15/yr by 2055 (HVAC capex compounding) — expect insurance premiums to compound above CPI over the hold.
Questions for the listing agent
- It's been on market 113 days. Have you received any prior offers? Is the seller open to a 9% concession, seller financing, or rate buy-down credit?
- Can we see the unit-by-unit rent roll, current vacancy, and any below-market leases? What's the average tenancy length?
- What capital expenditures (roof, boiler, parking lot, exteriors) have been made in the last 5 years, and what's planned in the next 2?
- Built in 1920 — when were the roof, HVAC, electrical panel, plumbing, and water heater last replaced?
- What's the actual annual flood-insurance premium (NFIP or private), and is the property in a SFHA with mandatory coverage?
- Why hasn't it sold? Are there any deal-killer items the seller is aware of (foundation, flood, title, zoning, code violations)?
- Is there a deadline driving the sale (1031 exchange, divorce, estate, relocation)? That informs how much negotiation room exists.
- Schools are B-rated — typically a magnet for longer-tenancy family renters. What's the average tenant stay here, and is there a school-zone premium baked into asking?
- Crime grade is F in this area — have there been break-ins, vandalism, or insurance claims at this property in the last 3 years? What carrier currently insures it and at what premium?
- What's the average days-on-market for RENTAL listings here right now (not sales)? A rising rental-DOM trend means longer vacancies and softer asking-rent achievability than the comps imply.
- What's the recent tenant-quality profile in this submarket — average credit score on applications, eviction rate, late-payment / NSF rate, and stable-employment percentage? A property-management company in the area should have these aggregated.
- How much new apartment / multifamily construction is in the pipeline within 1–3 miles? Heavy new supply (>2% of stock underway) typically softens rents 12–24 months out; light construction supports rent growth.
Investment metrics
- 1% rule
- 0.97% ✗
- Cap rate
- 8.06%
- Cash-on-cash
- 6.29%
- DSCR
- 1.28
- GRM
- 8.6
CMA / ARV
- ARV (on-the-fly)
- $980,200
- Comps found
- 4
Show comp detail 4 sales within ~0.75 mi
| Address | Dist | Beds/Ba | Sqft | Sold | Price | $/sf | Match |
|---|---|---|---|---|---|---|---|
| 894 New Lots Ave | 0.63mi | 8/4.0 | 2,600 (0%) | 10mo | $744,000 | $286 | 60 |
| 306 Sheridan Ave | 0.72mi | 8/5.0 | 2,652 (+2%) | 19mo | $1,000,000 | $377 | 45 |
| 301 Montauk Ave | 0.71mi | 8/3.0 | 2,730 (+5%) | 11mo | $985,000 | $361 | 44 |
| 304 Sheridan Ave | 0.73mi | 7/5.0 (-1) | 2,340 (-10%) | 19mo | $1,100,000 | $470 | 26 |
Match score weights: distance 35% · size 25% · config 20% · recency 20%. Top-matched comps best support the ARV.
Projected returns pro-forma
-3.0% appreciation · 6.14% rent growth · sell at horizon
- IRR
- -3.9%
- Equity multiple
- 0.85×
- Total profit
- $-34,391
- Equity at exit
- $121,519
- IRR
- 8.8%
- Equity multiple
- 1.77×
- Total profit
- $175,176
- Equity at exit
- $70,466
Cash invested: $228,200 (down + closing). Projections, not guarantees.
Landlord ↔ Tenant lean methodology
- Overall (CITY)
- 0 Strongly Tenant-Friendly
- State New York
- 15 Strongly Tenant-Friendly · D+10
- County
- — inherits STATE
- City New York
- 0 Strongly Tenant-Friendly · D+34
ZIP-level market 11208
- Rents YoY
- 6.1%
- Active inventory
- 193
- Price-to-rent
- 17.1×
Monthly cashflow live
- Estimated rent
- $7,933 high interval (Pro) →
- Mortgage (P&I)
- −$4,274
- Tax from tax record
- −$456 /mo · $5,478/yr
- Insurance
- −$340
- Flood insurance flood zone
- −$66 /mo · $798/yr
- HOA
- −$0
- Vacancy / Maint / Mgmt
- −$1,666
- Net cashflow
- $1,131
Break-even live
Sensitivity live
| Price | -10% $1,592 | -5% $1,361 | +0% $1,131 | +5% $900 | +10% $669 |
|---|---|---|---|---|---|
| Rent | -10% $504 | -5% $817 | +0% $1,131 | +5% $1,444 | +10% $1,757 |
| Rate | -1.0pp $1,541 | -0.5pp $1,338 | base $1,131 | +0.5pp $919 | +1.0pp $705 |
2-unit breakdown (identical units grouped — click to expand)
| Units | Beds | Baths | Est. rent |
|---|---|---|---|
| 2× units | 4 | — | $7,934 |
| #1 | 4 | — | $3,967 |
| #2 | 4 | — | $3,967 |
| Total (2 units) | $7,933 | ||
UW: 25.0% down · 7.5% · 30yr · 1.5% tax · 5.0% vac · 8.0% maint · 8.0% mgmt
Financing live
Cash to close
- Down payment
- $203,750
- Closing costs
- $24,450
- Reserves months
- —
- Total cash needed
- —
Loan-product check · same deal, 3 products live
Conventional
25% down · 7.5% · 30yr
- Down + closing
- —
- Monthly P&I
- —
- Monthly cashflow
- —
- DSCR
- —
- Eligible?
- —
Personal DTI + credit; lowest rate.
DSCR
20% down · 8.5% · 30yr
- Down + closing
- —
- Monthly P&I
- —
- Monthly cashflow
- —
- DSCR
- —
- Eligible?
- —
No personal income docs; deal must DSCR.
Hard money
10% down · 12.0% · 12mo
- Down + closing
- —
- Monthly P&I
- —
- Monthly cashflow
- —
- DSCR
- —
- Eligible?
- —
Short-term bridge; refi at stabilization.
Listing history 13 events
-
2026-06-21days on market $815,000 Active 113 DOM
-
2026-06-18days on market $815,000 Active 110 DOM
-
2026-06-17days on market $815,000 Active 109 DOM
-
2026-06-15days on market $815,000 Active 107 DOM
-
2026-06-13days on market $815,000 Active 105 DOM
-
2026-06-10days on market $815,000 Active 101 DOM
-
2026-06-08days on market $815,000 Active 100 DOM
-
2026-06-08days on market $815,000 Active 99 DOM
-
2026-06-04days on market $815,000 Active 96 DOM
-
2026-06-03days on market $815,000 Active 95 DOM
-
2026-06-01days on market $815,000 Active 93 DOM
-
2026-05-31days on market $815,000 Active 92 DOM
-
2026-02-28$815,000 Active
ⓘ Source: listings_history table (triggers on properties + properties_extension) + one-shot
backfill from property_details.listing_events for pre-trigger history.
Tax reassessment forecast NY · Partial reset (capped growth)
- Current annual tax
- $5,478 · $456/mo
- Projected year-2 tax
- $9,626 · $802/mo
- Expected delta
- +$4,148/yr (+$346/mo · 75.7%)
ⓘ Screening estimate from a state-policy table — verify with the county assessor before closing.
Climate risk First Street
- Flood 7/10 Severe FEMA zone X (unshaded) · 78% chance over 30 yrs
- Wildfire 2/10 Low
- Heat 7/10 Severe 7 d/yr ≥99°F today · 15 d/yr by 30 yrs out
- Wind 6/10 Major 65% chance of damaging wind over 30 yrs
- Air quality 5/10 Major 6 unhealthy d/yr today · 8 by 30 yrs out
Nearby sold comps map
Loading sold comps map…
Walkable amenities ~0.75 mi
Loading nearby amenities…
Taxation est. · year 1
- Rental income
- $95,196
- − Mortgage interest
- −$45,653
- − Property taxes
- −$5,478
- − Insurance
- −$4,872
- − Repairs & maintenance
- −$7,616
- − Management
- −$7,616
- − Depreciation
- −$23,709
- Taxable income
- $253
- Est. tax owed @ 24.0%
- −$61
- After-tax cash flow
- $13,507/yr
For passive investors: Depreciation is non-cash, so a rental often shows a tax loss while cash-flowing — sheltering income. Rental losses are passive: they offset passive income freely, and up to $25,000/yr can offset ordinary (W-2) income if you actively participate and your MAGI is under $100k (phasing out to $0 by $150k); unused losses carry forward. On sale, claimed depreciation is recaptured at up to 25%, and gains may owe capital-gains tax (a 1031 exchange can defer both). Figures are a year-1 estimate at your 24.0% rate — not tax advice; consult a CPA.
Schools (NCES district)
No district data.
Livability — New York
- Score
- 75/100
- State rank
- #268
- US rank
- #4188
Category grades
Schools grade is shown separately in the Schools card above.
Census & demographics
- Census place
- New York, NY
- County
- Kings County · 2,614,986 people
- City population
- 7,731,280
- Metro
- New York-Newark-Jersey City, NY-NJ-PA
- Population (ZIP)
- 105,428
- Household income
- $62,077
- Rent vs Own
- Severe rent burden
- 7574.0
Population outlook (Kings County) Hauer SSP2
- Today (2025)
- 2,847,441 people
- By 2030
- 2,937,006 · +3.1%
- By 2040
- 3,095,491 · +8.7%
- By 2050
- 3,228,968 · +13.4%
- By 2075
- 3,321,723 · +16.7%
- By 2100
- 3,111,387 · +9.3%
Race, ethnicity, and origin ACS 2023
- Neighborhood character
- Diverse neighborhood (Simpson 0.66)
- Race & ethnicity
- Black 42% Hispanic / Latino 39% Asian 10% Two or more races 8% White 3%
- Hispanic origin (detail)
- Mexican 2% Puerto Rican 9% Dominican 16%
- Common ancestry
- Hispanic 1%
- Foreign-born
- 40% · Canada, China, Mexico
- Languages at home
- 48% English-only · Spanish 36% Other Indo-European 11% French/Haitian/Cajun 1%
Political lean MEDSL · Kings
- 2024 margin
- Solid D (+44.0) · D 72.0% · R 28.0%
- 2008→2024 swing
- -15.5pp toward R · 2008: 59.4pp · 2024: 44.0pp
- All cycles
- 2024: D+44.0 2020: D+54.8 2016: D+61.8 2012: D+63.9 2008: D+59.4
Not yet ingested
- Civics
- —
Market trends
- HPI YoY
- ▼ -546.38%
- Current HPI
- 376.1489
- Rent YoY
- ▲ 6.14%
- Metro
- New York-Newark-Jersey City, NY-NJ-PA
- State GDP YoY
- ▲ 2.60%
- F500 in state
- 92
Industry mix (Fortune 500 HQ in NY)
| Industry | F500 HQs | Revenue |
|---|---|---|
| Financial Services | 10 | $950B |
|
||
| Consumer Goods | 9 | $162B |
|
||
| Insurance | 4 | $225B |
|
||
| Telecommunications | 2 | $144B |
|
||
| Pharmaceuticals | 2 | $112B |
|
||
| Media / Entertainment | 2 | $69B |
|
||
Price history
1 event — show timeline
- 2026-02-28 Listed $815,000 RLS at REBNY
Property tax history
+5.4%/yrLatest (2025): $5,478 · -1.5% YoY. Source: county tax records.
Cash-flow waterfall
monthlySold comps — $/sqft
last 12 mo · ≤1 miLoading sold comps…