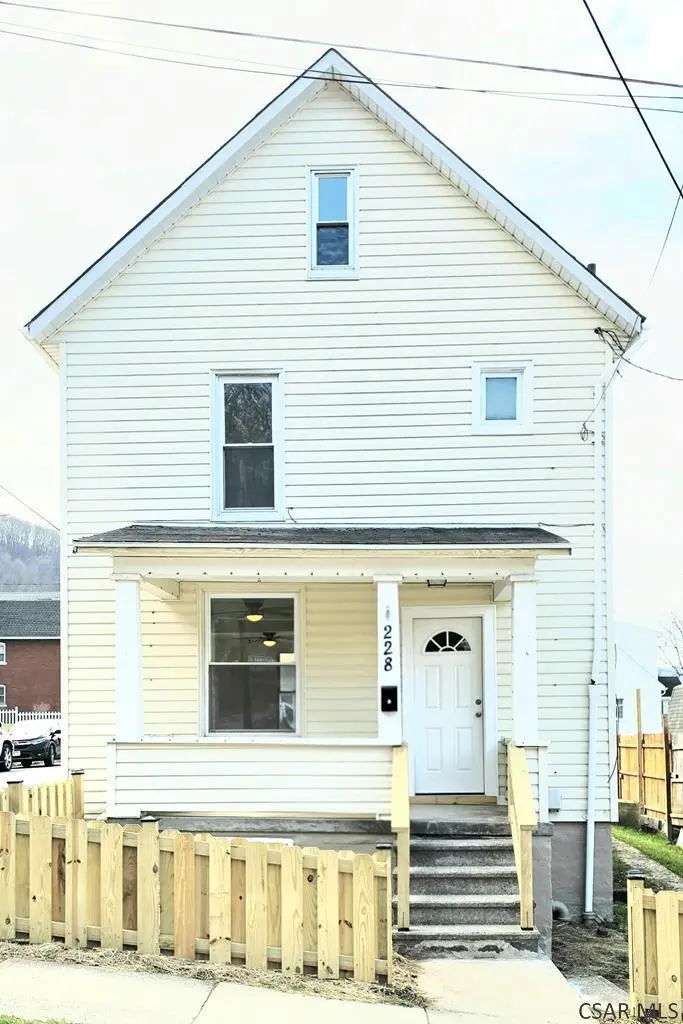
228 Stutzman St · Johnstown, PA
Flood risk 1/10 · Minimal
- FEMA flood zone
- X (unshaded)
- Chance of flooding over 30 yrs
- 0.0%
- Est. flood insurance / yr
- $473 – $860
Fire risk 1/10 · Minimal
- Est. fire insurance / yr
- $511 – $949
Heat risk 3/10 · Minor
- Hot days now (above 96°F)
- 8 days/yr
- Hot days in 30 yrs
- 19 days/yr
Wind risk 2/10 · Minimal
- Chance of severe wind over 30 yrs
- —
Air-quality risk 3/10 · Minor
- Unhealthy air days now
- 2 days/yr
- Unhealthy air days in 30 yrs
- 3 days/yr
Risk factors via First Street. Map © Google.
Why this score? — see what drove the C- grade
The composite is a weighted blend of 9 inputs, each scored 0–100. Each bar is that input's sub-score; the figure is the points it added to the 100-point composite (weight × sub-score).
- Cash flow +20.9/30.0
- ARV discount +7.5/15.0
- DSCR +6.6/10.0
- 1% rule +5.5/10.0
- Livability +3.9/5.0
- Appreciation +3.4/10.0
- Rent growth +2.5/5.0
- Condition / age +2.5/5.0
- Schools +1.3/10.0
$79,900
🖨 Deal sheet (PDF) 📄 Offer letter ✓ Due diligence
Listing remarks MLS
3 bed/1 bath handyman special. Has newer windows and siding. Level fenced lot , covered porch, and detached garage.
Key facts
- Updated kitchen
- Newly fenced yard
- 3,485 sq ft lot
Tags
Property features AI
Exterior
- Parking: Detached 1-car garage
- Utilities: Public water; Public sewer available
- Home design: Single-family residence; Two-story
- Construction: Vinyl siding; Shingle roof
- Exterior features: Covered porch; Corner lot
Interior
- Kitchen: Eat-in kitchen
- Flooring: Vinyl flooring
- Bathrooms: 1 full bathroom
- Heating & cooling: Forced air heating (natural gas); Ceiling fans for cooling
- Interior features: Eat-in kitchen; Full basement
- Laundry & utility: Washer and dryer; Laundry located in basement
Neighborhood map
What this means for you Summary
Snapshot
- This is a 3-bed/1.0-bath single-family listed at $80k.
Deal economics
- At list price, monthly cash flow is $111 ($1k/yr) — positive.
- The deal already cash-flows at list — no discount required.
- Meets the 1% rule at list price ($842 rent vs $80k).
- Recommended offer: $78k (3.0% below list) — sets the bar for market timing.
- Cap rate 8.0% vs local median 15.0% in Johnstown — below-typical yield; the buyer is paying a premium for something (appreciation thesis, condition, location) that the cap rate doesn't capture.
Location & tenants
- Location reads 77/100 on livability (#363 in PA, #3,168 nationally) — a middle-class / working-renter tenant base. Strengths: amenities A+, commute A+, cost of living A+; Watch: schools D+, crime F, employment F.
- Greater Johnstown SD (urban): math 9% / reading 25% proficiency, ranked #509 of 539 in PA (top 94%) — low school quality limits family demand, transient renter base, plan for 1-2y turnover; 80% free/reduced lunch — lower-income household profile, screen leases tightly.
- Market conditions: 47 active listings in the ZIP; 5 comparable units currently listed for rent nearby; rentals at typical pace (median 25d on market — plan ~3-4 weeks tenant-placement turnaround); 64 units permitted in Cambria County in 2024 (0 in 5+ unit buildings).
Forward outlook
- Local home prices are declining (-3.0%/yr); year-one equity from $552 of loan paydown is wiped out by about $2k of value loss. Plan a longer hold.
- Cambria County population projected at -28% by 2050 — secular population decline; favor cash flow + early exit over multi-decade hold.
Negotiation context
- It's been on market 45 days — a 3% lower offer ($78k) is reasonable based on typical stale-listing flexibility.
- 4 sale attempts since 29y ago with the ask held roughly flat each time — persistent listings suggest the price (not the market) is what's stuck; bring a comps-based counter.
- Current owner paid $6k; list at $80k implies a 1259% gain — meaningful room to come down on a strong offer.
Questions for the listing agent
- It's been on market 45 days. Have you received any prior offers? Is the seller open to a 3% concession, seller financing, or rate buy-down credit?
- Is there a deadline driving the sale (1031 exchange, divorce, estate, relocation)? That informs how much negotiation room exists.
- Schools are D-rated, which usually means shorter tenancies and higher turnover. Who's the typical renter profile here, and what's been the actual vacancy rate?
- Crime grade is F in this area — have there been break-ins, vandalism, or insurance claims at this property in the last 3 years? What carrier currently insures it and at what premium?
- What's the average days-on-market for RENTAL listings here right now (not sales)? A rising rental-DOM trend means longer vacancies and softer asking-rent achievability than the comps imply.
- What's the recent tenant-quality profile in this submarket — average credit score on applications, eviction rate, late-payment / NSF rate, and stable-employment percentage? A property-management company in the area should have these aggregated.
- How much new for-sale + rental construction is in the pipeline within 1–3 miles? Heavy new supply typically softens prices + rents 12–24 months out; constrained supply supports both.
Investment metrics
- 1% rule
- 1.05% ✓
- Cap rate
- 7.96%
- Cash-on-cash
- 5.94%
- DSCR
- 1.26
- GRM
- 7.9
CMA / ARV
- ARV (on-the-fly)
- $39,200
- Comps found
- 9
Show comp detail 9 sales within ~0.75 mi
| Address | Dist | Beds/Ba | Sqft | Sold | Price | $/sf | Match |
|---|---|---|---|---|---|---|---|
| 440 Boyer St | 0.11mi | 2/1.0 (-1) | 1,152 (+3%) | 5mo | $40,000 | $35 | 81 |
| 258 Vaughn | 0.11mi | 3/1.0 | 1,224 (+9%) | 13mo | $20,000 | $16 | 68 |
| 376 Beatrice Ave | 0.60mi | 3/1.0 | 1,120 (0%) | 20mo | $37,000 | $33 | 55 |
| 77 Boyer St | 0.41mi | 3/2.0 | 1,236 (+10%) | 6mo | $39,500 | $32 | 55 |
| 118 Hagen St | 0.38mi | 3/1.0 | 1,232 (+10%) | 20mo | $52,000 | $42 | 49 |
| 371 Edith Ave | 0.74mi | 3/1.0 | 1,120 (0%) | 20mo | $49,900 | $45 | 48 |
| 454 Frank St | 0.59mi | 3/1.5 | 960 (-14%) | 10mo | $55,000 | $57 | 38 |
| 355 Corinne St | 0.71mi | 2/1.0 (-1) | 1,254 (+12%) | 6mo | $52,500 | $42 | 37 |
| 281 Decker Ave | 0.72mi | 2/1.0 (-1) | 1,052 (-6%) | 21mo | $27,500 | $26 | 34 |
Match score weights: distance 35% · size 25% · config 20% · recency 20%. Top-matched comps best support the ARV.
Projected returns pro-forma
-3.0% appreciation · 3.0% rent growth · sell at horizon
- IRR
- -7.1%
- Equity multiple
- 0.74×
- Total profit
- $-5,878
- Equity at exit
- $11,913
- IRR
- 2.5%
- Equity multiple
- 1.18×
- Total profit
- $4,023
- Equity at exit
- $6,908
Cash invested: $22,372 (down + closing). Projections, not guarantees.
Landlord ↔ Tenant lean methodology
- Overall (STATE)
- 62 Landlord-Friendly
- State Pennsylvania
- 62 Landlord-Friendly · EVEN
- County
- — inherits STATE
- City
- — inherits STATE
ZIP-level market 15906
- Home prices YoY
- -4.0%
- Active inventory
- 47
- Price-to-rent
- 7.9×
Monthly cashflow live
- Estimated rent
- $842 high interval (Pro) →
- Mortgage (P&I)
- −$419
- Tax from tax record
- −$102 /mo · $1,224/yr
- Insurance
- −$33
- HOA
- −$0
- Vacancy / Maint / Mgmt
- −$177
- Net cashflow
- $111
Break-even live
Sensitivity live
| Price | -10% $156 | -5% $133 | +0% $111 | +5% $88 | +10% $66 |
|---|---|---|---|---|---|
| Rent | -10% $44 | -5% $78 | +0% $111 | +5% $144 | +10% $177 |
| Rate | -1.0pp $151 | -0.5pp $131 | base $111 | +0.5pp $90 | +1.0pp $69 |
UW: 25.0% down · 7.5% · 30yr · 1.5% tax · 5.0% vac · 8.0% maint · 8.0% mgmt
Financing live
Cash to close
- Down payment
- $19,975
- Closing costs
- $2,397
- Reserves months
- —
- Total cash needed
- —
Loan-product check · same deal, 3 products live
Conventional
25% down · 7.5% · 30yr
- Down + closing
- —
- Monthly P&I
- —
- Monthly cashflow
- —
- DSCR
- —
- Eligible?
- —
Personal DTI + credit; lowest rate.
DSCR
20% down · 8.5% · 30yr
- Down + closing
- —
- Monthly P&I
- —
- Monthly cashflow
- —
- DSCR
- —
- Eligible?
- —
No personal income docs; deal must DSCR.
Hard money
10% down · 12.0% · 12mo
- Down + closing
- —
- Monthly P&I
- —
- Monthly cashflow
- —
- DSCR
- —
- Eligible?
- —
Short-term bridge; refi at stabilization.
Rent comps 5 comps
| Address | Beds | Baths | Sqft | Rent | $/sqft | DOM | Units | Dist |
|---|---|---|---|---|---|---|---|---|
| 459 Stone St Johnstown, PA | 3.0 | 1.0 | 1120 | $900 | $0.80 | 24d | 1 | 0.61mi |
| 444 Stone St Unit 444 Johnstown, PA | 2.0 | 1.0 | 950 | $700 | $0.74 | 24d | 1 | 0.61mi |
| 444 Stone St Johnstown, PA | 2.0 | 1.0 | 908 | $700 | $0.77 | 44d | 1 | 0.62mi |
| 213 Stone St Johnstown, PA | 2.0 | 1.0 | 989 | $1,100 | $1.11 | 24d | 1 | 0.77mi |
| 207 Burkhard St Johnstown, PA | 2.0 | 1.0 | 856 | $825 | $0.96 | 24d | 1 | 1.30mi |
Listing history 10 events
-
2026-05-18status Active
-
2026-04-29status Pending
-
2026-03-26$79,900 Active
-
2016-02-27historical 115-char remark
Show marketing remark (115 chars)
3 bed/1 bath handyman special. Has newer windows and siding. Level fenced lot , covered porch, and detached garage.
-
2015-04-28soldstatus $5,880
-
2015-02-27$16,800 115-char remark
Show marketing remark (115 chars)
3 bed/1 bath handyman special. Has newer windows and siding. Level fenced lot , covered porch, and detached garage.
-
2006-03-21soldstatus $40,000
-
1998-03-31soldstatus $26,000 172-char remark
Show marketing remark (172 chars)
Sellers disclosure and Lead disclosure on file. A/C window unit in living room is not included. Refigerator, stove, washer and dryer are included. Newer replacement windows
-
1998-03-01soldstatus $26,000
-
1997-11-18$25,000 172-char remark
Show marketing remark (172 chars)
Sellers disclosure and Lead disclosure on file. A/C window unit in living room is not included. Refigerator, stove, washer and dryer are included. Newer replacement windows
ⓘ Source: listings_history table (triggers on properties + properties_extension) + one-shot
backfill from property_details.listing_events for pre-trigger history.
Tax reassessment forecast PA · Partial reset (capped growth)
- Current annual tax
- $1,224 · $102/mo
- Projected year-2 tax
- $1,243 · $104/mo
- Expected delta
- +$19/yr (+$2/mo · 1.6%)
ⓘ Screening estimate from a state-policy table — verify with the county assessor before closing.
Climate risk First Street
- Flood 1/10 Low FEMA zone X (unshaded) · 0% chance over 30 yrs
- Wildfire 1/10 Low
- Heat 3/10 Moderate 8 d/yr ≥96°F today · 19 d/yr by 30 yrs out
- Wind 2/10 Low
- Air quality 3/10 Moderate 2 unhealthy d/yr today · 3 by 30 yrs out
Nearby sold comps map
Loading sold comps map…
Walkable amenities ~0.75 mi
Loading nearby amenities…
Taxation est. · year 1
- Rental income
- $10,102
- − Mortgage interest
- −$4,476
- − Property taxes
- −$1,224
- − Insurance
- −$400
- − Repairs & maintenance
- −$808
- − Management
- −$808
- − Depreciation
- −$2,324
- Taxable income
- $62
- Est. tax owed @ 24.0%
- −$15
- After-tax cash flow
- $1,314/yr
For passive investors: Depreciation is non-cash, so a rental often shows a tax loss while cash-flowing — sheltering income. Rental losses are passive: they offset passive income freely, and up to $25,000/yr can offset ordinary (W-2) income if you actively participate and your MAGI is under $100k (phasing out to $0 by $150k); unused losses carry forward. On sale, claimed depreciation is recaptured at up to 25%, and gains may owe capital-gains tax (a 1031 exchange can defer both). Figures are a year-1 estimate at your 24.0% rate — not tax advice; consult a CPA.
Schools (NCES district)
- District
- Greater Johnstown SD
- NCES district ID
- 4210950
- Math proficiency
- 9% ▼ -6.00%
- Reading proficiency
- 25% ▼ -6.00%
- Median HH income
- $27,890
- Composite
- 13.25/100
- National rank
- #9550
- State rank
- #509 of 539 in PA
Livability — Johnstown
- Score
- 77/100
- State rank
- #363
- US rank
- #3168
Category grades
Schools grade is shown separately in the Schools card above.
Census & demographics
- Census place
- Johnstown, PA
- City population
- 30,791
- Population (ZIP)
- 9,654
Population outlook (Cambria County) Hauer SSP2
- Today (2025)
- 122,754 people
- By 2030
- 115,827 · -5.6%
- By 2040
- 101,309 · -17.5%
- By 2050
- 88,379 · -28.0%
- By 2075
- 65,237 · -46.9%
- By 2100
- 46,909 · -61.8%
Race, ethnicity, and origin ACS 2023
- Neighborhood character
- Predominantly White (79%)
- Race & ethnicity
- White 79% Black 11% Two or more races 7% Hispanic / Latino 3%
- Common ancestry
- Romanian 8% Polish 2% Slovak 2%
- Foreign-born
- 1% · Canada
- Languages at home
- 98% English-only · Spanish 1%
Political lean MEDSL · Cambria
- 2024 margin
- Solid R (+39.7) · D 29.8% · R 69.5%
- 2008→2024 swing
- -40.4pp toward R · 2008: 0.7pp · 2024: -39.7pp
- All cycles
- 2024: R+39.7 2020: R+37.3 2016: R+37.8 2012: R+17.8 2008: D+0.7
Not yet ingested
- Civics
- —
Market trends
- HPI YoY
- ▼ -3.26%
- Current HPI
- 77.6797
- Rent YoY
- —
- Metro
- —
- State GDP YoY
- ▲ 1.68%
- F500 in state
- 34
Industry mix (Fortune 500 HQ in PA)
| Industry | F500 HQs | Revenue |
|---|---|---|
| Healthcare | 2 | $309B |
|
||
| Insurance | 2 | $27B |
|
||
| Telecommunications / Media | 1 | $124B |
|
||
| Industrial Distribution | 1 | $22B |
|
||
| Financial Services | 1 | $20B |
|
||
| Chemicals / Materials | 1 | $18B |
|
||
Price history
+219.6% since first listed10 events — show timeline
- 2026-05-18 Relisted — CSMLS
- 2026-04-29 Pending — CSMLS
- 2026-03-26 Listed $79,900 CSMLS
- 2016-02-27 Delisted — West Penn MLS
- 2015-04-28 Sold (Public Records) $5,880 Public Records
- 2015-02-27 Listed $16,800 West Penn MLS
- 2006-03-21 Sold (Public Records) $40,000 Public Records
- 1998-03-31 Sold (MLS) $26,000 CSMLS
- 1998-03-01 Sold (Public Records) $26,000 Public Records
- 1997-11-18 Listed $25,000 CSMLS
Property tax history
+0.2%/yrLatest (2026): $1,224 · +0.0% YoY. Source: county tax records.
Cash-flow waterfall
monthlySold comps — $/sqft
last 12 mo · ≤1 miLoading sold comps…