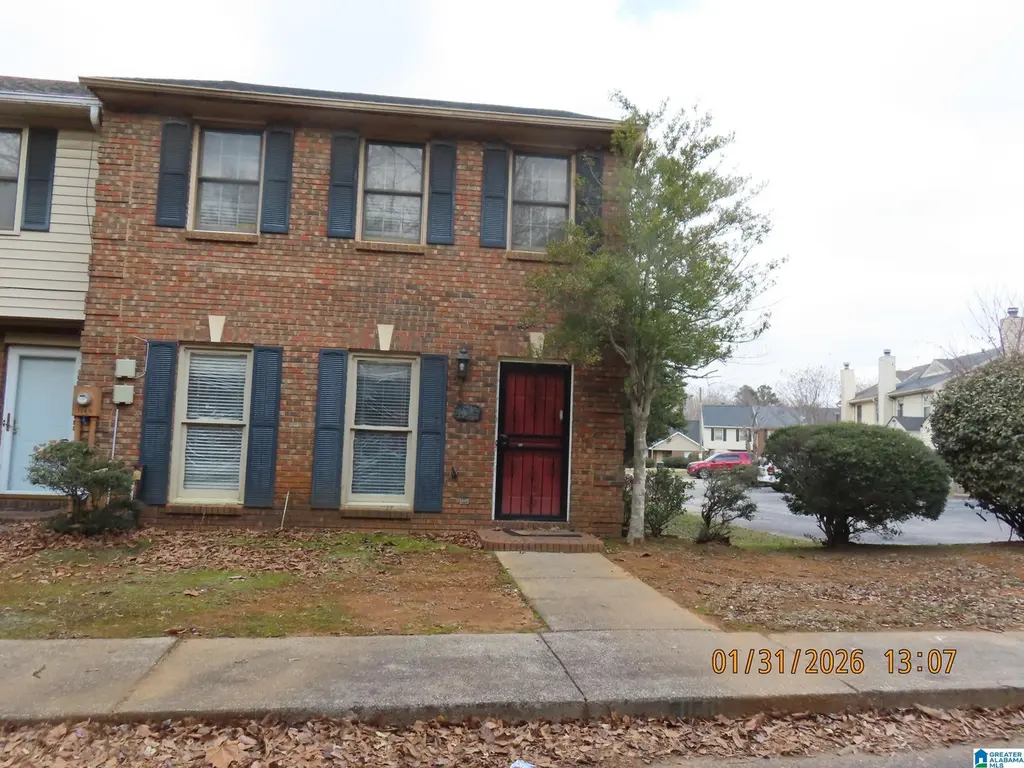
1140 Springville Rd · Birmingham, AL
Flood risk 1/10 · Minimal
- FEMA flood zone
- X (unshaded)
- Chance of flooding over 30 yrs
- 0.0%
- Est. flood insurance / yr
- $507 – $1,088
Fire risk 3/10 · Minor
- Est. fire insurance / yr
- $916 – $1,700
Heat risk 6/10 · Moderate
- Hot days now (above 105°F)
- 7 days/yr
- Hot days in 30 yrs
- 19 days/yr
Wind risk 6/10 · Moderate
- Chance of severe wind over 30 yrs
- 27.0%
Air-quality risk 5/10 · Moderate
- Unhealthy air days now
- 7 days/yr
- Unhealthy air days in 30 yrs
- 9 days/yr
Risk factors via First Street. Map © Google.
Why this score? — see what drove the D grade
The composite is a weighted blend of 9 inputs, each scored 0–100. Each bar is that input's sub-score; the figure is the points it added to the 100-point composite (weight × sub-score).
- Cash flow +18.6/30.0
- DSCR +5.9/10.0
- 1% rule +4.2/10.0
- ARV discount +4.0/15.0
- Livability +3.4/5.0
- Rent growth +3.3/5.0
- Condition / age +2.5/5.0
- Schools +0.9/10.0
- Appreciation +0.0/10.0
$159,900
🖨 Deal sheet (PDF) 📄 Offer letter ✓ Due diligence
Listing remarks MLS
Charming 2-story townhome, located on a corner lot. This home features two bedrooms, and to full bathrooms on the second level. Living room, kitchen dining room, and laundry room on the first level. Partially rear covered patio and a two-car covered detached carport. Storage room.
Key facts
- Detached carport
- Rear covered patio
- Corner lot
Tags
Neighborhood map
What this means for you Summary
Snapshot
- This is a 4-bed/2.5-bath townhouse listed at $160k.
Deal economics
- At list price, monthly cash flow is $157 ($2k/yr) — positive.
- The deal already cash-flows at list — no discount required.
- To meet the 1% rule (rent ≥ 1% of price), the offer needs to be $148k (7.6% below list).
- Recommended offer: $148k (7.6% below list) — sets the bar for 1% rule.
Location & tenants
- Location reads 67/100 on livability (#78 in AL) — a middle-class / working-renter tenant base. Strengths: commute A+, cost of living A+, housing A+; Watch: amenities C-, schools F, crime F.
- Birmingham City (urban): math 4% / reading 20% proficiency, ranked #116 of 129 in AL (top 90%) — low school quality limits family demand, transient renter base, plan for 1-2y turnover; 82% free/reduced lunch — lower-income household profile, screen leases tightly.
- Market conditions: Rents rising (+3.0%/yr); 336 active listings in the ZIP; 40 comparable units currently listed for rent nearby; rentals at typical pace (median 26d on market — plan ~3-4 weeks tenant-placement turnaround); 2,114 units permitted in Jefferson County in 2024 (556 in 5+ unit buildings).
- This rent runs 34% of the median local income ($53k/yr) — at the standard rent-burdened threshold; future hikes will face affordability resistance.
Forward outlook
- Local home prices are declining (-3.0%/yr); year-one equity from $1k of loan paydown is wiped out by about $5k of value loss. Plan a longer hold.
- Jefferson County population projected to shrink 4% by 2050 — rents likely to lag national; underwrite the cash flow, not the appreciation.
Negotiation context
- It's been on market 86 days — a 6% lower offer ($150k) is reasonable based on typical stale-listing flexibility.
- Current owner paid $80k; list at $160k implies a 100% gain — meaningful room to come down on a strong offer.
Risks & watch-outs
- Climate carrying-cost: major wind risk, 27% chance of damaging wind over 30y; extreme-heat days projected 7→19/yr by 2055 (HVAC capex compounding) — expect insurance premiums to compound above CPI over the hold.
Questions for the listing agent
- It's been on market 86 days. Have you received any prior offers? Is the seller open to a 8% concession, seller financing, or rate buy-down credit?
- What does the HOA fee cover, when was the last increase, and are there any pending special assessments or reserve-fund shortfalls?
- Why hasn't it sold? Are there any deal-killer items the seller is aware of (foundation, flood, title, zoning, code violations)?
- Is there a deadline driving the sale (1031 exchange, divorce, estate, relocation)? That informs how much negotiation room exists.
- Schools are F-rated, which usually means shorter tenancies and higher turnover. Who's the typical renter profile here, and what's been the actual vacancy rate?
- Crime grade is F in this area — have there been break-ins, vandalism, or insurance claims at this property in the last 3 years? What carrier currently insures it and at what premium?
- The area grade is low — what's the realistic commute time and amenity access for the typical tenant pool here? Any planned neighborhood developments (good or bad) we should know about?
- What's the average days-on-market for RENTAL listings here right now (not sales)? A rising rental-DOM trend means longer vacancies and softer asking-rent achievability than the comps imply.
- What's the recent tenant-quality profile in this submarket — average credit score on applications, eviction rate, late-payment / NSF rate, and stable-employment percentage? A property-management company in the area should have these aggregated.
- How much new for-sale + rental construction is in the pipeline within 1–3 miles? Heavy new supply typically softens prices + rents 12–24 months out; constrained supply supports both.
Investment metrics
- 1% rule
- 0.92% ✗
- Cap rate
- 7.47%
- Cash-on-cash
- 4.20%
- DSCR
- 1.19
- GRM
- 9.0
CMA / ARV
- ARV (median comp)
- $148,435
- List price
- $159,900
- Delta
- 7.72%
- Verdict
- FAIR
- Comps
- 20 within 1.0 mi
Show comp detail 2 sales within ~0.75 mi
| Address | Dist | Beds/Ba | Sqft | Sold | Price | $/sf | Match |
|---|---|---|---|---|---|---|---|
| 1104 Springville Rd | 0.05mi | 3/2.5 (-1) | 1,782 (+14%) | 5mo | $216,000 | $121 | 66 |
| 1100 Springville Ln | 0.06mi | 3/2.5 (-1) | 1,656 (+6%) | 21mo | $170,000 | $103 | 65 |
Match score weights: distance 35% · size 25% · config 20% · recency 20%. Top-matched comps best support the ARV.
Projected returns pro-forma
-3.0% appreciation · 3.04% rent growth · sell at horizon
- IRR
- -9.7%
- Equity multiple
- 0.64×
- Total profit
- $-15,918
- Equity at exit
- $23,842
- IRR
- -0.3%
- Equity multiple
- 0.98×
- Total profit
- $-924
- Equity at exit
- $13,825
Cash invested: $44,772 (down + closing). Projections, not guarantees.
Landlord ↔ Tenant lean methodology
- Overall (STATE)
- 90 Strongly Landlord-Friendly
- State Alabama
- 90 Strongly Landlord-Friendly · R+15
- County
- — inherits STATE
- City
- — inherits STATE
ZIP-level market 35215
- Home prices YoY
- -34.4%
- Rents YoY
- 3.0%
- Active inventory
- 336
- Price-to-rent
- 9.0×
Monthly cashflow live
- Estimated rent
- $1,478 high interval (Pro) →
- Mortgage (P&I)
- −$839
- Tax from tax record
- −$76 /mo · $907/yr
- Insurance
- −$67
- HOA
- −$30
- Vacancy / Maint / Mgmt
- −$310
- Net cashflow
- $157
Break-even live
Sensitivity live
| Price | -10% $247 | -5% $202 | +0% $157 | +5% $111 | +10% $66 |
|---|---|---|---|---|---|
| Rent | -10% $40 | -5% $98 | +0% $157 | +5% $215 | +10% $273 |
| Rate | -1.0pp $237 | -0.5pp $197 | base $157 | +0.5pp $115 | +1.0pp $73 |
UW: 25.0% down · 7.5% · 30yr · 1.5% tax · 5.0% vac · 8.0% maint · 8.0% mgmt
Financing live
Cash to close
- Down payment
- $39,975
- Closing costs
- $4,797
- Reserves months
- —
- Total cash needed
- —
Loan-product check · same deal, 3 products live
Conventional
25% down · 7.5% · 30yr
- Down + closing
- —
- Monthly P&I
- —
- Monthly cashflow
- —
- DSCR
- —
- Eligible?
- —
Personal DTI + credit; lowest rate.
DSCR
20% down · 8.5% · 30yr
- Down + closing
- —
- Monthly P&I
- —
- Monthly cashflow
- —
- DSCR
- —
- Eligible?
- —
No personal income docs; deal must DSCR.
Hard money
10% down · 12.0% · 12mo
- Down + closing
- —
- Monthly P&I
- —
- Monthly cashflow
- —
- DSCR
- —
- Eligible?
- —
Short-term bridge; refi at stabilization.
Rent comps 40 comps
| Address | Beds | Baths | Sqft | Rent | $/sqft | DOM | Units | Dist |
|---|---|---|---|---|---|---|---|---|
| 925 Eldorado Dr Birmingham, AL | 3.0 | 1.0 | 1312 | $1,231 | $0.94 | 45d | 1 | 0.39mi |
| 1340 Orlando Cir NE Birmingham, AL | 3.0 | 2.0 | 1329 | $1,166 | $0.88 | 25d | 1 | 0.39mi |
| 901 Eldorado Dr Birmingham, AL | 4.0 | 2.0 | 1680 | $1,415 | $0.84 | 16d | 1 | 0.42mi |
| 1360 Orlando Cir NE Birmingham, AL | 3.0 | 2.0 | 1489 | $1,455 | $0.98 | 25d | 1 | 0.44mi |
| 224 13th Ave NE Birmingham, AL | 3.0 | 1.5 | 1213 | $1,273 | $1.05 | 23d | 1 | 0.44mi |
| 933 Edwards Lake Rd Birmingham, AL | 3.0 | 2.0 | 1684 | $1,360 | $0.81 | 5d | 1 | 0.45mi |
| 1317 Hatfield Ln Birmingham, AL | 3.0 | 1.5 | 2028 | $1,300 | $0.64 | 25d | 1 | 0.50mi |
| 744 Vaughn Cir Birmingham, AL | 4.0 | 2.0 | 1516 | $1,561 | $1.03 | 25d | 1 | 0.55mi |
| 1037 Dawn Dr Birmingham, AL | 4.0 | 1.0 | 1532 | $1,295 | $0.85 | 13d | 1 | 0.56mi |
| 236 E Haven Dr Birmingham, AL | 3.0 | 1.5 | 1926 | $1,495 | $0.78 | 13d | 1 | 0.60mi |
| 1259 Huffman Rd Center Point, AL | 3.0 | 2.0 | 1662 | $1,556 | $0.94 | 45d | 1 | 0.63mi |
| 239 Lake Drive Cir NE Birmingham, AL | 3.0 | 1.0 | 1159 | $1,125 | $0.97 | 5d | 1 | 0.64mi |
| 1328 Oak Ter Birmingham, AL | 3.0 | 2.0 | 1772 | $1,581 | $0.89 | 13d | 1 | 0.68mi |
| 1235 Little Brook Ln Birmingham, AL | 3.0 | 2.0 | 1787 | $2,400 | $1.34 | 45d | 1 | 0.73mi |
| 1028 Broadmoor Dr Birmingham, AL | 3.0 | 1.0 | 1079 | $1,085 | $1.01 | 5d | 1 | 0.74mi |
| 940 Pine Hill Rd Birmingham, AL | 3.0 | 2.0 | 1926 | $1,475 | $0.77 | 45d | 1 | 0.75mi |
| 213 Meadwood Dr NE Center Point, AL | 3.0 | 1.0 | 1194 | $995 | $0.83 | 45d | 1 | 0.80mi |
| 1409 Medina Ln Birmingham, AL | 3.0 | 2.0 | 2113 | $1,600 | $0.76 | 45d | 1 | 0.80mi |
| 120 Shawnee Ln NW Birmingham, AL | 3.0 | 1.0 | 1120 | $1,075 | $0.96 | 45d | 1 | 0.83mi |
| 108 13th Ave NW Center Point, AL | 4.0 | 2.0 | 1444 | $1,265 | $0.88 | 25d | 1 | 0.84mi |
| 1440 Hickory Ln Birmingham, AL | 3.0 | 2.0 | 1448 | $1,625 | $1.12 | 3d | 1 | 0.88mi |
| 1153 Linwood St Birmingham, AL | 3.0 | 2.0 | 1250 | $1,295 | $1.04 | 4d | 1 | 0.94mi |
| 1700 Serene Dr Birmingham, AL | 4.0 | 1.5 | 1543 | $1,630 | $1.06 | 3d | 1 | 0.95mi |
| 1237 Linwood St Birmingham, AL | 3.0 | 1.5 | 1066 | $995 | $0.93 | 45d | 1 | 0.98mi |
| 405 13th Ct NW Center Point, AL | 4.0 | 1.5 | 1248 | $1,415 | $1.13 | 23d | 1 | 1.02mi |
| 1225 Birchwood St Birmingham, AL | 3.0 | 2.0 | 1092 | $1,175 | $1.08 | 5d | 1 | 1.03mi |
| 324 13th Ter NW Center Point, AL | 3.0 | 1.5 | 1418 | $1,295 | $0.91 | 25d | 1 | 1.04mi |
| 520 Camellia Rd Birmingham, AL | 3.0 | 1.0 | 1053 | $1,100 | $1.04 | 5d | 1 | 1.08mi |
| 1516 Highland Dr Birmingham, AL | 4.0 | 2.0 | 1104 | $1,675 | $1.52 | 16d | 1 | 1.11mi |
| 1232 Oakwood St Birmingham, AL | 3.0 | 1.5 | 1301 | $1,223 | $0.94 | 25d | 1 | 1.12mi |
| 433 Orchid Rd Birmingham, AL | 3.0 | 1.0 | 1162 | $1,255 | $1.08 | 18d | 1 | 1.15mi |
| 1421 Brewster Cir Birmingham, AL | 3.0 | 2.0 | 1439 | $1,525 | $1.06 | 3d | 1 | 1.18mi |
| 1720 2nd St NE Center Point, AL | 3.0 | 2.0 | 1100 | $1,400 | $1.27 | 45d | 1 | 1.21mi |
| 1112 Violet Dr Birmingham, AL | 3.0 | 2.0 | 1414 | $1,600 | $1.13 | 13d | 1 | 1.22mi |
| 1628 1st St NW Center Point, AL | 3.0 | 1.0 | 1124 | $1,150 | $1.02 | 45d | 1 | 1.23mi |
| 1301 5th Pl NW Center Point, AL | 3.0 | 1.0 | 1170 | $1,100 | $0.94 | 5d | 1 | 1.23mi |
| 1305 5th Pl NW Center Point, AL | 3.0 | 2.0 | 1092 | $1,200 | $1.10 | 45d | 1 | 1.24mi |
| 1761 Big Mountain Dr Birmingham, AL | 4.0 | 2.0 | 1632 | $1,575 | $0.97 | 46d | 1 | 1.24mi |
| 1333 5th Pl NW Center Point, AL | 3.0 | 2.0 | 1056 | $1,275 | $1.21 | 45d | 1 | 1.26mi |
| 1177 Five Mile Rd Birmingham, AL | 3.0 | 2.0 | 1636 | $1,100 | $0.67 | 45d | 1 | 1.27mi |
HOA detail
- Monthly dues
- $30 · $360/yr
Listing history 16 events
-
2026-06-18days on market $159,900 Active 86 DOM
-
2026-06-17days on market $159,900 Active 85 DOM
-
2026-06-16days on market $159,900 Active 84 DOM
-
2026-06-15days on market $159,900 Active 83 DOM
-
2026-06-13days on market $159,900 Active 81 DOM
-
2026-06-10days on market $159,900 Active 78 DOM
-
2026-06-09days on market $159,900 Active 77 DOM
-
2026-06-08days on market $159,900 Active 76 DOM
-
2026-06-07days on market $159,900 Active 75 DOM
-
2026-06-03days on market $159,900 Active 71 DOM
-
2026-06-02days on market $159,900 Active 70 DOM
-
2026-06-01days on market $159,900 Active 69 DOM
-
2026-05-31days on market $159,900 Active 68 DOM
-
2026-03-22$159,900 Active 281-char remark
Show marketing remark (281 chars)
Charming 2-story townhome, located on a corner lot. This home features two bedrooms, and to full bathrooms on the second level. Living room, kitchen dining room, and laundry room on the first level. Partially rear covered patio and a two-car covered detached carport. Storage room.
-
2002-07-02soldstatus $79,900
-
1994-02-04soldstatus $76,785
ⓘ Source: listings_history table (triggers on properties + properties_extension) + one-shot
backfill from property_details.listing_events for pre-trigger history.
Tax reassessment forecast AL · Resets to sale price
- Current annual tax
- $907 · $76/mo
- Projected year-2 tax
- $907 · $76/mo
- Expected delta
- $0/yr ($0/mo · 0.0%)
ⓘ Screening estimate from a state-policy table — verify with the county assessor before closing.
Climate risk First Street
- Flood 1/10 Low FEMA zone X (unshaded) · 0% chance over 30 yrs
- Wildfire 3/10 Moderate
- Heat 6/10 Major 7 d/yr ≥105°F today · 19 d/yr by 30 yrs out
- Wind 6/10 Major 27% chance of damaging wind over 30 yrs
- Air quality 5/10 Major 7 unhealthy d/yr today · 9 by 30 yrs out
Nearby sold comps map
Loading sold comps map…
Walkable amenities ~0.75 mi
Loading nearby amenities…
Taxation est. · year 1
- Rental income
- $17,731
- − Mortgage interest
- −$8,957
- − Property taxes
- −$907
- − Insurance
- −$800
- − Repairs & maintenance
- −$1,418
- − Management
- −$1,418
- − HOA
- −$360
- − Depreciation
- −$4,652
- Taxable loss
- −$781
- Est. tax savings @ 24.0%
- +$188
- After-tax cash flow
- $2,066/yr
For passive investors: Depreciation is non-cash, so a rental often shows a tax loss while cash-flowing — sheltering income. Rental losses are passive: they offset passive income freely, and up to $25,000/yr can offset ordinary (W-2) income if you actively participate and your MAGI is under $100k (phasing out to $0 by $150k); unused losses carry forward. On sale, claimed depreciation is recaptured at up to 25%, and gains may owe capital-gains tax (a 1031 exchange can defer both). Figures are a year-1 estimate at your 24.0% rate — not tax advice; consult a CPA.
Schools (NCES district)
- District
- Birmingham City
- NCES district ID
- 0100390
- Math proficiency
- 4% ▼ -17.00%
- Reading proficiency
- 20% ▼ -4.00%
- Median HH income
- $31,988
- Composite
- 9.49/100
- National rank
- #9850
- State rank
- #116 of 129 in AL
Livability — Birmingham
- Score
- 67/100
- State rank
- #78
- US rank
- #10412
Category grades
Schools grade is shown separately in the Schools card above.
Census & demographics
- Census place
- Birmingham, AL
- County
- Jefferson County · 527,445 people
- City population
- 210,422
- Metro
- Birmingham-Hoover, AL
- Population (ZIP)
- 43,903
- Household income
- $52,793
- Rent vs Own
- Severe rent burden
- 1729.0
Population outlook (Jefferson County) Hauer SSP2
- Today (2025)
- 669,185 people
- By 2030
- 669,694 · +0.1%
- By 2040
- 661,388 · -1.2%
- By 2050
- 643,086 · -3.9%
- By 2075
- 577,267 · -13.7%
- By 2100
- 474,758 · -29.1%
Race, ethnicity, and origin ACS 2023
- Neighborhood character
- Predominantly Black (75%)
- Race & ethnicity
- Black 75% White 15% Hispanic / Latino 7% Two or more races 3%
- Hispanic origin (detail)
- Mexican 4%
- Common ancestry
- Lithuanian 1% Italian 1% Slovak 1%
- Foreign-born
- 4% · Canada
- Languages at home
- 92% English-only · Spanish 7%
Political lean MEDSL · Jefferson
- 2024 margin
- D (+10.4) · D 54.6% · R 44.2% · Other 1.2%
- 2008→2024 swing
- +5.4pp toward D · 2008: 5.1pp · 2024: 10.4pp
- All cycles
- 2024: D+10.4 2020: D+13.2 2016: D+7.2 2012: D+6.0 2008: D+5.1
Not yet ingested
- Civics
- —
Market trends
- HPI YoY
- ▼ -112.97%
- Current HPI
- 215.0607
- Rent YoY
- ▲ 3.04%
- Metro
- Birmingham-Hoover, AL
- State GDP YoY
- ▲ 2.94%
- F500 in state
- 4
Industry mix (Fortune 500 HQ in AL)
| Industry | F500 HQs | Revenue |
|---|---|---|
| Financial Services | 1 | $8B |
|
||
| Healthcare | 1 | $5B |
|
||
Price history
+108.2% since first listed3 events — show timeline
- 2026-03-22 Listed $159,900 Greater Alabama MLS
- 2002-07-02 Sold (Public Records) $79,900 Public Records
- 1994-02-04 Sold (Public Records) $76,785 Public Records
Property tax history
+7.5%/yrLatest (2025): $907 · +7.6% YoY. Source: county tax records.
Cash-flow waterfall
monthlySold comps — $/sqft
last 12 mo · ≤1 miLoading sold comps…