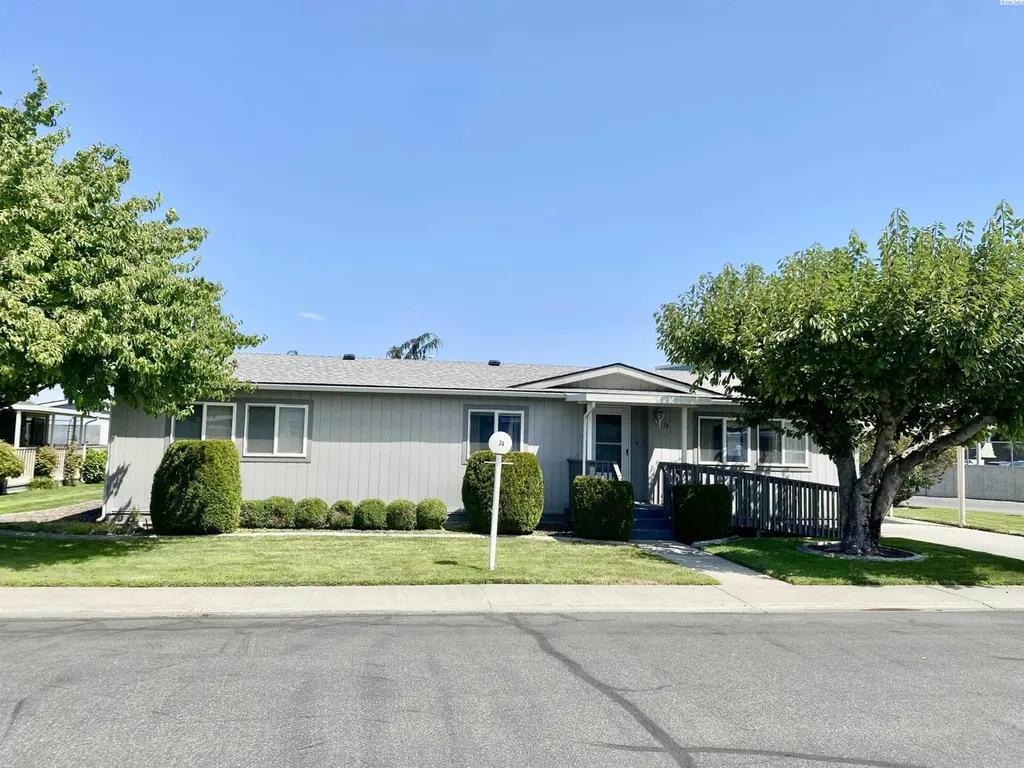
312 S Columbia Center Blvd Unit 74 Blvd #74 · Kennewick, WA
Flood risk 1/10 · Minimal
- FEMA flood zone
- X
- Chance of flooding over 30 yrs
- 0.0%
- Est. flood insurance / yr
- $507 – $1,088
Fire risk 4/10 · Minor
- Est. fire insurance / yr
- $604 – $1,122
Heat risk 5/10 · Moderate
- Hot days now (above 98°F)
- 7 days/yr
- Hot days in 30 yrs
- 14 days/yr
Wind risk 1/10 · Minimal
- Chance of severe wind over 30 yrs
- —
Air-quality risk 8/10 · Major
- Unhealthy air days now
- 14 days/yr
- Unhealthy air days in 30 yrs
- 15 days/yr
Risk factors via First Street. Map © Google.
Why this score? — see what drove the B+ grade
The composite is a weighted blend of 9 inputs, each scored 0–100. Each bar is that input's sub-score; the figure is the points it added to the 100-point composite (weight × sub-score).
- Cash flow +30.0/30.0
- ARV discount +15.0/15.0
- 1% rule +10.0/10.0
- DSCR +10.0/10.0
- Schools +4.6/10.0
- Livability +3.9/5.0
- Rent growth +3.3/5.0
- Condition / age +2.5/5.0
- Appreciation +0.0/10.0
$69,000
🖨 Deal sheet (PDF) 📄 Offer letter ✓ Due diligence
Listing remarks MLS
MLS# 289895 MLS# 286097 55 and over community in the heart of Kennewick. Extremely nice Community! They are very safe and well taken care of. This Valley Quality home has 3 bedrooms and 2 baths being just the right size to have gatherings, but not too large to take care of. No dogs are allowed here, but 2 indoor cats are. Park must approve all buyers. Come join this very quaint community of wonderful people!
Key facts
- Built 1993
- Listed 154 days
Neighborhood map
What this means for you Summary
Snapshot
- This is a 3-bed/2.0-bath manufactured listed at $69k.
Deal economics
- At list price, monthly cash flow is $1k ($13k/yr) — positive.
- The deal already cash-flows at list — no discount required.
- Meets the 1% rule at list price ($2k rent vs $69k).
- Recommended offer: $61k (12.0% below list) — sets the bar for market timing.
- Cap rate 25.8% vs local median 3.3% in Kennewick — top-decile yield for the area; either an underpriced asset or a hidden risk that comps aren't pricing in. Stress-test before assuming the spread holds.
Location & tenants
- Location reads 78/100 on livability (#131 in WA, #2,599 nationally) — a middle-class / working-renter tenant base. Strengths: commute A+, housing A+, health & safety A; Watch: schools D+, amenities D+, crime F.
- Kennewick School District (urban): math 43% / reading 58% proficiency, ranked #141 of 291 in WA (top 48%) — acceptable for families but not a draw, mixed tenant base, ~2y average lease.
- Market conditions: Rents rising (+3.4%/yr); 292 active listings in the ZIP; 16 comparable units currently listed for rent nearby; rentals lingering (median 45d on market — plan ~5-8 weeks vacancy on turnover, expect pricing pressure); 50% of comp listings sitting > 30 days — soft ceiling on asking rent; 1,532 units permitted in Benton County in 2024 (389 in 5+ unit buildings).
- This rent runs 38% of the median local income ($63k/yr) — at the standard rent-burdened threshold; future hikes will face affordability resistance.
Forward outlook
- Local home prices are declining (-3.0%/yr); year-one equity from $477 of loan paydown is wiped out by about $2k of value loss. Plan a longer hold.
- Benton County population projected at +32% by 2050 — long-run rental-demand tailwind backs the buy-and-hold thesis.
- At projected returns (-3.0% appreciation + 3.4% rent growth), your $19k cash investment doubles in ~2 years — after that, you're playing with house money.
Negotiation context
- It's been on market 155 days — a 12% lower offer ($61k) is reasonable based on typical stale-listing flexibility.
- 2 sale attempts since 6y ago; this cycle's ask has dropped $10k (13%) from the opening price — seller is motivated, your offer sets the floor, not the list.
Risks & watch-outs
- Climate carrying-cost: extreme-heat days projected 7→14/yr by 2055 (HVAC capex compounding) — expect insurance premiums to compound above CPI over the hold.
Questions for the listing agent
- It's been on market 155 days. Have you received any prior offers? Is the seller open to a 12% concession, seller financing, or rate buy-down credit?
- Why hasn't it sold? Are there any deal-killer items the seller is aware of (foundation, flood, title, zoning, code violations)?
- Is there a deadline driving the sale (1031 exchange, divorce, estate, relocation)? That informs how much negotiation room exists.
- Schools are D-rated, which usually means shorter tenancies and higher turnover. Who's the typical renter profile here, and what's been the actual vacancy rate?
- Crime grade is F in this area — have there been break-ins, vandalism, or insurance claims at this property in the last 3 years? What carrier currently insures it and at what premium?
- What's the average days-on-market for RENTAL listings here right now (not sales)? A rising rental-DOM trend means longer vacancies and softer asking-rent achievability than the comps imply.
- What's the recent tenant-quality profile in this submarket — average credit score on applications, eviction rate, late-payment / NSF rate, and stable-employment percentage? A property-management company in the area should have these aggregated.
- How much new for-sale + rental construction is in the pipeline within 1–3 miles? Heavy new supply typically softens prices + rents 12–24 months out; constrained supply supports both.
Investment metrics
- 1% rule
- 2.89% ✓
- Cap rate
- 25.85%
- Cash-on-cash
- 69.85%
- DSCR
- 4.11
- GRM
- 2.9
CMA / ARV
- ARV (median comp)
- $83,000
- List price
- $69,000
- Delta
- -16.87%
- Verdict
- UNDERPRICED
- Comps
- 18 within 1.0 mi
Show comp detail 12 sales within ~0.75 mi
| Address | Dist | Beds/Ba | Sqft | Sold | Price | $/sf | Match |
|---|---|---|---|---|---|---|---|
| 312 S Columbia Center Blvd. #95 Blvd #95 | 0.13mi | 3/2.0 | 1,440 (-1%) | 2mo | $34,250 | $24 | 90 |
| 312 S Columbia Center Blvd. #72 Blvd #72 | 0.09mi | 2/2.0 (-1) | 1,456 (0%) | 3mo | $43,000 | $30 | 89 |
| 312 S Columbia Center Blvd. #63 Blvd #63 | 0.03mi | 3/2.0 | 1,404 (-4%) | 6mo | $65,500 | $47 | 88 |
| 312 S Columbia Center Blvd #69 | 0.05mi | 3/2.0 | 1,484 (+2%) | 9mo | $62,000 | $42 | 86 |
| 312 S Columbia Center Blvd Unit 21 Blvd #21 | 0.11mi | 3/2.0 | 1,456 (0%) | 11mo | $129,000 | $89 | 86 |
| 312 S Columbia Center Blvd. #56 Blvd #56 | 0.05mi | 2/2.0 (-1) | 1,512 (+4%) | 11mo | $118,500 | $78 | 77 |
| 7901 W Clearwater Ave #108 | 0.16mi | 3/2.0 | 1,560 (+7%) | 8mo | $91,500 | $59 | 74 |
| 312 S Columbia Center Blvd #71 Blvd #71 | 0.08mi | 3/2.0 | 1,296 (-11%) | 7mo | $70,000 | $54 | 73 |
| 312 S Columbia Center Blvd #90 | 0.10mi | 3/2.0 | 1,620 (+11%) | 11mo | $110,000 | $68 | 68 |
| 7901 W Clearwater Ave #154 Ave | 0.24mi | 3/2.0 | 1,296 (-11%) | 5mo | $90,000 | $69 | 66 |
| 7901 W Clearwater Ave #137 | 0.30mi | 3/2.0 | 1,296 (-11%) | 2mo | $102,500 | $79 | 66 |
| 7901 W Clearwater Avenue #167 Ave #167 | 0.24mi | 3/2.0 | 1,248 (-14%) | 2mo | $90,000 | $72 | 63 |
Match score weights: distance 35% · size 25% · config 20% · recency 20%. Top-matched comps best support the ARV.
Projected returns pro-forma
-3.0% appreciation · 3.39% rent growth · sell at horizon
- IRR
- 69.8%
- Equity multiple
- 4.17×
- Total profit
- $61,241
- Equity at exit
- $10,288
- IRR
- 74.0%
- Equity multiple
- 8.71×
- Total profit
- $148,863
- Equity at exit
- $5,966
Cash invested: $19,320 (down + closing). Projections, not guarantees.
Landlord ↔ Tenant lean methodology
- Overall (STATE)
- 28 Tenant-Leaning
- State Washington
- 28 Tenant-Leaning · D+8
- County
- — inherits STATE
- City
- — inherits STATE
ZIP-level market 99336
- Rents YoY
- 3.4%
- Active inventory
- 292
- Price-to-rent
- 2.9×
Monthly cashflow live
- Estimated rent
- $1,995 high interval (Pro) →
- Mortgage (P&I)
- −$362
- Tax from tax record
- −$61 /mo · $734/yr
- Insurance
- −$29
- HOA
- −$0
- Vacancy / Maint / Mgmt
- −$419
- Net cashflow
- $1,125
Break-even live
Sensitivity live
| Price | -10% $1,164 | -5% $1,144 | +0% $1,125 | +5% $1,105 | +10% $1,085 |
|---|---|---|---|---|---|
| Rent | -10% $967 | -5% $1,046 | +0% $1,125 | +5% $1,203 | +10% $1,282 |
| Rate | -1.0pp $1,159 | -0.5pp $1,142 | base $1,125 | +0.5pp $1,107 | +1.0pp $1,088 |
UW: 25.0% down · 7.5% · 30yr · 1.5% tax · 5.0% vac · 8.0% maint · 8.0% mgmt
Financing live
Cash to close
- Down payment
- $17,250
- Closing costs
- $2,070
- Reserves months
- —
- Total cash needed
- —
Loan-product check · same deal, 3 products live
Conventional
25% down · 7.5% · 30yr
- Down + closing
- —
- Monthly P&I
- —
- Monthly cashflow
- —
- DSCR
- —
- Eligible?
- —
Personal DTI + credit; lowest rate.
DSCR
20% down · 8.5% · 30yr
- Down + closing
- —
- Monthly P&I
- —
- Monthly cashflow
- —
- DSCR
- —
- Eligible?
- —
No personal income docs; deal must DSCR.
Hard money
10% down · 12.0% · 12mo
- Down + closing
- —
- Monthly P&I
- —
- Monthly cashflow
- —
- DSCR
- —
- Eligible?
- —
Short-term bridge; refi at stabilization.
Rent comps 16 comps
| Address | Beds | Baths | Sqft | Rent | $/sqft | DOM | Units | Dist |
|---|---|---|---|---|---|---|---|---|
| 7803 W Deschutes Ave Kennewick, WA | 1.0–3.0 | 1.0–2.0 | 925 | $2,010 | $2.17 | 15d | 13 | 0.26mi |
| 502 S Florida Pl Kennewick, WA | 2.0 | 1.0 | 1003 | $1,850 | $1.84 | 45d | 1 | 0.31mi |
| 8180 W 4th Ave Kennewick, WA | 2.0–3.0 | 2.0 | 1202 | $2,299 | $1.91 | 15d | 4 | 0.39mi |
| 7960 W 10th Ave Kennewick, WA | 1.0–2.0 | 1.0–2.0 | 946 | $2,345 | $2.48 | 15d | 9 | 0.63mi |
| 7968 W 10th Ave Kennewick, WA | 1.0–3.0 | 1.0–2.0 | 951 | $2,200 | $2.31 | 15d | 10 | 0.65mi |
| 6809 W Kennewick Ave Unit C Kennewick, WA | 2.0 | 1.0 | 1043 | $1,250 | $1.20 | 45d | 1 | 0.72mi |
| 24 S Quay St Unit 3 Kennewick, WA | 3.0 | 1.5 | 1128 | $1,625 | $1.44 | 15d | 1 | 0.80mi |
| 8831 W Entiat Ave Kennewick, WA | 3.0 | 2.0 | 1232 | $1,995 | $1.62 | 45d | 1 | 0.86mi |
| 725 N Center Pkwy Kennewick, WA | 1.0–3.0 | 1.0–2.0 | 1086 | $2,195 | $2.02 | 15d | 9 | 0.88mi |
| 1080 N Montana St Kennewick, WA | 3.0 | 2.0 | 1842 | $2,600 | $1.41 | 45d | 1 | 0.96mi |
| 883 S Zeelar St Kennewick, WA | 3.0 | 2.5 | 1735 | $2,395 | $1.38 | 45d | 1 | 1.29mi |
| 33 N Jefferson Pl Unit 110 Kennewick, WA | 3.0 | 2.5 | 1536 | $1,950 | $1.27 | 45d | 1 | 1.32mi |
| 5702 W Kennewick Pl #110 Kennewick, WA | 3.0 | 2.5 | 1435 | $1,695 | $1.18 | 15d | 1 | 1.37mi |
| 100 N Irving Pl Kennewick, WA | 1.0–3.0 | 1.0–1.5 | 939 | $1,750 | $1.86 | 15d | 11 | 1.44mi |
| 100 N Irving Pl Unit K101 Kennewick, WA | 3.0 | 1.5 | 1120 | $1,700 | $1.52 | 45d | 1 | 1.44mi |
| 100 N Irving Pl Unit H101 Kennewick, WA | 3.0 | 1.5 | 1120 | $1,699 | $1.52 | 45d | 1 | 1.44mi |
Listing history 25 events
-
2026-06-21days on market $69,000 Active 155 DOM
-
2026-06-18days on market $69,000 Active 152 DOM
-
2026-06-17days on market $69,000 Active 151 DOM
-
2026-06-16days on market $69,000 Active 150 DOM
-
2026-06-15days on market $69,000 Active 149 DOM
-
2026-06-14days on market $69,000 Active 147 DOM
-
2026-06-13days on market $69,000 Active 146 DOM
-
2026-06-10days on market $69,000 Active 144 DOM
-
2026-06-09days on market $69,000 Active 143 DOM
-
2026-06-08days on market $69,000 Active 142 DOM
-
2026-06-07days on market $69,000 Active 141 DOM
-
2026-06-05days on market $69,000 Active 138 DOM
-
2026-06-03days on market $69,000 Active 137 DOM
-
2026-06-02days on market $69,000 Active 136 DOM
-
2026-06-01days on market $69,000 Active 135 DOM
-
2026-05-31days on market $69,000 Active 134 DOM
-
2026-05-30days on market $69,000 Active 133 DOM
-
2026-04-24price $69,000 411-char remark
Show marketing remark (411 chars)
MLS# 289895 MLS# 286097 55 and over community in the heart of Kennewick. Extremely nice Community! They are very safe and well taken care of. This Valley Quality home has 3 bedrooms and 2 baths being just the right size to have gatherings, but not too large to take care of. No dogs are allowed here, but 2 indoor cats are. Park must approve all buyers. Come join this very quaint community of wonderful people!
-
2026-01-17$79,000 Active 411-char remark
Show marketing remark (411 chars)
MLS# 289895 MLS# 286097 55 and over community in the heart of Kennewick. Extremely nice Community! They are very safe and well taken care of. This Valley Quality home has 3 bedrooms and 2 baths being just the right size to have gatherings, but not too large to take care of. No dogs are allowed here, but 2 indoor cats are. Park must approve all buyers. Come join this very quaint community of wonderful people!
-
2025-10-02price $79,000
-
2025-09-02price $90,000
-
2025-08-20price $100,000
-
2025-08-15price $105,000
-
2020-12-29soldstatus $95,000
-
2020-10-08$99,000
ⓘ Source: listings_history table (triggers on properties + properties_extension) + one-shot
backfill from property_details.listing_events for pre-trigger history.
Tax reassessment forecast WA · Resets to sale price
- Current annual tax
- $734 · $61/mo
- Projected year-2 tax
- $734 · $61/mo
- Expected delta
- $0/yr ($0/mo · 0.0%)
ⓘ Screening estimate from a state-policy table — verify with the county assessor before closing.
Climate risk First Street
- Flood 1/10 Low FEMA zone X · 0% chance over 30 yrs
- Wildfire 4/10 Moderate
- Heat 5/10 Major 7 d/yr ≥98°F today · 14 d/yr by 30 yrs out
- Wind 1/10 Low
- Air quality 8/10 Severe 14 unhealthy d/yr today · 15 by 30 yrs out
Nearby sold comps map
Loading sold comps map…
Walkable amenities ~0.75 mi
Loading nearby amenities…
Taxation est. · year 1
- Rental income
- $23,944
- − Mortgage interest
- −$3,865
- − Property taxes
- −$734
- − Insurance
- −$345
- − Repairs & maintenance
- −$1,915
- − Management
- −$1,915
- − Depreciation
- −$2,007
- Taxable income
- $13,161
- Est. tax owed @ 24.0%
- −$3,159
- After-tax cash flow
- $10,336/yr
For passive investors: Depreciation is non-cash, so a rental often shows a tax loss while cash-flowing — sheltering income. Rental losses are passive: they offset passive income freely, and up to $25,000/yr can offset ordinary (W-2) income if you actively participate and your MAGI is under $100k (phasing out to $0 by $150k); unused losses carry forward. On sale, claimed depreciation is recaptured at up to 25%, and gains may owe capital-gains tax (a 1031 exchange can defer both). Figures are a year-1 estimate at your 24.0% rate — not tax advice; consult a CPA.
Schools (NCES district)
- District
- Kennewick School District
- NCES district ID
- 5303930
- Math proficiency
- 43% ▼ -1.00%
- Reading proficiency
- 58% ▬ 0.00%
- Median HH income
- $54,191
- Composite
- 45.56/100
- National rank
- #5667
- State rank
- #141 of 291 in WA
Livability — Kennewick
- Score
- 78/100
- State rank
- #131
- US rank
- #2599
Category grades
Schools grade is shown separately in the Schools card above.
Census & demographics
- Census place
- Kennewick, WA
- County
- Benton County · 186,895 people
- City population
- 104,655
- Metro
- Kennewick-Richland, WA
- Population (ZIP)
- 50,735
- Household income
- $62,527
- Rent vs Own
- Severe rent burden
- 2605.0
Population outlook (Benton County) Hauer SSP2
- Today (2025)
- 219,421 people
- By 2030
- 233,813 · +6.6%
- By 2040
- 262,134 · +19.5%
- By 2050
- 290,100 · +32.2%
- By 2075
- 363,525 · +65.7%
- By 2100
- 418,667 · +90.8%
Race, ethnicity, and origin ACS 2023
- Neighborhood character
- Diverse neighborhood (Simpson 0.56)
- Race & ethnicity
- White 55% Hispanic / Latino 37% Two or more races 15% Black 3% Asian 2% Native American 1%
- Hispanic origin (detail)
- Mexican 31% Cuban 2%
- Common ancestry
- Portuguese 4% Slovak 3% Romanian 1%
- Foreign-born
- 16% · Canada, Jamaica
- Languages at home
- 68% English-only · Spanish 29% Arabic 1%
Political lean MEDSL · Benton
- 2024 margin
- Strong R (+21.9) · D 37.7% · R 59.6% · Other 2.7%
- 2008→2024 swing
- +4.2pp toward D · 2008: -26.1pp · 2024: -21.9pp
- All cycles
- 2024: R+21.9 2020: R+21.0 2016: R+26.6 2012: R+27.0 2008: R+26.1
Not yet ingested
- Civics
- —
Market trends
- HPI YoY
- ▼ -408.26%
- Current HPI
- 256.1143
- Rent YoY
- ▲ 3.39%
- Metro
- Kennewick-Richland, WA
- State GDP YoY
- ▲ 4.65%
- F500 in state
- 22
Industry mix (Fortune 500 HQ in WA)
| Industry | F500 HQs | Revenue |
|---|---|---|
| Retail | 2 | $269B |
|
||
| Technology / Retail | 1 | $638B |
|
||
| Technology | 1 | $245B |
|
||
| Telecommunications | 1 | $38B |
|
||
| Food / Beverage | 1 | $36B |
|
||
| Automotive / Trucks | 1 | $34B |
|
||
Price history
-30.3% since first listed8 events — show timeline
- 2026-04-24 Price Changed $69,000 PACMLS
- 2026-01-17 Listed $79,000 PACMLS
- 2025-10-02 Price Changed $79,000 PACMLS
- 2025-09-02 Price Changed $90,000 PACMLS
- 2025-08-20 Price Changed $100,000 PACMLS
- 2025-08-15 Price Changed $105,000 PACMLS
- 2020-12-29 Sold (MLS) $95,000 PACMLS
- 2020-10-08 Listed $99,000 PACMLS
Property tax history
+1.8%/yrLatest (2026): $734 · -5.7% YoY. Source: county tax records.
Cash-flow waterfall
monthlySold comps — $/sqft
last 12 mo · ≤1 miLoading sold comps…