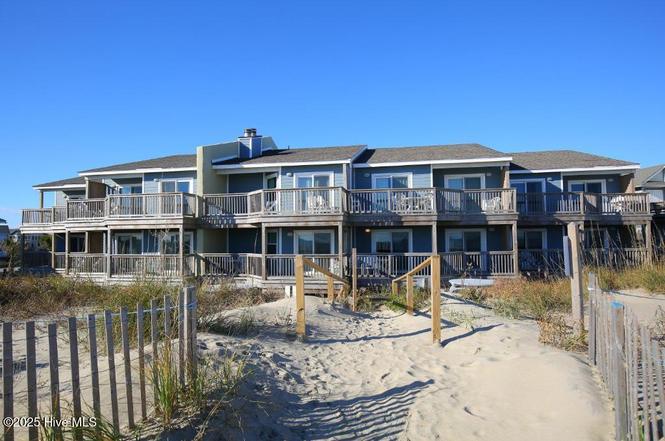
1445 Duck Rd Bldg A · Duck, NC
Flood risk 6/10 · Moderate
- FEMA flood zone
- VE
- Chance of flooding over 30 yrs
- 0.87%
- Est. flood insurance / yr
- $5,013 – $11,043
Fire risk 1/10 · Minimal
- Est. fire insurance / yr
- $906 – $1,684
Heat risk 9/10 · Severe
- Hot days now (above 101°F)
- 7 days/yr
- Hot days in 30 yrs
- 20 days/yr
Wind risk 9/10 · Severe
- Chance of severe wind over 30 yrs
- 99.0%
Air-quality risk 2/10 · Minimal
- Unhealthy air days now
- 1 days/yr
- Unhealthy air days in 30 yrs
- 1 days/yr
Risk factors via First Street. Map © Google.
Why this score? — see what drove the D grade
The composite is a weighted blend of 9 inputs, each scored 0–100. Each bar is that input's sub-score; the figure is the points it added to the 100-point composite (weight × sub-score).
- Cash flow +15.0/30.0
- ARV discount +7.5/15.0
- 1% rule +5.0/10.0
- DSCR +5.0/10.0
- Schools +4.0/10.0
- Livability +3.5/5.0
- Rent growth +2.5/5.0
- Condition / age +2.5/5.0
- Appreciation +0.0/10.0
$5,000
🖨 Deal sheet 📄 Offer letter ✓ Due diligence
Listing remarks
Rare opportunity to own a fixed week timeshare at Ocean Pines in Duck, NC! These are one-week ownerships in 1-bedroom and 2-bedroom suites ranging in price during the summer, shoulder, and off seasons —with no rotating schedule. perfect for those who love returning to the Outer Banks annually. Each unit features a full kitchen, living area, private balcony, and can accommodate up to six guests—ideal for a relaxing beach getaway. Conveniently close to local dining, shopping, and entertainment, Ocean Pines combines coastal comfort with vacation convenience and its something you can enjoy FOREVER!
Key facts
- Full kitchen
- Private balcony
- Coastal comfort
Tags
Property features AI
Finance
- Other: Zoned R-2
- Financial info: Association fee is $1,270 annually (approx. $105.83/month)
- HOA & community: Homeowners association; Association amenities include barbecue, beach access, fitness center, game room, indoor pool, laundry, picnic area, and tennis courts; Annual association fee
Exterior
- Parking: Attached covered parking; Additional parking and parking lot
- Home design: Residential timeshare; One level; Pillar/post/pier foundation
- Construction: Shingle roof; Pillar/Post/Pier foundation
- Exterior features: Wood fencing; Shingle roof; In-ground pool; Located on a cul-de-sac; Oceanfront frontage; Private paved road access; Waterfront with a view
Interior
- Bedrooms: Total of 4 rooms
- Bathrooms: 2 full bathrooms
- Heating & cooling: Central air conditioning; Electric heating; Heat pump
- Interior features: Furnished; Balcony
- Laundry & utility: Laundry available (association amenity)
Neighborhood map
What this means for you Summary
Snapshot
- This is a 2-bed/2.0-bath single-family listed at $5k.
Deal economics
- At list price, monthly cash flow is $878 ($11k/yr) — positive.
- The deal already cash-flows at list — no discount required.
- Meets the 1% rule at list price ($2k rent vs $5k).
- Recommended offer: $4k (12.0% below list) — sets the bar for market timing.
- Cap rate 377.5% vs local median 1.2% in Duck — top-decile yield for the area; either an underpriced asset or a hidden risk that comps aren't pricing in. Stress-test before assuming the spread holds.
Location & tenants
- Location reads 69/100 on livability (#162 in NC) — a middle-class / working-renter tenant base. Strengths: employment A+, health & safety A+, crime A; Watch: amenities F, commute F, cost of living F.
- Dare County Schools (town): math 44% / reading 48% proficiency, ranked #77 of 178 in NC (top 43%) — families likely to look elsewhere, expect single-tenant / working-renter base with shorter leases.
- Market conditions: 126 active listings in the ZIP; 371 units permitted in Dare County in 2024 (0 in 5+ unit buildings).
Forward outlook
- Local home prices are declining (-3.0%/yr); year-one equity from $35 of loan paydown is wiped out by about $150 of value loss. Plan a longer hold.
- Dare County population projected at +14% by 2050 — modest demand growth; plan on rents tracking national, not racing it.
- At projected returns (-3.0% appreciation + 3.0% rent growth), your $1k cash investment doubles in ~1 year — after that, you're playing with house money.
Negotiation context
- It's been on market 189 days — a 12% lower offer ($4k) is reasonable based on typical stale-listing flexibility.
Risks & watch-outs
- Watch-outs: flood insurance adds $669/mo.
- Climate carrying-cost: in FEMA flood zone VE (mandatory federal flood insurance); severe wind risk, 99% chance of damaging wind over 30y; extreme-heat days projected 7→20/yr by 2055 (HVAC capex compounding) — expect insurance premiums to compound above CPI over the hold.
Questions for the listing agent
- It's been on market 189 days. Have you received any prior offers? Is the seller open to a 12% concession, seller financing, or rate buy-down credit?
- What's the actual annual flood-insurance premium (NFIP or private), and is the property in a SFHA with mandatory coverage?
- What does the HOA fee cover, when was the last increase, and are there any pending special assessments or reserve-fund shortfalls?
- Why hasn't it sold? Are there any deal-killer items the seller is aware of (foundation, flood, title, zoning, code violations)?
- Is there a deadline driving the sale (1031 exchange, divorce, estate, relocation)? That informs how much negotiation room exists.
- The area grade is low — what's the realistic commute time and amenity access for the typical tenant pool here? Any planned neighborhood developments (good or bad) we should know about?
- What's the average days-on-market for RENTAL listings here right now (not sales)? A rising rental-DOM trend means longer vacancies and softer asking-rent achievability than the comps imply.
- What's the recent tenant-quality profile in this submarket — average credit score on applications, eviction rate, late-payment / NSF rate, and stable-employment percentage? A property-management company in the area should have these aggregated.
- How much new for-sale + rental construction is in the pipeline within 1–3 miles? Heavy new supply typically softens prices + rents 12–24 months out; constrained supply supports both.
Investment metrics
- 1% rule
- 42.71% ✓
- Cap rate
- 377.47%
- Cash-on-cash
- 1325.62%
- DSCR
- 59.98
- GRM
- 0.2
CMA / ARV
No comps found within radius.
Projected returns pro-forma
-3.0% appreciation · 3.0% rent growth · sell at horizon
- IRR
- —
- Equity multiple
- 40.71×
- Total profit
- $55,590
- Equity at exit
- $746
- IRR
- —
- Equity multiple
- 88.46×
- Total profit
- $122,442
- Equity at exit
- $432
Cash invested: $1,400 (down + closing). Projections, not guarantees.
Landlord ↔ Tenant lean methodology
- Overall (STATE)
- 85 Strongly Landlord-Friendly
- State North Carolina
- 85 Strongly Landlord-Friendly · R+3
- County
- — inherits STATE
- City
- — inherits STATE
ZIP-level market 27949
- Active inventory
- 126
- Price-to-rent
- 0.2×
Monthly cashflow live
- Estimated rent
- $2,136 medium interval (Pro) →
- Mortgage (P&I)
- −$26
- Tax est. 1.5%
- −$6 /mo · $75/yr
- Insurance
- −$2
- Flood insurance flood zone
- −$669 /mo · $8,028/yr
- HOA
- −$106
- Vacancy / Maint / Mgmt
- −$448
- Net cashflow
- $878
Break-even live
UW: 25.0% down · 7.5% · 30yr · 1.5% tax · 5.0% vac · 8.0% maint · 8.0% mgmt
Financing live
Cash to close
- Down payment
- $1,250
- Closing costs
- $150
- Reserves months
- —
- Total cash needed
- —
Loan-product check · same deal, 3 products live
Conventional
25% down · 7.5% · 30yr
- Down + closing
- —
- Monthly P&I
- —
- Monthly cashflow
- —
- DSCR
- —
- Eligible?
- —
Personal DTI + credit; lowest rate.
DSCR
20% down · 8.5% · 30yr
- Down + closing
- —
- Monthly P&I
- —
- Monthly cashflow
- —
- DSCR
- —
- Eligible?
- —
No personal income docs; deal must DSCR.
Hard money
10% down · 12.0% · 12mo
- Down + closing
- —
- Monthly P&I
- —
- Monthly cashflow
- —
- DSCR
- —
- Eligible?
- —
Short-term bridge; refi at stabilization.
HOA detail
- Monthly dues
- $106 · $1,272/yr
Listing history 15 events
-
2026-06-18days on market $5,000 Active 189 DOM
-
2026-06-17days on market $5,000 Active 188 DOM
-
2026-06-16days on market $5,000 Active 187 DOM
-
2026-06-15days on market $5,000 Active 186 DOM
-
2026-06-13days on market $5,000 Active 184 DOM
-
2026-06-12days on market $5,000 Active 183 DOM
-
2026-06-09days on market $5,000 Active 180 DOM
-
2026-06-08days on market $5,000 Active 179 DOM
-
2026-06-07days on market $5,000 Active 178 DOM
-
2026-06-07days on market $5,000 Active 177 DOM
-
2026-06-04days on market $5,000 Active 174 DOM
-
2026-06-02days on market $5,000 Active 173 DOM
-
2026-06-01days on market $5,000 Active 172 DOM
-
2026-05-31days on market $5,000 Active 171 DOM
-
2025-07-02$5,000 Active
ⓘ Source: listings_history table (triggers on properties + properties_extension) + one-shot
backfill from property_details.listing_events for pre-trigger history.
Climate risk First Street
- Flood 6/10 Major FEMA zone VE · 87% chance over 30 yrs
- Wildfire 1/10 Low
- Heat 9/10 Extreme 7 d/yr ≥101°F today · 20 d/yr by 30 yrs out
- Wind 9/10 Extreme 99% chance of damaging wind over 30 yrs
- Air quality 2/10 Low 1 unhealthy d/yr today · 1 by 30 yrs out
Nearby sold comps map
Loading sold comps map…
Walkable amenities ~0.75 mi
Loading nearby amenities…
Taxation est. · year 1
- Rental income
- $25,627
- − Mortgage interest
- −$280
- − Property taxes
- −$75
- − Insurance
- −$8,053
- − Repairs & maintenance
- −$2,050
- − Management
- −$2,050
- − HOA
- −$1,272
- − Depreciation
- −$145
- Taxable income
- $11,701
- Est. tax owed @ 24.0%
- −$2,808
- After-tax cash flow
- $7,722/yr
For passive investors: Depreciation is non-cash, so a rental often shows a tax loss while cash-flowing — sheltering income. Rental losses are passive: they offset passive income freely, and up to $25,000/yr can offset ordinary (W-2) income if you actively participate and your MAGI is under $100k (phasing out to $0 by $150k); unused losses carry forward. On sale, claimed depreciation is recaptured at up to 25%, and gains may owe capital-gains tax (a 1031 exchange can defer both). Figures are a year-1 estimate at your 24.0% rate — not tax advice; consult a CPA.
Schools (NCES district)
- District
- Dare County Schools
- NCES district ID
- 3701110
- Math proficiency
- 44% ▼ -4.00%
- Reading proficiency
- 48% ▼ -7.00%
- Median HH income
- $54,233
- Composite
- 39.86/100
- National rank
- #3866
- State rank
- #77 of 178 in NC
Livability — Duck
- Score
- 69/100
- State rank
- #162
- US rank
- #8831
Category grades
Schools grade is shown separately in the Schools card above.
Census & demographics
- Census place
- Duck, NC
- Population (ZIP)
- 8,094
Population outlook (Dare County) Hauer SSP2
- Today (2025)
- 39,201 people
- By 2030
- 40,756 · +4.0%
- By 2040
- 43,015 · +9.7%
- By 2050
- 44,477 · +13.5%
- By 2075
- 48,522 · +23.8%
- By 2100
- 50,980 · +30.0%
Race, ethnicity, and origin ACS 2023
- Neighborhood character
- Predominantly White (91%)
- Race & ethnicity
- White 91% Two or more races 5% Hispanic / Latino 2%
- Common ancestry
- Romanian 4% Slovak 4% Serbian 2%
- Foreign-born
- 5% · Canada
- Languages at home
- 94% English-only · Spanish 4% German/W. Germanic 1% Tagalog/Filipino 1%
Political lean MEDSL · Dare
- 2024 margin
- R (+18.8) · D 40.1% · R 58.9%
- 2008→2024 swing
- -9.5pp toward R · 2008: -9.2pp · 2024: -18.8pp
- All cycles
- 2024: R+18.8 2020: R+16.5 2016: R+22.1 2012: R+16.1 2008: R+9.2
Not yet ingested
- Civics
- —
Market trends
- HPI YoY
- ▼ -196.21%
- Current HPI
- 274.0118
- Rent YoY
- —
- Metro
- —
- State GDP YoY
- ▲ 3.28%
- F500 in state
- 26
Industry mix (Fortune 500 HQ in NC)
| Industry | F500 HQs | Revenue |
|---|---|---|
| Financial Services | 2 | $213B |
|
||
| Retail | 2 | $95B |
|
||
| Industrial Conglomerate | 1 | $38B |
|
||
| Metals / Steel | 1 | $35B |
|
||
| Utilities | 1 | $30B |
|
||
| Industrial Machinery | 1 | $19B |
|
||
Price history
1 event — show timeline
- 2025-07-02 Listed $5,000 Hive MLS
Cash-flow waterfall
monthlySold comps — $/sqft
last 12 mo · ≤1 miLoading sold comps…