7801 34th Ave N · St. Petersburg, FL
Flood risk 1/10 · Minimal
- FEMA flood zone
- X (unshaded)
- Chance of flooding over 30 yrs
- 0.0%
- Est. flood insurance / yr
- $507 – $1,088
Fire risk 1/10 · Minimal
- Est. fire insurance / yr
- $947 – $1,759
Heat risk 10/10 · Severe
- Hot days now (above 107°F)
- 7 days/yr
- Hot days in 30 yrs
- 25 days/yr
Wind risk 10/10 · Severe
- Chance of severe wind over 30 yrs
- 99.0%
Air-quality risk 4/10 · Minor
- Unhealthy air days now
- 4 days/yr
- Unhealthy air days in 30 yrs
- 4 days/yr
Risk factors via First Street. Map © Google.
Why this score? — see what drove the B- grade
The composite is a weighted blend of 9 inputs, each scored 0–100. Each bar is that input's sub-score; the figure is the points it added to the 100-point composite (weight × sub-score).
- Cash flow +30.0/30.0
- 1% rule +10.0/10.0
- DSCR +10.0/10.0
- ARV discount +7.5/15.0
- Schools +4.3/10.0
- Livability +2.5/5.0
- Condition / age +2.5/5.0
- Rent growth +2.4/5.0
- Appreciation +0.0/10.0
$66,000
🖨 Deal sheet 📄 Offer letter ✓ Due diligence
Listing remarks
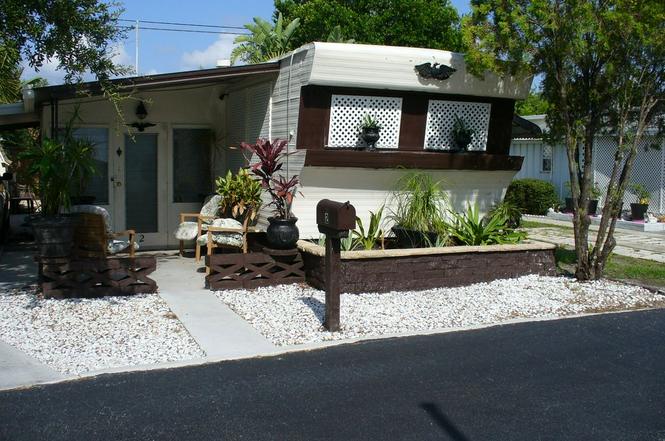
"NEW MOON" mobile home in 55+ RESIDENT OWNED park in one of the best and safest neighborhoods in St. Petersburg. Owned for 21 years by non smoking older handyman and veteran. Fully furnished = 50" Sony LED TV, surround sound system, leather furniture, zero gravity recliner, memory foam mattress, locker, office, file cabinet & jewelry chest. Huge yard (one of best lots in the park), no neighbors on two sides means privacy, 2 patios, 5 gardens, enclosed porch, covered carport with parking for two, newer appliances = propane stove, refrigerator, wall AC, combo washer/dryer, micro/convection/air fryer, bathroom vanity and toilet and water filter in kitchen sink. Mobile is 4
Key facts
- Huge yard
- Two patios
- Resident owned park
Tags
Neighborhood map
What this means for you Summary
Snapshot
- This is a 2-bed/1.0-bath manufactured listed at $66k.
Deal economics
- At list price, monthly cash flow is $1k ($17k/yr) — positive.
- The deal already cash-flows at list — no discount required.
- Meets the 1% rule at list price ($2k rent vs $66k).
- Recommended offer: $58k (12.0% below list) — sets the bar for market timing.
- Cap rate 32.6% vs local median 2.6% in St. Petersburg — top-decile yield for the area; either an underpriced asset or a hidden risk that comps aren't pricing in. Stress-test before assuming the spread holds.
Location & tenants
- Location reads: area grade B — affects rentability + tenant quality, not the cash-flow math above.
- Pinellas (suburban): math 51% / reading 51% proficiency, ranked #31 of 73 in FL (top 42%) — acceptable for families but not a draw, mixed tenant base, ~2y average lease.
- Market conditions: Rents soft (-0.5%/yr); 313 active listings in the ZIP; 26 comparable units currently listed for rent nearby; rentals at typical pace (median 18d on market — plan ~3-4 weeks tenant-placement turnaround); solid renter incomes; 2,676 units permitted in Pinellas County in 2024 (1,422 in 5+ unit buildings).
- This rent runs 37% of the median local income ($79k/yr) — at the standard rent-burdened threshold; future hikes will face affordability resistance.
Forward outlook
- Local home prices are declining (-3.0%/yr); year-one equity from $456 of loan paydown is wiped out by about $2k of value loss. Plan a longer hold.
- Pinellas County population projected at +14% by 2050 — modest demand growth; plan on rents tracking national, not racing it.
- At projected returns (-3.0% appreciation + 0.0% rent growth), your $18k cash investment doubles in ~2 years — after that, you're playing with house money.
Negotiation context
- It's been on market 148 days — a 12% lower offer ($58k) is reasonable based on typical stale-listing flexibility.
- 3 sale attempts since 12y ago; this cycle's ask has dropped $12k (16%) from the opening price — seller is motivated, your offer sets the floor, not the list.
Risks & watch-outs
- Watch-outs: built in 1959 — expect roof / HVAC / electrical / plumbing capex.
- Climate carrying-cost: severe wind risk, 99% chance of damaging wind over 30y; extreme-heat days projected 7→25/yr by 2055 (HVAC capex compounding) — expect insurance premiums to compound above CPI over the hold.
Questions for the listing agent
- It's been on market 148 days. Have you received any prior offers? Is the seller open to a 12% concession, seller financing, or rate buy-down credit?
- Built in 1959 — when were the roof, HVAC, electrical panel, plumbing, and water heater last replaced?
- Why hasn't it sold? Are there any deal-killer items the seller is aware of (foundation, flood, title, zoning, code violations)?
- Is there a deadline driving the sale (1031 exchange, divorce, estate, relocation)? That informs how much negotiation room exists.
- What's the average days-on-market for RENTAL listings here right now (not sales)? A rising rental-DOM trend means longer vacancies and softer asking-rent achievability than the comps imply.
- What's the recent tenant-quality profile in this submarket — average credit score on applications, eviction rate, late-payment / NSF rate, and stable-employment percentage? A property-management company in the area should have these aggregated.
- How much new for-sale + rental construction is in the pipeline within 1–3 miles? Heavy new supply typically softens prices + rents 12–24 months out; constrained supply supports both.
Investment metrics
- 1% rule
- 3.65% ✓
- Cap rate
- 32.59%
- Cash-on-cash
- 93.93%
- DSCR
- 5.18
- GRM
- 2.3
CMA / ARV
No comps found within radius.
Projected returns pro-forma
-3.0% appreciation · 0.0% rent growth · sell at horizon
- IRR
- 91.4%
- Equity multiple
- 5.03×
- Total profit
- $74,410
- Equity at exit
- $9,841
- IRR
- 93.6%
- Equity multiple
- 9.46×
- Total profit
- $156,293
- Equity at exit
- $5,706
Cash invested: $18,480 (down + closing). Projections, not guarantees.
Landlord ↔ Tenant lean methodology
- Overall (STATE)
- 87 Strongly Landlord-Friendly
- State Florida
- 87 Strongly Landlord-Friendly · R+3
- County
- — inherits STATE
- City
- — inherits STATE
ZIP-level market 33710
- Rents YoY
- -0.5%
- Active inventory
- 313
- Price-to-rent
- 2.3×
Monthly cashflow live
- Estimated rent
- $2,408 high interval (Pro) →
- Mortgage (P&I)
- −$346
- Tax est. 1.5%
- −$82 /mo · $990/yr
- Insurance
- −$28
- HOA
- −$0
- Vacancy / Maint / Mgmt
- −$506
- Net cashflow
- $1,446
Break-even live
UW: 25.0% down · 7.5% · 30yr · 1.5% tax · 5.0% vac · 8.0% maint · 8.0% mgmt
Financing live
Cash to close
- Down payment
- $16,500
- Closing costs
- $1,980
- Reserves months
- —
- Total cash needed
- —
Loan-product check · same deal, 3 products live
Conventional
25% down · 7.5% · 30yr
- Down + closing
- —
- Monthly P&I
- —
- Monthly cashflow
- —
- DSCR
- —
- Eligible?
- —
Personal DTI + credit; lowest rate.
DSCR
20% down · 8.5% · 30yr
- Down + closing
- —
- Monthly P&I
- —
- Monthly cashflow
- —
- DSCR
- —
- Eligible?
- —
No personal income docs; deal must DSCR.
Hard money
10% down · 12.0% · 12mo
- Down + closing
- —
- Monthly P&I
- —
- Monthly cashflow
- —
- DSCR
- —
- Eligible?
- —
Short-term bridge; refi at stabilization.
Rent comps 26 comps
| Address | Beds | Baths | Sqft | Rent | $/sqft | DOM | Units | Dist |
|---|---|---|---|---|---|---|---|---|
| 3451 79th St N Saint Petersburg, FL | 2.0 | 2.0 | 1150 | $2,500 | $2.17 | 24d | 1 | 0.07mi |
| 3501 Boca Ciega Dr N Saint Petersburg, FL | 2.0 | 2.0 | 1144 | $3,400 | $2.97 | 4d | 1 | 0.32mi |
| 3855 39th Ave N St Petersburg, FL | 2.0 | 2.5 | 1100 | $1,850 | $1.68 | 22d | 1 | 0.38mi |
| 8036 25th Ave N Saint Petersburg, FL | 3.0 | 2.0 | 1250 | $2,600 | $2.08 | 4d | 1 | 0.70mi |
| 4653 78th Ln N St Petersburg, FL | 3.0 | 2.0 | 1312 | $2,695 | $2.05 | 24d | 1 | 0.72mi |
| 8002 48th Ave N Saint Petersburg, FL | 1.0 | 1.0 | 1050 | $2,000 | $1.90 | 3d | 1 | 0.80mi |
| 2901 70th St N Unit 1546478P St. Petersburg, FL | 3.0 | 2.0 | 1614 | $4,682 | $2.90 | 17d | 1 | 0.92mi |
| 2153 75th Way N Saint Petersburg, FL | 3.0 | 2.0 | 1410 | $3,500 | $2.48 | 22d | 1 | 0.92mi |
| 4930 72nd St N Saint Petersburg, FL | 2.0 | 1.0 | 1352 | $1,950 | $1.44 | 4d | 1 | 1.01mi |
| 1790 Russell Dr N Saint Petersburg, FL | 3.0 | 2.0 | 1277 | $2,800 | $2.19 | 4d | 1 | 1.08mi |
| 2871 67th St N Saint Petersburg, FL | 3.0 | 1.0 | 1075 | $2,500 | $2.33 | 24d | 1 | 1.13mi |
| 7600 16th Ave N Saint Petersburg, FL | 2.0 | 1.0 | 1243 | $2,200 | $1.77 | 12d | 1 | 1.16mi |
| 5357 81st St N #14 Saint Petersburg, FL | 2.0 | 2.0 | 1110 | $1,550 | $1.40 | 24d | 1 | 1.16mi |
| 6960 20th Ave N #501 St Petersburg, FL | 2.0 | 2.0 | 1150 | $1,995 | $1.73 | 24d | 1 | 1.21mi |
| 5521 80th St N #312 Saint Petersburg, FL | 1.0 | 1.0 | 1055 | $1,500 | $1.42 | 4d | 1 | 1.24mi |
| 5341 71st Way N Saint Petersburg, FL | 3.0 | 2.5 | 1807 | $4,100 | $2.27 | 4d | 1 | 1.27mi |
| 5136 68th St N Unit B St. Petersburg, FL | 3.0 | 1.0 | 1302 | $1,900 | $1.46 | 4d | 1 | 1.32mi |
| 1699 68th St N Saint Petersburg, FL | 3.0 | 1.0–2.0 | 775 | $1,975 | $2.55 | 2d | 43 | 1.37mi |
| 7238 55th Ave N Saint Petersburg, FL | 2.0 | 2.0 | 1085 | $1,899 | $1.75 | 18d | 1 | 1.38mi |
| 9071 47th Ave N St. Petersburg, FL | 2.0 | 2.0 | 1100 | $2,000 | $1.82 | 24d | 1 | 1.40mi |
| 5410 70th Way N Saint Petersburg, FL | 3.0 | 1.0 | 1160 | $2,100 | $1.81 | 4d | 1 | 1.40mi |
| 5410 70th Way N Saint Petersburg, FL | 3.0 | 1.0 | 1354 | $2,100 | $1.55 | 3d | 1 | 1.40mi |
| 1308 70th St N Unit 1308 St. Petersburg, FL | 2.0 | 1.5 | 1100 | $2,500 | $2.27 | 24d | 1 | 1.41mi |
| 7140 55th Ave N Saint Petersburg, FL | 3.0 | 2.0 | 1085 | $2,000 | $1.84 | 22d | 1 | 1.41mi |
| 5725 80th St N #210 Saint Petersburg, FL | 2.0 | 2.0 | 1125 | $1,900 | $1.69 | 24d | 1 | 1.41mi |
| 5750 80th St N St Petersburg, FL | 1.0–2.0 | 1.0–1.5 | 987 | $1,800 | $1.82 | 24d | 2 | 1.42mi |
Listing history 18 events
-
2026-06-18days on market $66,000 Active 148 DOM
-
2026-06-17days on market $66,000 Active 147 DOM
-
2026-06-16days on market $66,000 Active 146 DOM
-
2026-06-15days on market $66,000 Active 145 DOM
-
2026-06-13days on market $66,000 Active 143 DOM
-
2026-06-09days on market $66,000 Active 139 DOM
-
2026-06-08days on market $66,000 Active 138 DOM
-
2026-06-07days on market $66,000 Active 137 DOM
-
2026-06-04pricedays on market $66,000 Active 134 DOM
-
2026-06-03days on market $79,500 Active 133 DOM
-
2026-06-01days on market $79,500 Active 131 DOM
-
2026-05-31days on market $79,500 Active 130 DOM
-
2026-02-13price $79,500
-
2026-01-21$78,500 Active
-
2015-08-28historical
-
2014-06-14status Active
-
2014-06-10historical
-
2014-02-26$22,500 Active
ⓘ Source: listings_history table (triggers on properties + properties_extension) + one-shot
backfill from property_details.listing_events for pre-trigger history.
Climate risk First Street
- Flood 1/10 Low FEMA zone X (unshaded) · 0% chance over 30 yrs
- Wildfire 1/10 Low
- Heat 10/10 Extreme 7 d/yr ≥107°F today · 25 d/yr by 30 yrs out
- Wind 10/10 Extreme 99% chance of damaging wind over 30 yrs
- Air quality 4/10 Moderate 4 unhealthy d/yr today · 4 by 30 yrs out
Nearby sold comps map
Loading sold comps map…
Walkable amenities ~0.75 mi
Loading nearby amenities…
Taxation est. · year 1
- Rental income
- $28,900
- − Mortgage interest
- −$3,697
- − Property taxes
- −$990
- − Insurance
- −$330
- − Repairs & maintenance
- −$2,312
- − Management
- −$2,312
- − Depreciation
- −$1,920
- Taxable income
- $17,339
- Est. tax owed @ 24.0%
- −$4,161
- After-tax cash flow
- $13,196/yr
For passive investors: Depreciation is non-cash, so a rental often shows a tax loss while cash-flowing — sheltering income. Rental losses are passive: they offset passive income freely, and up to $25,000/yr can offset ordinary (W-2) income if you actively participate and your MAGI is under $100k (phasing out to $0 by $150k); unused losses carry forward. On sale, claimed depreciation is recaptured at up to 25%, and gains may owe capital-gains tax (a 1031 exchange can defer both). Figures are a year-1 estimate at your 24.0% rate — not tax advice; consult a CPA.
Schools (NCES district)
- District
- Pinellas
- NCES district ID
- 1201560
- Math proficiency
- 51% ▼ -5.00%
- Reading proficiency
- 51% ▼ -3.00%
- Median HH income
- $46,270
- Composite
- 43.27/100
- National rank
- #3046
- State rank
- #31 of 73 in FL
Livability — St. Petersburg
No livability data for this city. (Only ~50 U.S. cities are tracked.)
Census & demographics
- Census place
- St. Petersburg, FL
- County
- Pinellas County · 939,478 people
- City population
- 249,151
- Metro
- Tampa-St. Petersburg-Clearwater, FL
- Population (ZIP)
- 33,796
- Household income
- $78,611
- Rent vs Own
- Severe rent burden
- 542.0
Population outlook (Pinellas County) Hauer SSP2
- Today (2025)
- 1,027,532 people
- By 2030
- 1,063,586 · +3.5%
- By 2040
- 1,125,020 · +9.5%
- By 2050
- 1,168,637 · +13.7%
- By 2075
- 1,265,188 · +23.1%
- By 2100
- 1,260,357 · +22.7%
Race, ethnicity, and origin ACS 2023
- Neighborhood character
- Predominantly White (77%)
- Race & ethnicity
- White 77% Two or more races 10% Hispanic / Latino 9% Asian 5% Black 4%
- Hispanic origin (detail)
- Mexican 1% Puerto Rican 2% Cuban 2%
- Common ancestry
- Lithuanian 3% Romanian 3% Slovak 2%
- Foreign-born
- 12% · Canada, Vietnam, China
- Languages at home
- 85% English-only · Spanish 7% Other Indo-European 2% Russian/Polish/Slavic 2%
Political lean MEDSL · Pinellas
- 2024 margin
- Lean R (+5.2) · D 46.9% · R 52.1%
- 2008→2024 swing
- -13.5pp toward R · 2008: 8.3pp · 2024: -5.2pp
- All cycles
- 2024: R+5.2 2020: D+0.2 2016: R+1.1 2012: D+5.6 2008: D+8.3
Not yet ingested
- Civics
- —
Market trends
- HPI YoY
- ▼ -547.31%
- Current HPI
- 405.0731
- Rent YoY
- ▼ -0.48%
- Metro
- Tampa-St. Petersburg-Clearwater, FL
- State GDP YoY
- ▲ 3.28%
- F500 in state
- 36
Industry mix (Fortune 500 HQ in FL)
| Industry | F500 HQs | Revenue |
|---|---|---|
| Industrial Technology | 2 | $29B |
|
||
| Insurance | 2 | $17B |
|
||
| Retail | 1 | $60B |
|
||
| Technology Distribution | 1 | $58B |
|
||
| Homebuilding | 1 | $35B |
|
||
| Technology Manufacturing | 1 | $35B |
|
||
Price history
+253.3% since first listed6 events — show timeline
- 2026-02-13 Price Changed $79,500 ForSaleByOwner.com
- 2026-01-21 Listed $78,500 ForSaleByOwner.com
- 2015-08-28 Listing Removed — Stellar MLS as Distributed by MLS Grid
- 2014-06-14 Relisted — Stellar MLS as Distributed by MLS Grid
- 2014-06-10 Listing Removed — Stellar MLS as Distributed by MLS Grid
- 2014-02-26 Listed $22,500 Stellar MLS as Distributed by MLS Grid
Cash-flow waterfall
monthlySold comps — $/sqft
last 12 mo · ≤1 miLoading sold comps…