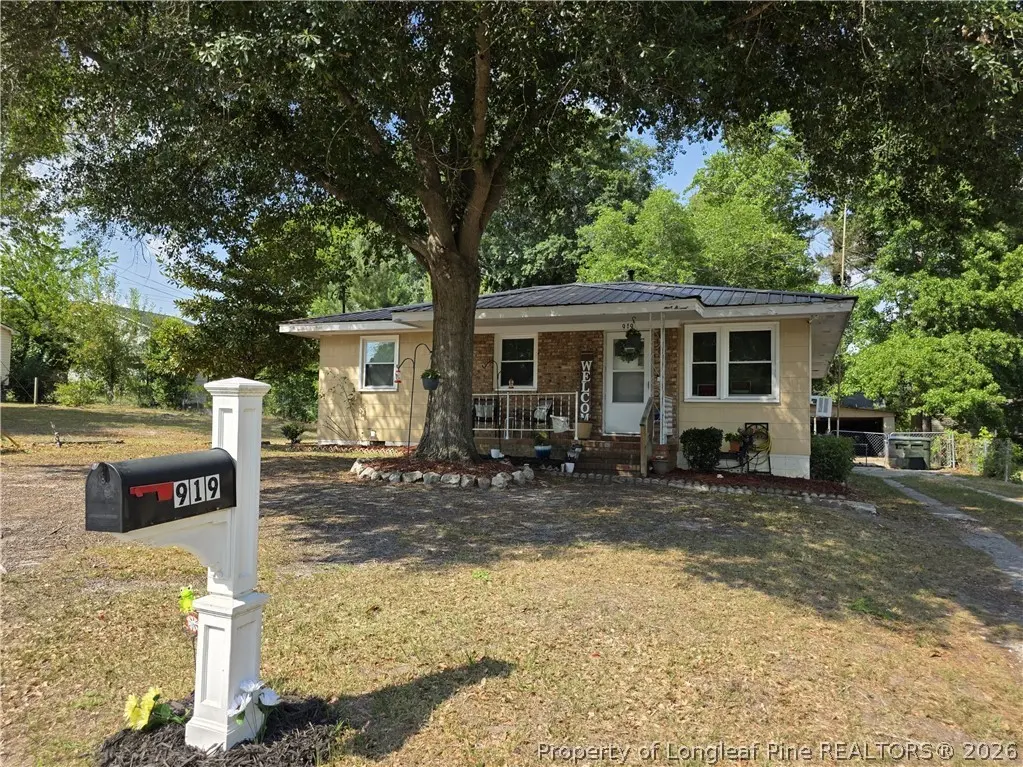
919 Fleetwood Dr · Fayetteville, NC
Flood risk 1/10 · Minimal
- FEMA flood zone
- X (unshaded)
- Chance of flooding over 30 yrs
- 0.0%
- Est. flood insurance / yr
- $507 – $1,088
Fire risk 4/10 · Minor
- Est. fire insurance / yr
- $906 – $1,684
Heat risk 7/10 · Major
- Hot days now (above 106°F)
- 7 days/yr
- Hot days in 30 yrs
- 16 days/yr
Wind risk 7/10 · Major
- Chance of severe wind over 30 yrs
- 78.0%
Air-quality risk 1/10 · Minimal
- Unhealthy air days now
- 0 days/yr
- Unhealthy air days in 30 yrs
- 0 days/yr
Risk factors via First Street. Map © Google.
Why this score? — see what drove the C+ grade
The composite is a weighted blend of 9 inputs, each scored 0–100. Each bar is that input's sub-score; the figure is the points it added to the 100-point composite (weight × sub-score).
- Cash flow +27.1/30.0
- DSCR +9.4/10.0
- 1% rule +7.5/10.0
- ARV discount +7.5/15.0
- Livability +3.8/5.0
- Rent growth +3.5/5.0
- Schools +3.1/10.0
- Condition / age +2.5/5.0
- Appreciation +0.0/10.0
$139,000
🖨 Deal sheet 📄 Offer letter ✓ Due diligence
Listing remarks
Unlock the full potential of this charming property whether you are a handy 1st time home buyer or an investor!!! 3 bedrooms-2 bathrooms cottage style offering over 1,600 sqft of living space with gorgeous hardwood floors in the living/dining area and updated PVC windows throughout the home replaced in 2022. The home already had love, it just needs work! Ideally situated just minutes from downtown, close to shopping, dining, and everyday conveniences, with direct access to 401 and 87 for an easy commute anywhere—including Fort Bragg.
Key facts
- Direct access to 401
- Updated pvc windows
- Close to dining
Tags
Property features AI
Exterior
- Utilities: Public water; Public sewer
- Home design: Single family residential property; Mixed Residential (MR5) zoning
- Construction: Brick veneer; Masonite exterior materials
- Exterior features: Front porch; Porch; Back yard fencing; Cleared, level lot
Interior
- Kitchen: Refrigerator
- Bedrooms: 6 total rooms (includes bedrooms and living spaces)
- Flooring: Hardwood; Vinyl
- Bathrooms: 2 full bathrooms
- Heating & cooling: Ductless heating; Window-mounted cooling units; Other heating
- Interior features: Eat-in kitchen; Crawl space basement
- Laundry & utility: Washer and Dryer in unit
Neighborhood map
What this means for you Summary
Snapshot
- This is a 3-bed/2.0-bath single-family listed at $139k.
Deal economics
- At list price, monthly cash flow is $392 ($5k/yr) — positive.
- The deal already cash-flows at list — no discount required.
- Meets the 1% rule at list price ($2k rent vs $139k).
- Cap rate 9.7% vs local median 4.9% in Fayetteville — top-decile yield for the area; either an underpriced asset or a hidden risk that comps aren't pricing in. Stress-test before assuming the spread holds.
Location & tenants
- Location reads 75/100 on livability (#45 in NC, #4,031 nationally) — a middle-class / working-renter tenant base. Strengths: commute A+, cost of living A+, housing A+; Watch: crime F, employment D-.
- Cumberland County Schools (urban): math 32% / reading 41% proficiency, ranked #126 of 178 in NC (top 71%) — families likely to look elsewhere, expect single-tenant / working-renter base with shorter leases.
- Zoned schools: Vanstory Hills Elementary (math 46% / reading 50%, grade D, #477 of 1,410 statewide, top 35%, 469 students, 99% FRL); R Max Abbott Middle (math 31% / reading 45%, grade F, #251 of 475 statewide, top 54%, 759 students, 99% FRL); Terry Sanford High (math 49% / reading 52%, grade D+, #306 of 535 statewide, top 57%, 1,224 students, 59% FRL) — zoned schools average 86% FRL vs 55% district-wide (31 pts higher); higher-poverty schools than district average — tighter screening recommended.
- Market conditions: Rents rising (+4.0%/yr); 102 active listings in the ZIP; 32 comparable units currently listed for rent nearby; rentals at typical pace (median 24d on market — plan ~3-4 weeks tenant-placement turnaround); solid renter incomes; 1,125 units permitted in Cumberland County in 2024 (104 in 5+ unit buildings).
Forward outlook
- Local home prices are declining (-3.0%/yr); year-one equity from $961 of loan paydown is wiped out by about $4k of value loss. Plan a longer hold.
- At projected returns (-3.0% appreciation + 4.0% rent growth), your $39k cash investment doubles in ~9 years — after that, you're playing with house money.
Negotiation context
- Only 5 days on market — expect competitive offers; lowballing is unlikely to land.
Risks & watch-outs
- Climate carrying-cost: major wind risk, 78% chance of damaging wind over 30y; extreme-heat days projected 7→16/yr by 2055 (HVAC capex compounding) — expect insurance premiums to compound above CPI over the hold.
Questions for the listing agent
- Built in 1962 — when were the roof, HVAC, electrical panel, plumbing, and water heater last replaced?
- Is there a deadline driving the sale (1031 exchange, divorce, estate, relocation)? That informs how much negotiation room exists.
- Crime grade is F in this area — have there been break-ins, vandalism, or insurance claims at this property in the last 3 years? What carrier currently insures it and at what premium?
- What's the average days-on-market for RENTAL listings here right now (not sales)? A rising rental-DOM trend means longer vacancies and softer asking-rent achievability than the comps imply.
- What's the recent tenant-quality profile in this submarket — average credit score on applications, eviction rate, late-payment / NSF rate, and stable-employment percentage? A property-management company in the area should have these aggregated.
- How much new for-sale + rental construction is in the pipeline within 1–3 miles? Heavy new supply typically softens prices + rents 12–24 months out; constrained supply supports both.
Investment metrics
- 1% rule
- 1.25% ✓
- Cap rate
- 9.67%
- Cash-on-cash
- 12.07%
- DSCR
- 1.54
- GRM
- 6.6
CMA / ARV
- ARV (on-the-fly)
- $281,750
- Comps found
- 12
Show comp detail 12 sales within ~0.75 mi
| Address | Dist | Beds/Ba | Sqft | Sold | Price | $/sf | Match |
|---|---|---|---|---|---|---|---|
| 1002 Fleetwood Dr | 0.12mi | 4/2.0 (+1) | 1,626 (+1%) | 2mo | $215,000 | $132 | 86 |
| 418 Bryan St | 0.40mi | 3/2.0 | 1,601 (-1%) | 4mo | $287,900 | $180 | 77 |
| 416 Bryan St | 0.42mi | 3/2.0 | 1,623 (+1%) | 10mo | $283,500 | $175 | 70 |
| 513 Vista Dr | 0.28mi | 3/2.0 | 1,474 (-8%) | 5mo | $261,000 | $177 | 69 |
| 416A Bryan St | 0.41mi | 3/2.5 | 1,623 (+1%) | 12mo | $289,500 | $178 | 68 |
| 420 Bryan St | 0.40mi | 3/2.5 | 1,718 (+7%) | 4mo | $290,900 | $169 | 65 |
| 543 Vista Dr | 0.30mi | 3/2.0 | 1,792 (+11%) | 6mo | $325,000 | $181 | 62 |
| 805 Perley St | 0.18mi | 4/2.0 (+1) | 1,422 (-12%) | 8mo | $171,900 | $121 | 60 |
| 930 Fleetwood Dr | 0.05mi | 4/3.0 (+1) | 1,400 (-13%) | 10mo | $204,900 | $146 | 59 |
| 304 Bryan St | 0.58mi | 3/2.5 | 1,581 (-2%) | 12mo | $279,990 | $177 | 58 |
| 1319 Levy Dr | 0.71mi | 3/2.0 | 1,428 (-11%) | 4mo | $185,000 | $130 | 44 |
| 1213 Branson St | 0.50mi | 4/2.0 (+1) | 1,842 (+14%) | 6mo | $305,000 | $166 | 42 |
Match score weights: distance 35% · size 25% · config 20% · recency 20%. Top-matched comps best support the ARV.
Projected returns pro-forma
-3.0% appreciation · 3.95% rent growth · sell at horizon
- IRR
- 2.7%
- Equity multiple
- 1.11×
- Total profit
- $4,137
- Equity at exit
- $20,725
- IRR
- 13.2%
- Equity multiple
- 2.10×
- Total profit
- $42,915
- Equity at exit
- $12,018
Cash invested: $38,920 (down + closing). Projections, not guarantees.
Landlord ↔ Tenant lean methodology
- Overall (STATE)
- 85 Strongly Landlord-Friendly
- State North Carolina
- 85 Strongly Landlord-Friendly · R+3
- County
- — inherits STATE
- City
- — inherits STATE
ZIP-level market 28305
- Home prices YoY
- -28.4%
- Rents YoY
- 4.0%
- Active inventory
- 102
- Price-to-rent
- 6.6×
Monthly cashflow live
- Estimated rent
- $1,742 high interval (Pro) →
- Mortgage (P&I)
- −$729
- Tax from tax record
- −$198 /mo · $2,377/yr
- Insurance
- −$58
- HOA
- −$0
- Vacancy / Maint / Mgmt
- −$366
- Net cashflow
- $392
Break-even live
UW: 25.0% down · 7.5% · 30yr · 1.5% tax · 5.0% vac · 8.0% maint · 8.0% mgmt
Financing live
Cash to close
- Down payment
- $34,750
- Closing costs
- $4,170
- Reserves months
- —
- Total cash needed
- —
Loan-product check · same deal, 3 products live
Conventional
25% down · 7.5% · 30yr
- Down + closing
- —
- Monthly P&I
- —
- Monthly cashflow
- —
- DSCR
- —
- Eligible?
- —
Personal DTI + credit; lowest rate.
DSCR
20% down · 8.5% · 30yr
- Down + closing
- —
- Monthly P&I
- —
- Monthly cashflow
- —
- DSCR
- —
- Eligible?
- —
No personal income docs; deal must DSCR.
Hard money
10% down · 12.0% · 12mo
- Down + closing
- —
- Monthly P&I
- —
- Monthly cashflow
- —
- DSCR
- —
- Eligible?
- —
Short-term bridge; refi at stabilization.
Rent comps 32 comps
| Address | Beds | Baths | Sqft | Rent | $/sqft | DOM | Units | Dist |
|---|---|---|---|---|---|---|---|---|
| 935 Fleetwood Dr Unit A Fayetteville, NC | 3.0 | 2.5 | 1600 | $1,650 | $1.03 | 23d | 1 | 0.05mi |
| 322 Valley Rd Fayetteville, NC | 3.0 | 2.0 | 1328 | $1,650 | $1.24 | 13d | 1 | 0.42mi |
| 1210 Simpson St Fayetteville, NC | 4.0 | 2.5 | 1917 | $2,200 | $1.15 | 23d | 1 | 0.50mi |
| 452 Cityview Ln Fayetteville, NC | 2.0 | 2.5 | 1088 | $1,200 | $1.10 | 23d | 1 | 0.54mi |
| 421 Cityview Ln Fayetteville, NC | 2.0 | 2.5 | 1050 | $1,700 | $1.62 | 23d | 1 | 0.56mi |
| 807 Branson St #2 Fayetteville, NC | 3.0 | 2.0 | 1304 | $1,350 | $1.04 | 23d | 1 | 0.61mi |
| 1319 Levy Dr Fayetteville, NC | 3.0 | 2.0 | 1428 | $1,700 | $1.19 | 13d | 1 | 0.68mi |
| 2937 Delaware Dr Fayetteville, NC | 4.0 | 2.5 | 2149 | $1,995 | $0.93 | 13d | 1 | 0.70mi |
| 1406 Raeford Rd Fayetteville, NC | 2.0 | 2.0 | 1176 | $1,650 | $1.40 | 13d | 1 | 0.75mi |
| 1513 Raeford Rd Fayetteville, NC | 3.0 | 2.0 | 2201 | $2,400 | $1.09 | 23d | 1 | 0.76mi |
| 522 Jernigan St Fayetteville, NC | 3.0 | 2.5 | 1406 | $1,650 | $1.17 | 23d | 1 | 0.80mi |
| 1100 Clarendon St #402 Fayetteville, NC | 2.0 | 2.0 | 1073 | $1,400 | $1.30 | 21d | 1 | 0.89mi |
| 2610 Trenton Rd Fayetteville, NC | 3.0 | 2.0 | 1762 | $2,000 | $1.14 | 13d | 1 | 0.90mi |
| 708 Marketview Ct Fayetteville, NC | 3.0 | 2.0 | 1584 | $1,700 | $1.07 | 23d | 1 | 0.93mi |
| 211 Ellington St Fayetteville, NC | 2.0 | 1.5 | 1050 | $1,395 | $1.33 | 23d | 1 | 0.94mi |
| 1507 Westlawn Ave Fayetteville, NC | 2.0 | 2.0 | 1386 | $1,500 | $1.08 | 23d | 1 | 1.05mi |
| 123 Pennmark Pl Fayetteville, NC | 2.0 | 2.5 | 1380 | $1,600 | $1.16 | 13d | 1 | 1.12mi |
| 318 Fairwood Ct Fayetteville, NC | 3.0 | 2.0 | 1126 | $1,550 | $1.38 | 23d | 1 | 1.14mi |
| 214 Hay St Unit B Fayetteville, NC | 2.0 | 2.0 | 1700 | $1,685 | $0.99 | 23d | 1 | 1.22mi |
| 123 Anderson St Fayetteville, NC | 2.0 | 2.0 | 1500 | $1,800 | $1.20 | 23d | 1 | 1.25mi |
| 516 Loom Dr Fayetteville, NC | 3.0 | 2.5 | 2168 | $2,200 | $1.01 | 23d | 1 | 1.26mi |
| 501 Lambert St Fayetteville, NC | 2.0 | 2.0 | 1200 | $1,230 | $1.02 | 13d | 3 | 1.26mi |
| 2346 Spinning Wheel Rd Fayetteville, NC | 4.0 | 2.5 | 1877 | $2,050 | $1.09 | 23d | 1 | 1.28mi |
| 1137 Meadow Creek Rd Fayetteville, NC | 3.0 | 2.0 | 1403 | $2,000 | $1.43 | 23d | 1 | 1.29mi |
| 2012 Fig Ct Fayetteville, NC | 3.0 | 2.5 | 1676 | $1,945 | $1.16 | 23d | 1 | 1.32mi |
| 1713 Fort Bragg Rd Unit 1367383P Fayetteville, NC | 4.0 | 2.0 | 1894 | $3,565 | $1.88 | 13d | 1 | 1.36mi |
| 104 Brett Ct Fayetteville, NC | 2.0 | 2.5 | 1210 | $1,400 | $1.16 | 21d | 1 | 1.40mi |
| 1228 Woodland Dr Unit 1 Fayetteville, NC | 2.0 | 2.0 | 1465 | $1,595 | $1.09 | 13d | 1 | 1.41mi |
| 571 Winding Creek Rd Unit F Fayetteville, NC | 3.0 | 2.5 | 1452 | $1,295 | $0.89 | 13d | 1 | 1.41mi |
| 424 Pearl St Unit 1367380P Fayetteville, NC | 4.0 | 3.0 | 2077 | $4,419 | $2.13 | 13d | 1 | 1.46mi |
| 2123 Burnett Ave Fayetteville, NC | 3.0 | 2.0 | 1100 | $1,600 | $1.45 | 23d | 1 | 1.48mi |
| 1813 Stetson Ln Fayetteville, NC | 3.0 | 2.0 | 1730 | $2,095 | $1.21 | 13d | 1 | 1.50mi |
Listing history 6 events
-
2026-06-18status $139,000 Pending 5 DOM
-
2026-06-17days on market $139,000 Active 5 DOM
-
2026-06-16days on market $139,000 Active 4 DOM
-
2026-06-15days on market $139,000 Active 3 DOM
-
2026-06-13remarks 542-char remark
-
2026-06-13$139,000 Active 1 DOM
ⓘ Source: listings_history table (triggers on properties + properties_extension) + one-shot
backfill from property_details.listing_events for pre-trigger history.
Tax reassessment forecast NC · Resets to sale price
- Current annual tax
- $2,377 · $198/mo
- Projected year-2 tax
- $2,377 · $198/mo
- Expected delta
- $0/yr ($0/mo · 0.0%)
ⓘ Screening estimate from a state-policy table — verify with the county assessor before closing.
Climate risk First Street
- Flood 1/10 Low FEMA zone X (unshaded) · 0% chance over 30 yrs
- Wildfire 4/10 Moderate
- Heat 7/10 Severe 7 d/yr ≥106°F today · 16 d/yr by 30 yrs out
- Wind 7/10 Severe 78% chance of damaging wind over 30 yrs
- Air quality 1/10 Low 0 unhealthy d/yr today · 0 by 30 yrs out
Nearby sold comps map
Loading sold comps map…
Walkable amenities ~0.75 mi
Loading nearby amenities…
Taxation est. · year 1
- Rental income
- $20,908
- − Mortgage interest
- −$7,786
- − Property taxes
- −$2,377
- − Insurance
- −$695
- − Repairs & maintenance
- −$1,673
- − Management
- −$1,673
- − Depreciation
- −$4,044
- Taxable income
- $2,661
- Est. tax owed @ 24.0%
- −$639
- After-tax cash flow
- $4,060/yr
For passive investors: Depreciation is non-cash, so a rental often shows a tax loss while cash-flowing — sheltering income. Rental losses are passive: they offset passive income freely, and up to $25,000/yr can offset ordinary (W-2) income if you actively participate and your MAGI is under $100k (phasing out to $0 by $150k); unused losses carry forward. On sale, claimed depreciation is recaptured at up to 25%, and gains may owe capital-gains tax (a 1031 exchange can defer both). Figures are a year-1 estimate at your 24.0% rate — not tax advice; consult a CPA.
Schools (NCES district)
- District
- Cumberland County Schools
- NCES district ID
- 3700011
- Math proficiency
- 32% ▼ -2.00%
- Reading proficiency
- 41% ▼ -1.00%
- Median HH income
- $44,168
- Composite
- 31.0/100
- National rank
- #6096
- State rank
- #126 of 178 in NC
Livability — Fayetteville
- Score
- 75/100
- State rank
- #45
- US rank
- #4031
Category grades
Schools grade is shown separately in the Schools card above.
Census & demographics
- Census place
- Fayetteville, NC
- County
- Cumberland County · 265,314 people
- City population
- 226,118
- Metro
- Fayetteville, NC
- Population (ZIP)
- 5,710
- Household income
- $78,148
- Rent vs Own
- Severe rent burden
- 344.0
Population outlook (Cumberland County) Hauer SSP2
- Today (2025)
- 330,855 people
- By 2030
- 333,523 · +0.8%
- By 2040
- 335,583 · +1.4%
- By 2050
- 335,325 · +1.4%
- By 2075
- 342,853 · +3.6%
- By 2100
- 340,698 · +3.0%
Race, ethnicity, and origin ACS 2023
- Neighborhood character
- Majority White (64%)
- Race & ethnicity
- White 64% Black 19% Hispanic / Latino 9% Two or more races 5% Asian 3%
- Hispanic origin (detail)
- Mexican 4% Puerto Rican 1% Dominican 2%
- Common ancestry
- Slovak 5% Serbian 3% Italian 2%
- Foreign-born
- 5% · Canada, South Korea
- Languages at home
- 89% English-only · Spanish 7% Tagalog/Filipino 1% Other Indo-European 1%
Political lean MEDSL · Cumberland
- 2024 margin
- D (+13.4) · D 56.1% · R 42.7% · Other 1.2%
- 2008→2024 swing
- -4.3pp toward R · 2008: 17.7pp · 2024: 13.4pp
- All cycles
- 2024: D+13.4 2020: D+16.6 2016: D+16.0 2012: D+19.7 2008: D+17.7
Not yet ingested
- Civics
- —
Market trends
- HPI YoY
- ▼ -90.32%
- Current HPI
- 227.8969
- Rent YoY
- ▲ 3.95%
- Metro
- Fayetteville, NC
- State GDP YoY
- ▲ 3.28%
- F500 in state
- 26
Industry mix (Fortune 500 HQ in NC)
| Industry | F500 HQs | Revenue |
|---|---|---|
| Financial Services | 2 | $213B |
|
||
| Retail | 2 | $95B |
|
||
| Industrial Conglomerate | 1 | $38B |
|
||
| Metals / Steel | 1 | $35B |
|
||
| Utilities | 1 | $30B |
|
||
| Industrial Machinery | 1 | $19B |
|
||
Price history
-41.8% since first listed2 events — show timeline
- 2026-06-12 Price Changed $139,000 LPRMLS
- 2026-06-12 Listed $239,000 LPRMLS
Property tax history
+8.1%/yrLatest (2025): $2,377 · +126.9% YoY. Source: county tax records.
Cash-flow waterfall
monthlySold comps — $/sqft
last 12 mo · ≤1 miLoading sold comps…